This is our first official blog entry, so ‘Welcome’! For years we’ve wanted to start a blog, but never really found the time, nor did we find a topic that we thought was compelling enough to start with.
My name is Sebastian. I am the technical lead at yWorks and the architect for most of what constitutes our yFiles family of diagramming SDKs. I could have written a lot of rants about buggy web browser implementations, ugly hacks needed in Silverlight, WPF, JavaFX, Flash, Swing, and many more technologies, but I’ve always reconsidered and thought it would be a bad way of starting a blog series.
“Project Days” at yWorks
Finally a good opportunity to start a series of entries has come, though. Every summer we hold our annual “Project Days”. This is the a time of about two weeks where our developers work on projects that would usually not be put on our road map or get postponed year after year because of more important things. For the project days all developer are free to suggest projects and gather themselves in groups to work on a project that interests them. Afterwards every project is presented and everyone votes on their favorite.
It’s always a great pleasure seeing the developers work on these projects. In those two weeks the atmosphere in our offices is quite different, with teams competing against each other and trying to get the best results in a very short amount of time.
I would like to start the blog post series by presenting the 2017’s Project Days winning project:
The “Sound Graph” Project
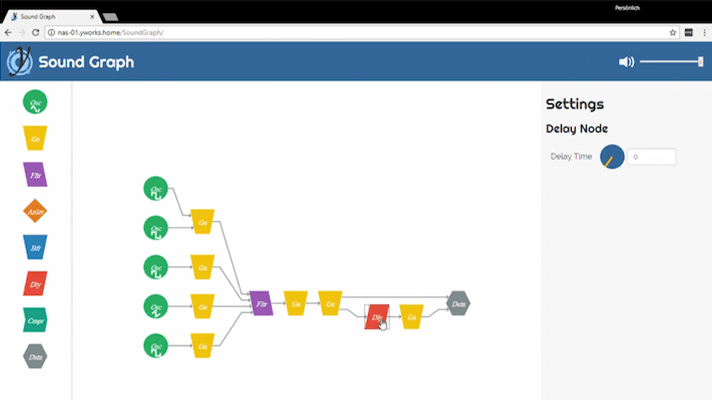
The goal of this project was to create an application using the yFiles for HTML diagramming library to allow users to graphically create synthesized instruments and whole music compositions inside their web browser. The Web Audio API is a programming API that allows for the composition and configuration of sound-producing elements. Audio sources like sine wave generators or audio buffers that contain prerecorded or precomputed sounds can be connected via filter and distortion elements to audio sinks like stream data buffers or speaker output. The composition of these sources, sinks, and filter elements is done with a graph-like API and of course lends itself perfectly to visual editing with a general-purpose graph editing library like yFiles for HTML.
Our engineers had no previous experience working with the audio API or implementing sequencer/synthesizer software so the team of three developers had four days to learn the Web Audio API, and to design and implement the web application.
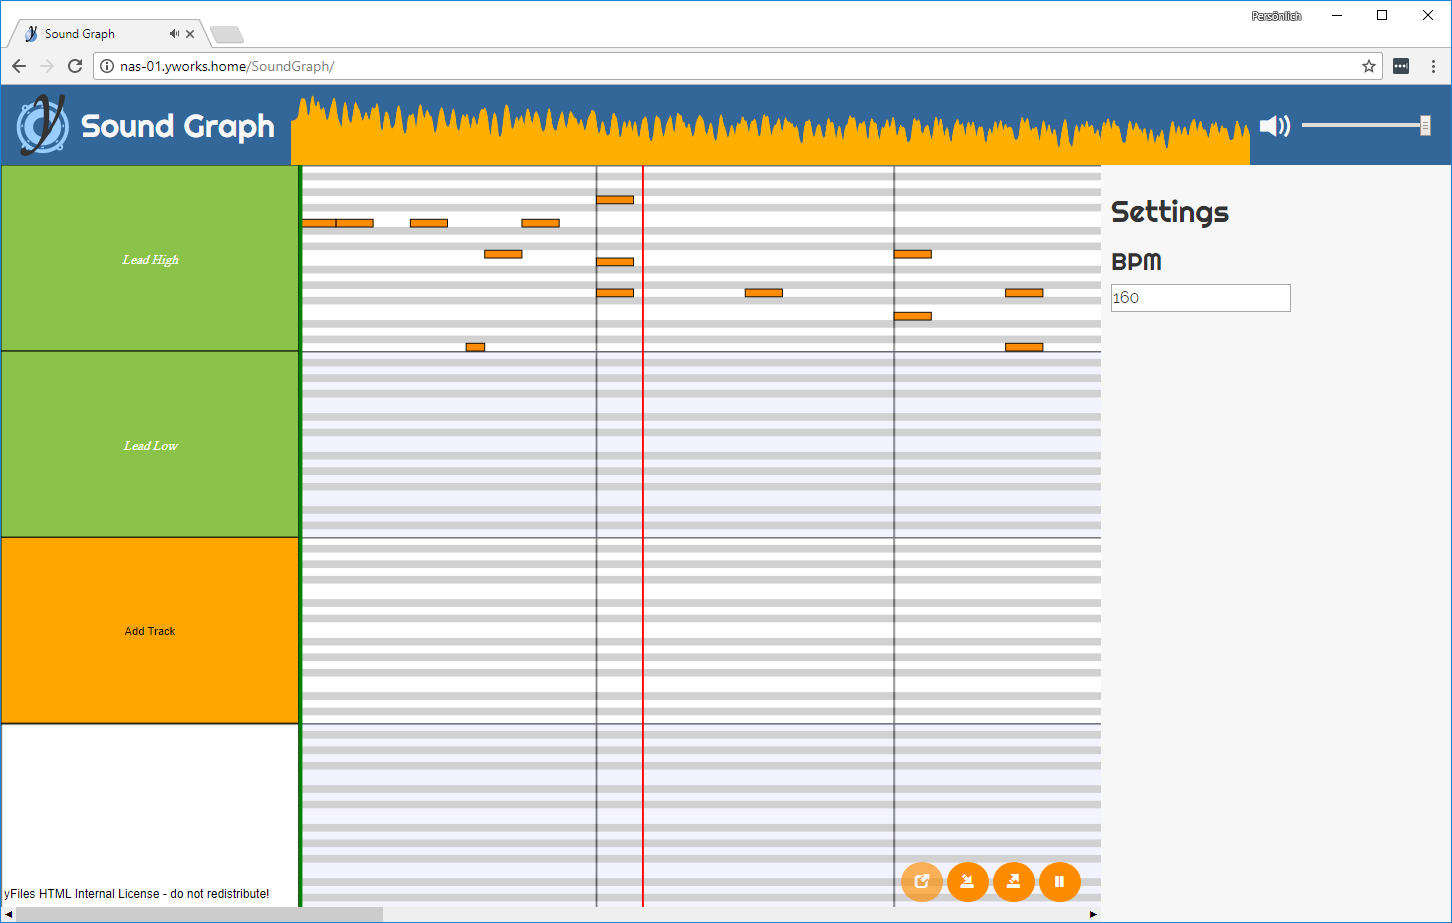
The final application that they had created allows the user to create, design, configure, and test “instruments” using a graphical interface. Users can connect audio sources and filters to audio sinks. Filter elements include gain, distort, reverb, compress, delay, etc.
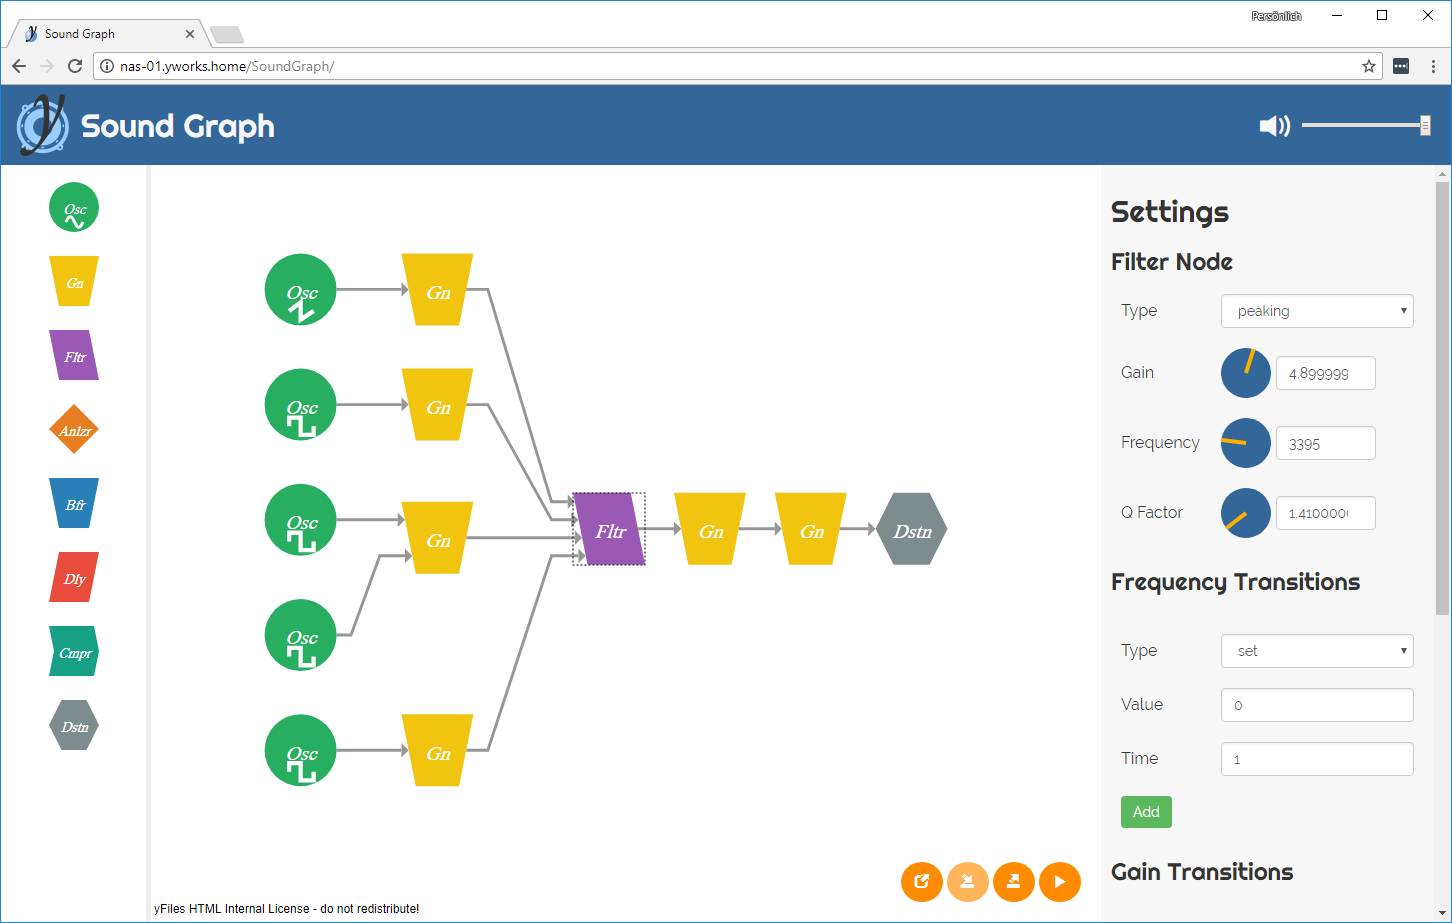
yFiles provides a hierarchic graph layout style that fits perfectly for such diagrams. It highlights the main flow in a directed graph and creates a very compact, but technically looking, clear result. In the case of these “instrument graphs” the flow is mainly from audio sources, via processing nodes, to audio sinks, but it can contain feedback loops as well.
The layout is automatically adjusted whenever new elements are added:
After the designer for the sound of the “instruments” had been finished, the app should also be able to play complete tunes, so there is a second view – also powered by yFiles – that represents a digital audio workstation (DAW) with a “piano roll”. Even though this is not a typical graph, a lot of yFiles’ features could be re-used for the piano roll:
- nodes are used for the notes in the piano roll.
- the snapping feature was used to snap notes to other notes and for quantization into the timing grid
- background grid rendering was used to efficiently render an infinitely scrollable grid
- virtualization allows for efficiently rendering even complex piano rolls with thousands of notes
- marquee and multi-selection enables to eficiently copy, duplicate, and transpose parts of the piano roll
Last but not least the default GraphML storage mechanism was used to conveniently serialize both the piano roll, the instrument graphs, and the playback settings to and from the file system.
The team was the first team to ever win the best project award unanimously with their “SoundGraph” project. Everyone was impressed by the presentation which included a few sample instruments as well as renditions of “Popcorn” by “Hot Butter” and the “Super Mario Bros.” theme. A team of just three JavaScript developers had managed to learn a completely new programming topic and API and built and presented a working and enjoyable synthesizer and sequencer app within less than four days of work! And to top it all, they also found and fixed a small bug in the implementation of the grid visualization in yFiles for HTML, so in the end even our customers indirectly benefited from this rather unusual project. :-)
This was the first project I wanted to share in this blog. I hope we can find the time to present the other cool projects that we had built during the last few years. So stay tuned and subscribe to our blog to learn more about these other cool projects we did:
- An interactive template designer for creating visualization templates for yFiles for HTML and Vue.js.
- A Scotland Yard-like game created with yFiles overlaid on Google Maps
- Automatic generation of schematic Metro Maps from OpenStreeMap data
- Automatic creation of diagrams visualizing story lines in books and movies
- Interactive 3D graph navigation in the browser using WebGL
- ...