Hero image for Graphs in Digital Marketing Optimization

Graphs in Digital Marketing Optimization

Digital marketing optimization is both big business and a big data, exploiting the whole arsenal of machine learning and big data engineering. Still, on a UI and conceptual level data visualization remains crucial for one’s understanding towards tuning touch-points. Sankey diagrams, if shaped appropriately, compellingly enact the interaction flow and bring forward the crux of your digital marketing. We demonstrate how the yFiles diagramming library can articulate this and help you to implement your own vibrant marketing visualization.

How to get to Rome?

Once upon a time, all roads were leading to Rome. Today Rome is still a popular holiday destination, and many roads - not all - lead to it. Many roads lead elsewhere, and unless you have Rome as your destination, you can end up pretty much anywhere in the world. Imagine, for a moment, that for your yearly holiday you would not decide about your destination in advance, where would you end up? You would not end up in a random place because your preferences define every next step, let’s say based on your cultural or culinary preferences. At each step, you make a choice, and this directs you towards some city or point of interest. Let’s presume Rome is the ultimate destination considering your preferences, how would you be able to end up in Rome without consciously deciding to go there (or even knowing about it)? Without any intermediate pointers, hints, or references to Rome, you would never get there. Clues and enticing elements need to point you towards it. This does not mean you would travel via the most optimal roads or series of intermediate cities. In fact, you can end up somewhere completely different if the clues are not positioned well, and the directive elements do not seduce you. Tourism is in a way precisely this: giving people lots of hints and hoping they buy it.

Converting visitors

Imagine you need a new car, how do you proceed? You have some preference, a budget, and some ideas. Visiting a vendor’s website is a good move, of course. How many pages of the site will you visit? If the website is well-designed and answers well your questions, you will dig deeper and potentially ask for an offer. In marketing terms, the website should guide you towards a key-page where you get converted. Conversion, in this sense, can be many things: downloading a white-paper, buying something, sending a mail, signing up and so on.

use case digital marketing pexels photo 802024 2

In many cases, conversion means buying. A good e-commerce website manages to guide you via intermediate pages and links towards conversion: special promotions, banners, shouting hyperlinks, pretty picture, etc., anything and everything to make you buy the product. The destination is 'buying', and the intermediate clues are all there to entice you towards the conversion. Just like our example of Rome above, you initially did not decide to get converted (by landing somewhere on the website), but the site pushed you in that direction. Digital marketing optimization is all about converting visitors and finding the right clues and hints to do so.

All roads lead to conversion

Let’s focus on buying a digital product via a website. The analogy with roads and cities is valid in the following sense:

  • Cities are web pages, and there is a particular series of pages called the 'check-out process.' There may be a single or multiple pages, but visitors are only effectively converted when they have pressed the 'commit' or 'confirm' button.

  • Hyperlinks, buttons, and other elements leading to another page are direction signs along the roads. In marketing terms, one speaks of touchpoints: something the user interacts with on the way to conversion.

  • A path consists of a series of intermediate pages or parts of a page.

  • Optimal conversion corresponds to the most efficient road towards a city. In a way, your GPS gives you the optimal conversion from where you stand to your destination.

  • Alternative roads and points of interest are only valuable if they manage to keep you on the way to your destination. For instance, it’s unlikely that while visiting Paris, you get to see direction signs to Rome. Similarly, engaging website visitors to watch videos unrelated to the product is unlikely to seduce them to buy it. Typically, forums and documentation sites are valuable for existing customers but usually do not have a clear path towards buying something. It does not mean that somebody cannot get convinced about a product via documentation, but that the path from being convinced to effectively buying it should be as smooth as possible. Creating an account, confirming your address, broken links, server issues…​ the little details which can make or break conversion.

Note that even during the check-out process, one can exit. For this reason, no other pages are hyperlinked during this process to discourage exiting and enforce finishing the process, a bit like forcing tourists to enter the museum when standing in front of it.

Optimizing your website’s conversion rate

How does one optimize conversion? This is a business and research domain on its own, and there are well-known proven approaches: A/B testing, search optimization (indexing), banners, and ads. Google Analytics is often used during Social Media Optimization (SMO) to analyze what visitors do (or try to do). The more tedious and expensive approach goes via data gathering and analysis. That is, one collects as much data from touchpoints as possible and tries to 'see' where visitors get lost on the way to conversion. Once the inadequate exit points and possible shortcuts to a faster conversion are identified, the website is altered, and new data is collected to 'prove' the newly discovered insights. A/B testing is nothing but assigning to different visitors a different alternative and demonstrate or find the best alternative. When an optimized strategy is found via data analysis, it’s often tested through an A/B process to show that the hypothesis is correct in the real-world and not just theoretically.

use case digital marketing MarketingMarkovWhite 2

Outside the conventional basic approaches to optimization, one finds well-guarded corporate secrets involving approaches like portfolio optimization techniques, multi-channel attribution modeling, hidden Markov models, and much more. By combining social network data and graph analysis, one can go beyond all this, often referred to as the 360-degree approach. One tries to capture as much as possible about products and potential buyers on all available channels: mail, social media, account, buying history, anything. You do not need to include social network data to see how graphs are an integral part of marketing optimization, however.

Modelling visits as graphs

Like roads and cities form a graph, so do web pages and touchpoints. The links between touchpoints correspond to transitions, and the more visitors make the transition, the more relevant a link is. Hence, the corresponding data model is a weighted, directed graph. The graph is a directed graph but is by no means without cycles (it’s not acyclic): visitors can go back and forth between two pages or end up on a previously visited page after a long detour. Note that a heavy link is not necessarily an important link towards conversion, it is simply used a lot.

As a side-note, the transition from a big dataset to a graph is conceptually simple but technically often a big-data challenge. Streaming info about thousands of touchpoints from thousands of visitors demands a special infrastructure. Storing the data, transforming it (ETL), and analyzing it usually involves Hadoop-like techniques leading to large budgets and dedicated teams.

Reducing complexity

Assuming this huge graph is available, how does one proceed? What does it take to find the optimal routes towards conversion(s)? Because visitors can enter a site via any page and transition in endless ways, the task of finding optimal routes is not as simple as finding the shortest paths or spanning trees in the graph. The sheer size of the graph usually makes this approach intractable. A possible road ahead goes via some abstract constructs and simplifications:

  • Whatever your data is, noise is inevitable. Still, given enough data, the noise can be filtered out thanks to some universal laws and ingenious statistical techniques.

  • A graph representing transitions is a representation of a so-called Markov chain, and looking at visitor behavior in this fashion means you can use lots of algorithms based on Markov chains.

  • By cutting off the less probable transitions, one can simplify things a lot. For example, one typically don’t care about visits of the 'terms and conditions' page.

  • Disconnected parts of the graph containing the conversion touchpoint, paths not leading to conversion, loops, and cycles can all be discarded since they do not contribute to hot-paths.

At this point, the following insight helps the most:

Replacing the large amount of data gathered from each single transitions with the probability of making a transition from one touchpoint to another makes the problem much more manageable.

The result is a weighted directed graph with a much lower number of edges. Its edge weights correspond to the transition probabilities and are a direct mirror of people’s behavior on the website and, as such, not just some abstract theoretical construct.

The crucial cut-off threshold in all of this is which probabilities you wish to take into account, what is the threshold above which you include transitions? The lower the threshold, the more paths you allow. The higher the threshold, the more you focus on the most critical paths (hot-paths).

Hot-paths as Sankey diagram

The hot-paths can be deduced from the resulting graph by looking at the shortest weighted paths. One looks at the heaviest paths since they comprise the paths with a high probability towards the conversion node. The conversion node is considered as an endpoint, and all heavy paths from the other nodes are considered. The resulting set of paths do not form a tree as one might initially think since any touchpoint can lead to any other and can itself be an intermediate one. Instead, the set of paths form a subgraph from the initial graph (Markov chain) describing the best possible paths towards conversion given the threshold value.

Decision-makers, executives, and marketers usually do not get excited by the latter statement, and this is where data visualization comes in. One could represent things via standard graphs, but the Sankey representation is particularly well-suited because

  • the horizontal flow emphasizes the motion from incoming visitors (on the left) flowing towards conversion (on the right),

  • the thickness of the bands is an indication of the strength of a transition,

  • the colors of the bands can be used to indicate the hotness of path: how fast a touchpoint leads to conversion.

Of course, such a Sankey diagram is often not the end of the story but part of a bigger picture. It can be complemented by other statistical techniques, and might contradict or corroborate other findings.

Creating a marketing visualization application

yFiles is a commercial programming library designed explicitly for graph visualization and is a perfect fit for the generation of Sankey diagrams. Amongst others, yFiles provides a sophisticated implementation of a layered graph layout algorithm that is well suited for small and large graphs, and can be easily configured for drawing Sankey diagrams.

Compared to ready-to-use Sankey drawing tools, a custom marketing visualization application built with yFiles can, for example,

  • automatically connect to your data source,

  • provide tailored filtering for your data,

  • use the powerful graph analysis algorithms,

  • integrate in your workflow, and more.

use case digital marketing screenshot

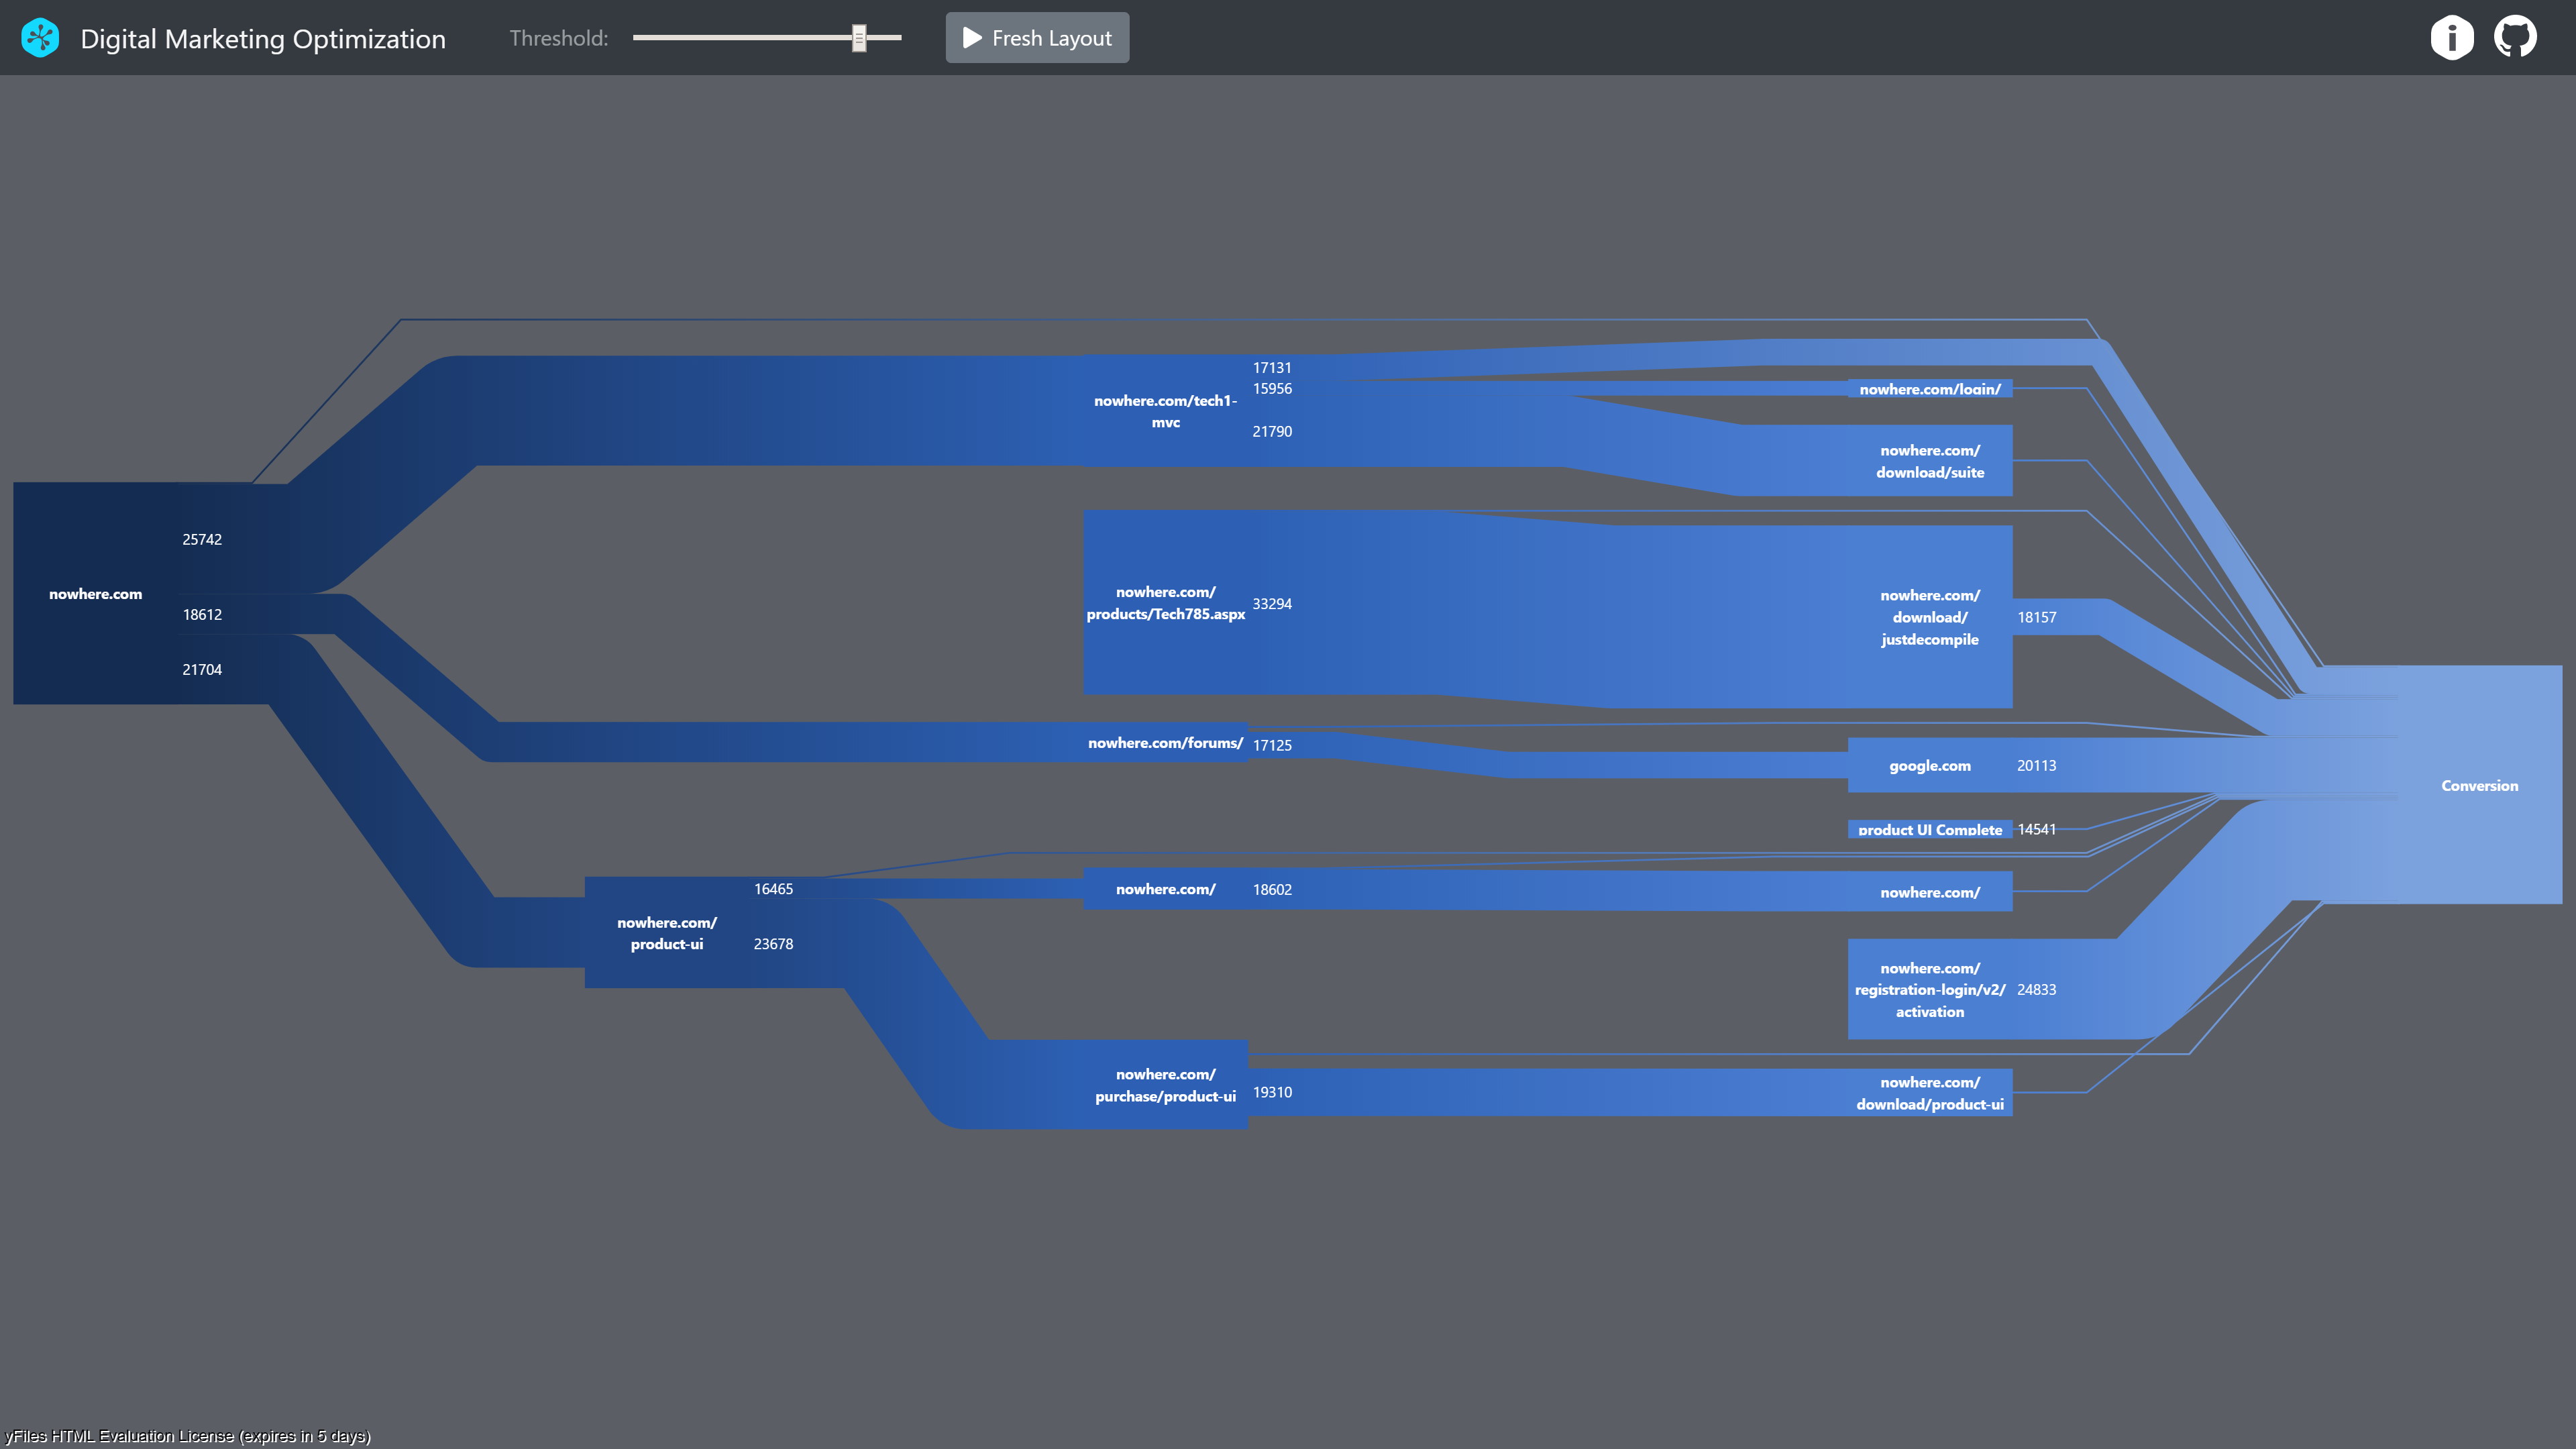
The Digital Marketing Optimization demo application that accompanies this use case contains a sample dataset of a probability graph of the transitions of a fictive company website. The data is representative of a typical organization selling digital goods. Note that the reduction from the original data to this graph is not part of the implementation.

In the application, users can specify the threshold of the transition probability, giving a coarser or finer set of hot-paths. After each change, the transition into the new layout preserves as much as possible of the previous state, enabling users to retain their mental map of the data.

Get the source code

The source code of the Digital Marketing Optimization demo application is available on GitHub. See the included readme file for usage instructions and implementation notes.

You need a copy of the yFiles for HTML diagramming library in order to run this application. You can download a free test version of yFiles in the yWorks Customer Center.

Why yFiles?

Most complete solution

Since 2000, yWorks is dedicated to the creation of professional graph and diagramming software libraries. yWorks enables clients to realize even the most sophisticated visualization requirements to help them gain insights into their connected data. The yFiles family of software programming libraries is the most advanced and complete solution available on the market, supporting the broadest range of platforms, integrations, input methods, data sources, backends, IDEs, and programming languages.

Perfect match for all use-cases

yFiles not only lets you create your own customized applications but integrates well with your existing solutions and dashboards on the desktop, on mobile, and on the web. Developers can use concise, rich, complete APIs to create fresh, new applications and user experiences that match your corporate identity and exactly fit your specific use-cases. Browse and choose from hundreds of source code demos and integrations to get ideas and get started in no time.

Honest, simple licensing

yFiles enables white-label integrations into your applications, with royalty-free and perpetual licensing. There are no third party code dependencies.

Industry-leading automatic layouts

yFiles has got you covered with a complete set of fully configurable, extensible automatic layout algorithms, that not merely render the elements on the screen but help users understand their data and the relationships just by looking at the diagrams.

Unmatched customizability

Decades of work went into the creation of the most flexible, extensible, and easy to use diagramming APIs that are available on the market. Everything may be customized with yFiles: data acquisition and import, graph creation, display, interaction, animation, layout, export, printing, and third party service connectivity.

Algorithms included

With yFiles, you can analyze your graphs, connected data, and networks both on the fly and interactively with a complete set of efficient graph algorithm implementations. Calculate centrality measures, perform automatic clustering, calculate flows, run reachability algorithms, find paths, cycles, and dependencies. For the best user experience, use the results to drive the visualization, interactivity, and layout.

Unequaled developer productivity

Developers quickly create sophisticated diagramming applications with yFiles. The extensive API has been carefully designed and thoroughly documented. There are developers’ guides, source code tutorials, getting started videos, and fully documented source code demo applications, that help to realize even the most advanced features. Inline API documentation lookup for all major IDEs with hundreds of code snippets and linked related topics make writing robust code a breeze. Integration samples for many major third party systems help in getting productive, quickly.

Not just a static viewer

With yFiles, you can do more than just analyze and view your data. Create interactive, deeply integrated apps that don’t just let you consume data sources, but also enable users to create, modify, and work with both existing and changing data. Integrate with third party services to automatically trigger actions and apply updates. With yFiles, there are no limits: you decide what your app can do.

High-performance implementations

While it is recommended not to overwhelm the end-user with overly complex graph visualizations, of course, all aspects of the library have been prepared to work with large amounts of data. Developers can create both high-quality diagram visualizations and rich user-interactions, as well as configure algorithms and visualizations to perform great for even the largest graphs and networks.

Generic data acquisition

You don’t need to let your users create the diagrams from scratch or use a particular file format. yFiles enables you to import graphs from any data source which is accessible via an API. Programmatically build the in-memory model using an intuitive, powerful API. Update the diagram live in response to external events and changes.

World-class support

Get the best support for your development teams. Directly connect with more than a dozen core yFiles library developers to get answers to your questions. If you don’t have the time to do the implementation or your team is not large enough to do the implementation, let yWorks help you with consultancy and project work to get your team and apps up running, quickly.

Proven solution

Customers from all industries all over the world have been using yFiles for almost twenty years for both internal and customer-facing applications and tools. See the references for a non-conclusive list.

Frequently Asked Questions

What is yFiles?

yFiles is a software library that supports visualizing, editing, and analyzing graphs and graph-like diagrams. It is not a ready-to-use application or graph editor. Instead, it provides a component for graph visualization, graph editor features, and an extensive set of algorithms for automatic data arrangement and graph analysis. Software developers can use yFiles to display, edit, and analyze diagrams in their own applications. yFiles is available for many platforms.

Which platforms does yFiles support?

Right now, yFiles supports HTML / JavaScript, Java (Swing), JavaFX, .NET (WinForms), and WPF.

What kind of applications can I create with yFiles?

Developers can use concise, rich, complete APIs to create fresh, new applications, and user-experiences that match your corporate identity and exactly fit your specific use-cases. yFiles enables white-label integrations into your applications, with royalty-free and perpetual licensing. Any application that works with or displays relational data in the form of graphs, diagrams, and networks can be built with the help of yFiles.

What devices can I target with yFiles?

yFiles not only lets you create your own customized applications but integrates well with your existing solutions and dashboards on the desktop, mobile, and the web. There are versions of yFiles available for all major platforms and frameworks.

How extensive is the graph API of yFiles?

yFiles offers the most extensive graph layout, visualization, and analysis APIs available commercially. In total, there are around ten thousand public API members (classes, properties, methods, interfaces, enumerations). yFiles uses a clean, consistent, mostly object-oriented architecture that enables users to customize and (re-) use the available functionality to a great extent. API components can be (re-)combined, extended, configured, reused, and modified to a very high degree. It is not mandatory to know the complete API, of course. Most applications only require a minimal subset of the full functionality, and the advanced functionality and APIs may only be required for implementing unique requirements.

As a developer, what can I expect from yFiles?

yFiles helps developers quickly create sophisticated diagramming applications. The extensive API has been carefully designed and thoroughly documented. There are developers’ guides, source code tutorials, and fully documented complete source code demo applications that help to realize even the most advanced features. Inline API documentation lookup for all major IDEs with hundreds of code snippets and linked related topics help in writing robust code, efficiently. Integration samples for many major third party systems help in getting productive, quickly.

Is yFiles Free?

No. yFiles is a commercial software library. If you decide to use yFiles in your application, you’ll have to pay a one-time fee. You also have the option to subscribe annually for technical support and updates.

How does the licensing work for yFiles?

yFiles enables white-label integrations into your applications, with royalty-free and perpetual licensing. There are no third party code dependencies. Licensing basically works on a per developer basis. Please refer to the pricing information and software license agreements of the respective product for more details.

What kind of support can I get for yFiles?

The yFiles libraries come with fully documented demo applications, detailed API documentation, and extensive developers’ guides. Apart from that, yWorks also offers professional support services for your development teams. They can connect directly with more than a dozen core yFiles library developers to get answers to their programming questions. Optionally, if you don’t have the time or necessary team, yWorks can help you with consultancy and project work to get you and your apps up running quickly.

How is the release cycle for yFiles?

There is no public roadmap for yFiles. yFiles usually gets a new major feature release about every 10 to 15 months, with bugfixes or minor maintenance releases in between as required. Typically there are between one and five bugfix releases for each major release, and previous releases get important bugfixes, too. yWorks tries very hard to keep the libraries and APIs backward compatible so that customers can update to the newest version of yFiles regularly with little to no effort and still benefit from performance improvements and new features.

Can I edit my graphs with yFiles?

With yFiles, you can do more than just analyze and view your data. You can have interactive, deeply integrated apps that don’t just let you consume data sources but also enable users to create from scratch, modify, and work with both existing and changing data. Integrate with third party services to automatically trigger actions and apply updates in real-time and publish changes to third party systems while the user works with the graph. It’s up to you to decide what your app can do.

What kind of layouts does yFiles support?

yFiles comes with the most extensive set of fully configurable, extensible automatic layout algorithms, that not merely render the elements on the screen but help users understand their data and the relationships just by looking at the diagrams. yFiles includes hierarchic, organic (force-directed), orthogonal, tree-like, radial, balloon-like, and special purpose layouts. yFiles also supports incremental, partial, and interactive layouts, as well as various edge routing and automatic label placement algorithms.

Are the layout algorithms configurable?

Layout algorithms support various settings and constraints and are fully customizable in code. They support different node sizes, nested groups, bundled edges, orthogonally and octilinearly routed edges, consider and automatically place node, edge, and port labels. Nodes may be partitioned and clustered, and different layout styles can be mixed in the same diagram.

What kind of graph analysis does yFiles support?

yFiles lets you analyze your graphs, connected data, and networks both on the fly and interactively with a complete set of efficient graph algorithm implementations. Choose from a range of different centrality measure implementations, automatic clustering algorithms, network flow algorithms, reachability and connectivity algorithms, pathfinding variants, cycle, and dependency analysis algorithms. For the best user experience, use the results to drive the visualization, interactivity, and layout.

What parts of yFiles can be customized?

yFiles has the most flexible, extensible, and easy to use diagramming APIs that are available commercially. Every aspect of the functionality is customizable with options ranging from high-level configuration settings, down to low-level implementation overrides: data acquisition, import, graph creation, display, interaction, animation, layout, export, printing, and third party service connectivity.

How can I get my data into yFiles?

End-users don’t need to create the diagrams from sketch or use a specific file format. yFiles lets you import graphs from any data source that is accessible via an API. Developers can populate the in-memory model using an intuitive, powerful API, directly connecting to their preferred data sources. Diagrams can be updated live in response to external events and changes.

How can I get my diagrams data back from yFiles?

The in-memory graph model lets you export all the information to any system and file format. There are built-in export options to various file and image formats, but as a developer, you can create your own glue code to connect to arbitrary data storage systems and third party services.

Is the diagram size limited?

Theoretically, the only limiting factor for the number of graph elements is the size of the computer’s memory. In practice, performance is also a limiting factor. For the vast majority of use-cases, yFiles delivers best-in-class performance out-of-the-box. For very large visualizations and data-sets, there are options available that let developers tune between features, running-time, and quality of the results. yFiles can deal with graphs of any size and is only bound by the memory available and the runtime complexity of the algorithms. Large graphs may require adjusting the default settings and performance depends on more than just the number of elements in the diagram, but also the structure of the graph, the algorithm and configuration, as well as platform and hardware capabilities.

Who is using yFiles, already?

Customers from almost all industries all over the planet have been using yFiles for nearly twenty years, to create both internal and customer-facing applications and tools. Clients include both single developers and the largest corporations and organizations in all of academia, public and governmental services, and of course, the commercial space. See the references for a non-conclusive list. Naturally, there are the big well-known software corporations among yWorks’ customers (unfortunately only some of them allow yWorks to list them on the references page), but there’s also a great lot of companies that are not traditionally known for software, but who still have their own IT departments create software for their intranet or customer-facing applications. And last but not least, smaller companies without IT departments that let third party implementors create useful diagramming applications with the help of yFiles for them. yFiles at its core is a generic diagramming component that is use-case agnostic and can be used to create graph and diagramming-centric applications for any business domain that requires working with or displaying connected data.

How long did it take to implement yFiles?

yFiles started as a university project at the University of Tübingen in the late 1990s. Since 2000, yWorks has taken over all development and has been working continuously with a core layout-team of two to eight developers on improving the layout algorithms. The layout algorithms alone, as of 2021, took more than seventy development years to implement. A team of more than 25 developers has been working on the implementation for the visualization and interaction and the support for the various platforms yFiles supports, totaling in more than a hundred years of development for the visualization. Porting yFiles to a new platform in the past took between three and about 15 development years. Most platform variations were implemented in between six and ten calendar months.

How long has yFiles been around?

yFiles started as a university project at the University of Tübingen in the late 1990s. The company yWorks was founded as a spin-off of the university in 2000 when the first commercial customers wanted a license for yFiles. Since then, it has been developing and improving the library. It all started as a Java library, and over time, yWorks improved and even rewrote large parts of the library to add new features and support new platforms.

Who is the company behind yFiles?

yWorks is the company behind yFiles. It was founded as a spin-off of the University of Tübingen in the year 2000 specifically for licensing and supporting yFiles commercially. The German company is a privately-held, headquartered in Tübingen. More than 30 employees are working at yWorks, over 20 of which are developers, working on yFiles and the tooling around the libraries. The library developers also provide support and implementation services to yFiles customers. So as a developer, you will get first-class, highest level support directly from the team that implements the libraries.

What does yWorks specialize in?

Since 2000, yWorks is dedicated to the creation of professional graph and diagramming software libraries. The software yWorks creates, enables customers to realize even the most sophisticated visualization requirements to help them gain insights into their connected data. Their main product is the software programming library family yFiles, which is the most sophisticated and complete solution available for diagramming applications on the market, supporting the broadest range of platforms, integrations, input methods, data sources, backends, IDEs, and programming languages. yWorks has set a track-record in providing the most extensive layout and diagramming solutions for developers on all major platforms. In addition to creating, maintaining and supporting the libraries, yWorks also provides professional consultancy services in the area of visualization and diagramming. In addition to that, yWorks also provides a set of smaller software tools, both free and commercial, end-user facing and for software developers, closed-source and open-source.

Does yWorks own all the intellectual property for yFiles?

yFiles does not depend on any third party library, except of course at runtime, where it depends on the runtime of the platform. yWorks owns the IP for all implementations in the core yFiles library. Some demos show the integration and make use of third party software, but they are not required for other cases.

Which papers and algorithms does yFiles implement?

The list of algorithms implemented by yFiles is long. For the common graph algorithms, we use the traditional implementations with the standard optimizations. For many of the layout algorithms, ideas for the implementation base on publicly available papers. Some algorithms (specifically the orthogonal layout and the balloon layout) we created and helped with the creation of the algorithms and (co-)published the papers for the algorithms. Most layout algorithms have been vastly modified, tuned, and enhanced, though, and don’t follow the original implementation ideas, anymore. yWorks added useful features to these implementations to make the algorithms work in less theoretical environments. We removed previously existing constraints of the original implementations and added new ideas to make the algorithms useful for real-world usage. For most of these changes and improvements, no papers have been published.

Can I get the papers for the layout algorithms used in yFiles?

For some of the algorithms, you will find papers that describe the core idea of the layout algorithms. For most algorithms, yWorks massively enhanced and modified the algorithms to support more advanced features that are frequently required in real-world diagrams. For these modifications, we did not publish any papers. As a commercial yFiles customer, you can obtain a license to the source code of yFiles where you can read, learn about, and modify the algorithms in documented source code form, according to the license terms.

Hide Description
Open in yEd LiveDownload