yEd Live, the popular diagram editor, has recently integrated ChatGPT, as an intelligent assistant that lets you generate diagrams from a simple text description. With this new feature, users can easily create visualizations for any topic that comes to their mind.
Learn about the process behind this integration, how we implemented it, the challenges we faced, and what you should keep in mind when using this powerful feature.
Launch yEd LiveMore about yEd Live
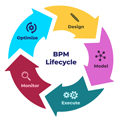
What happened before
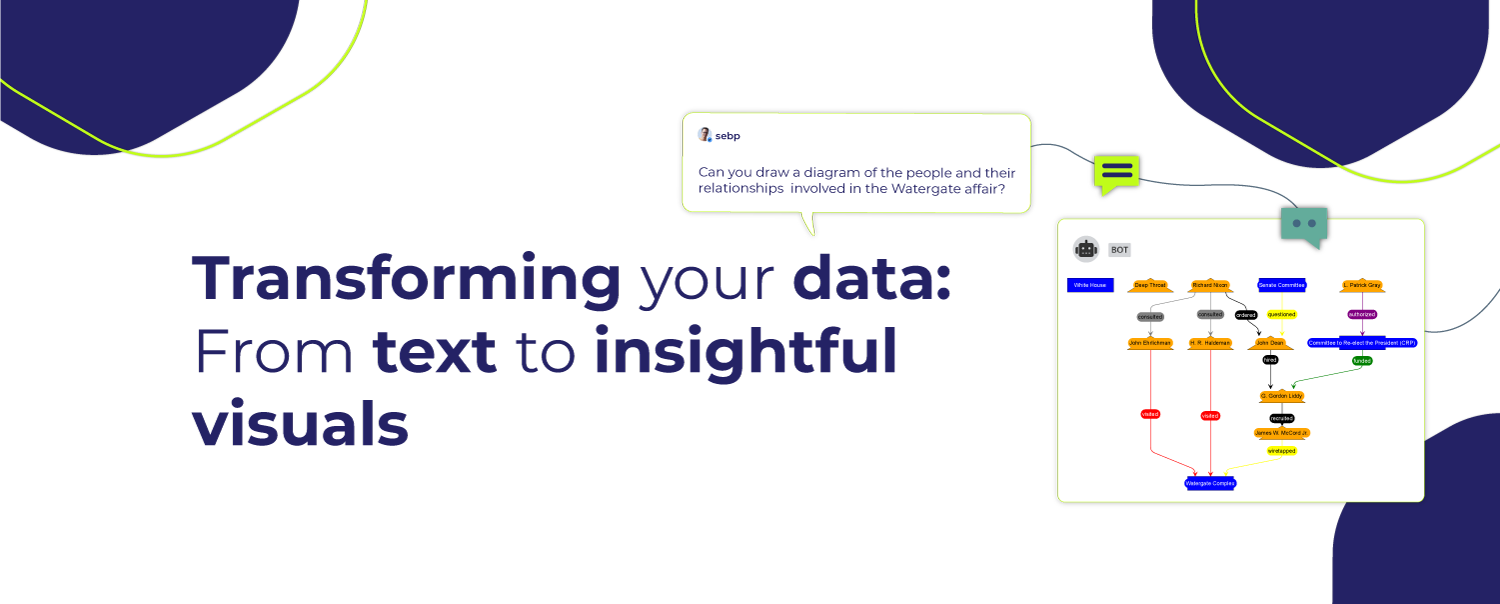
 The ChatGPT Mattermost Bot by yWorks
ChatGPT only offers text-based or ASCII-art responses. This can make it difficult to understand the structure of connected data. Thankfully, the ChatGPT Plugin API exists, which allows for the creation of plugins to enhance ChatGPT's features. Our team saw an opportunity to create a yFiles plugin that could easily transform ChatGPT's textual descriptions into stunning diagrams. First, we added this new yFiles service to our existing ChatGPT Mattermost Bot. Read more about this in the article Diagramming with ChatGPT!.
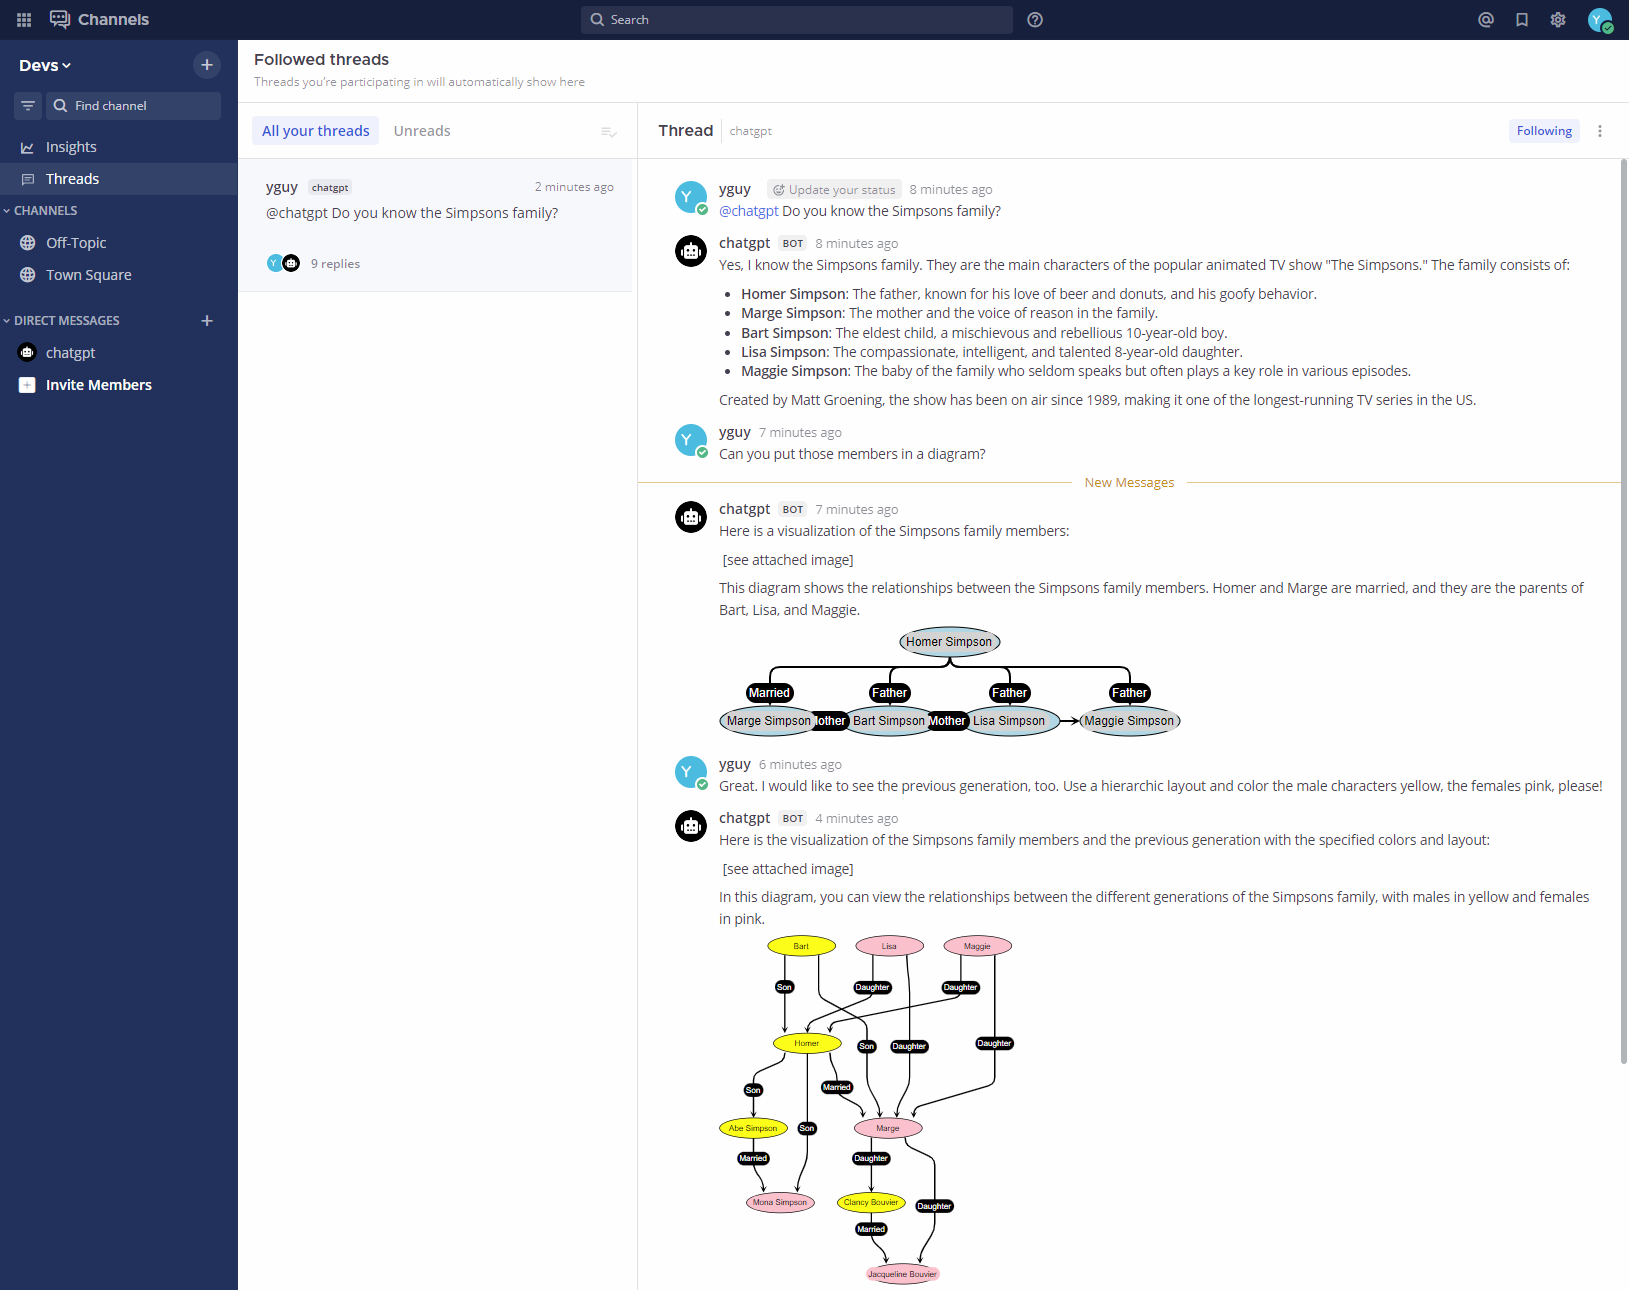
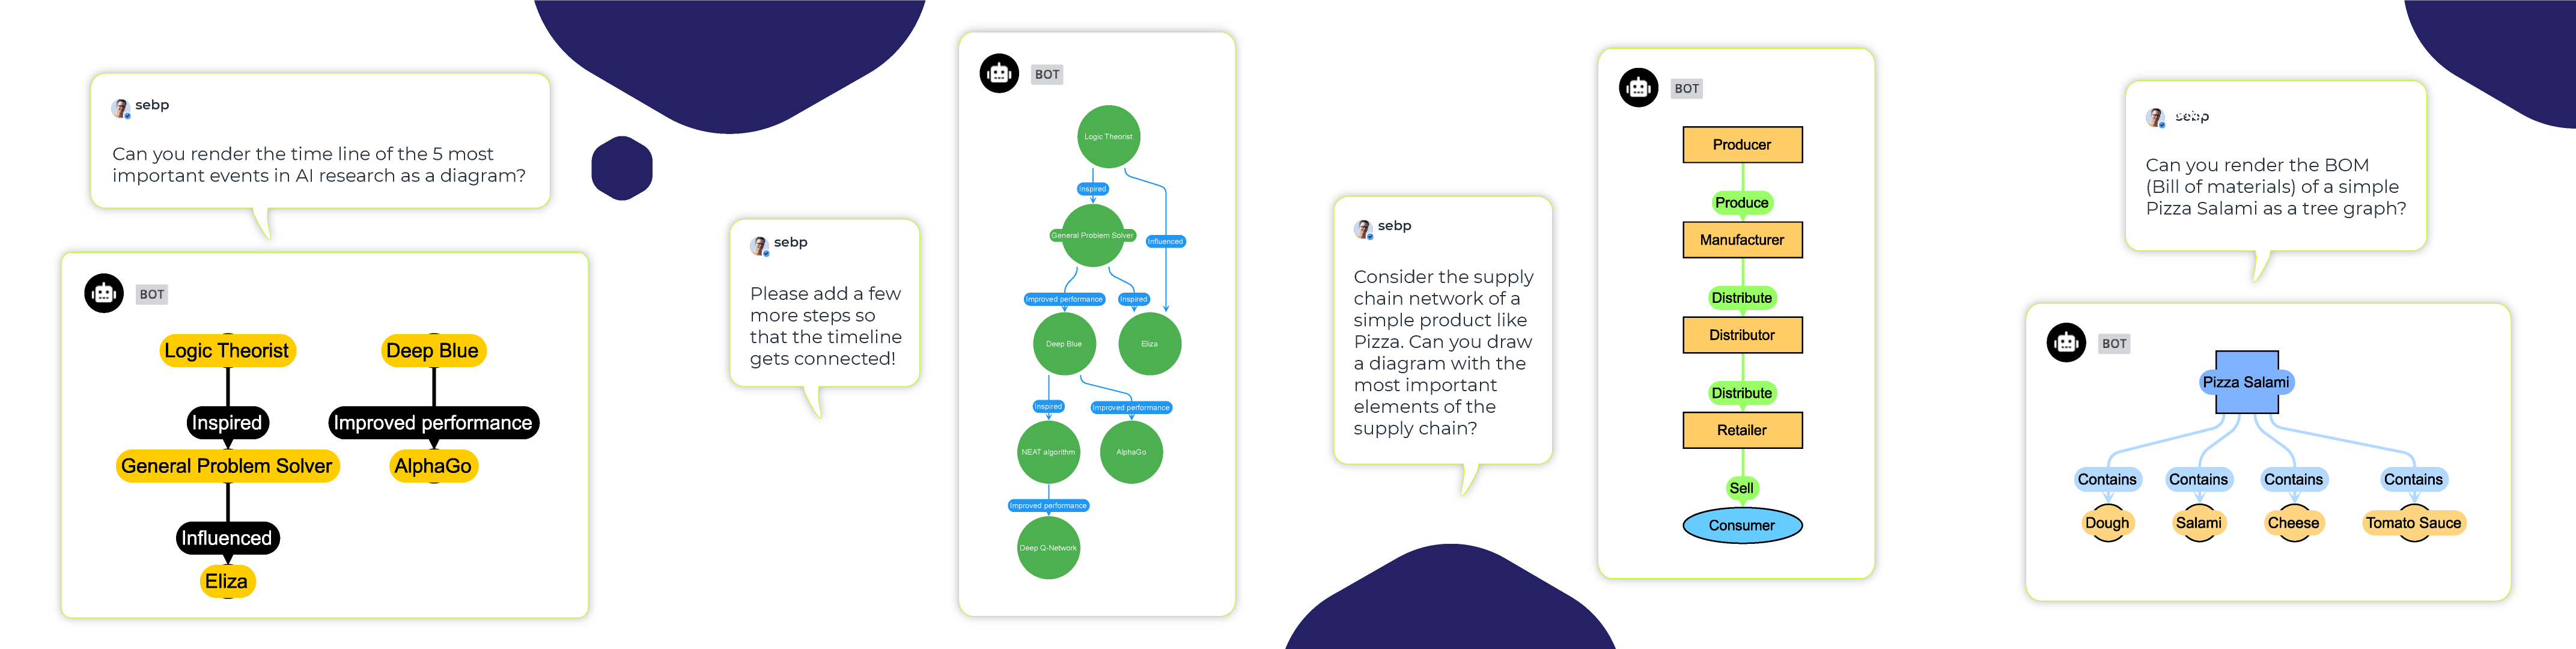 Sample graphs built in yEd Live with the help of yFiles and ChatGPT
Adding the feature to yEd Live
After experiencing the benefits of our ChatGPT integration in Mattermost, we wanted to share this experience with as many of our users as possible. An integration into our diagram editor yEd Live was the obvious choice: No installation or registration needed, it runs directly in the browser, an intuitive application, no prior knowledge needed, and best of all, it's completely free!
AI enhanced diagram creation
In order to make the feature available as quickly as possible, we decided to leave only the initial creation of a diagram to ChatGPT and to forego further exchanges and adjustments to the diagram by the AI. This way, the feature could be seamlessly integrated into the existing user interface. And the advantage of yEd Live is that it is a diagram editor, so any diagram created - as the name suggests - can be easily edited and extended.
 ChatGPT integration in yEd Live
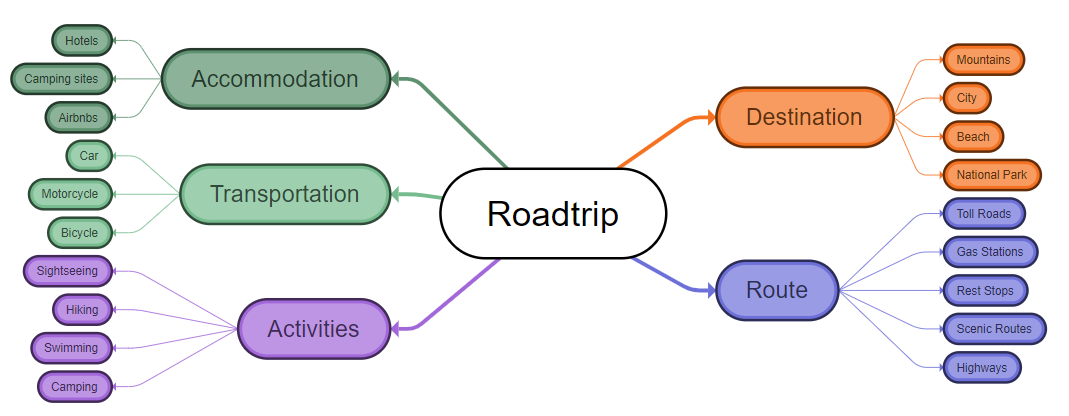 Resulting diagram
AI enhanced diagram editing
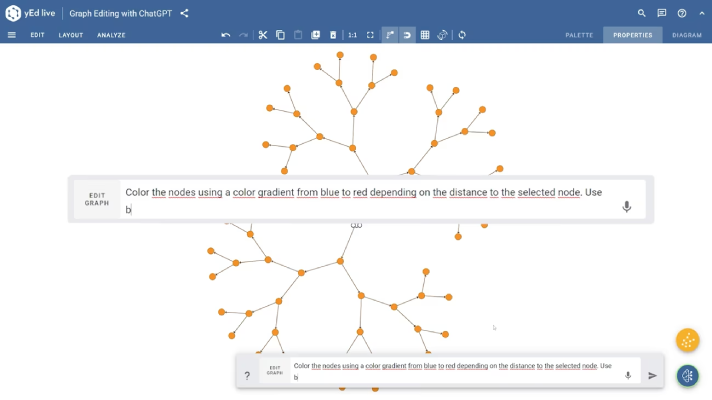
Aside from diagram creation, we also added an AI supported feature that allows to edit the diagram with natural language instructions. Editing the diagram with natural language opens up new possibilities. For example, you can easily adjust all labels at once, apply a color gradient to the graph, or just restructure it based on specific conditions. The following screen cast shows this feature in action.
 The integration of ChatGPT in yEd Live is a game-changer in the world of data visualization.
Generating visualizations from text input has never been easier or more accessible.
This powerful combination allows anyone, regardless of their technical expertise, to communicate complex ideas visually.ChatGPT, openai.com
The integration of ChatGPT in yEd Live is a game-changer in the world of data visualization.
Generating visualizations from text input has never been easier or more accessible.
This powerful combination allows anyone, regardless of their technical expertise, to communicate complex ideas visually.ChatGPT, openai.com
Some Results
Following are some example ChatGPT requests with the graph that resulted from it.
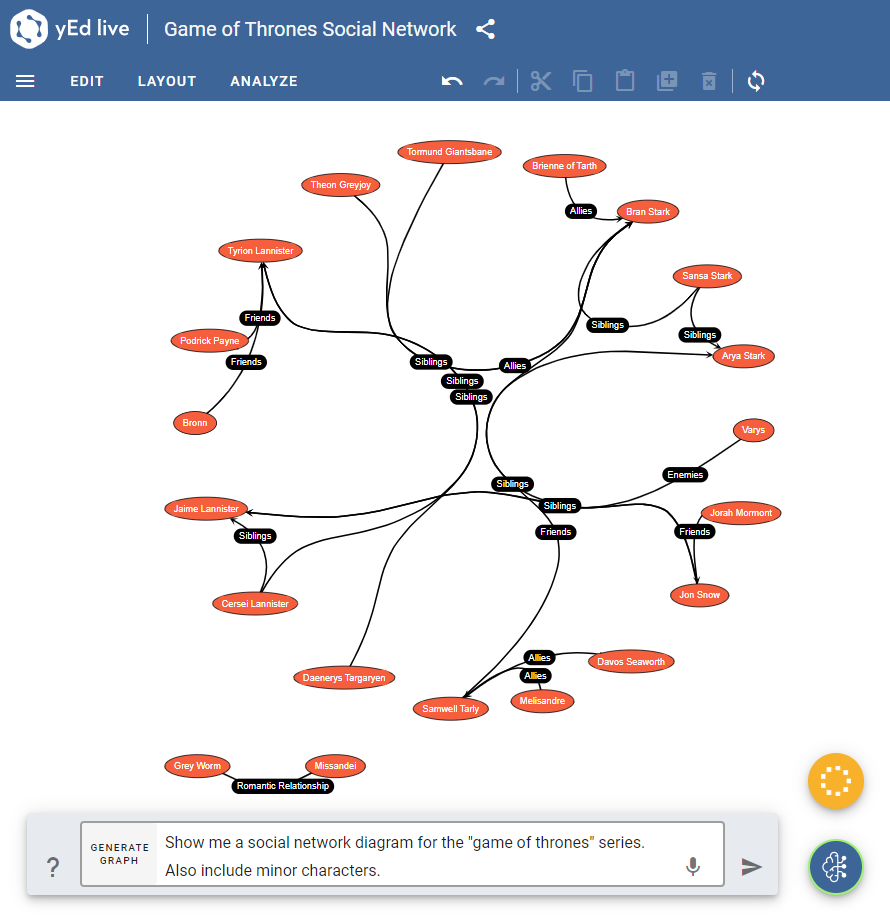 Prompt: "Show me a social network diagram for the "game of thrones" series. Also include minor characters."
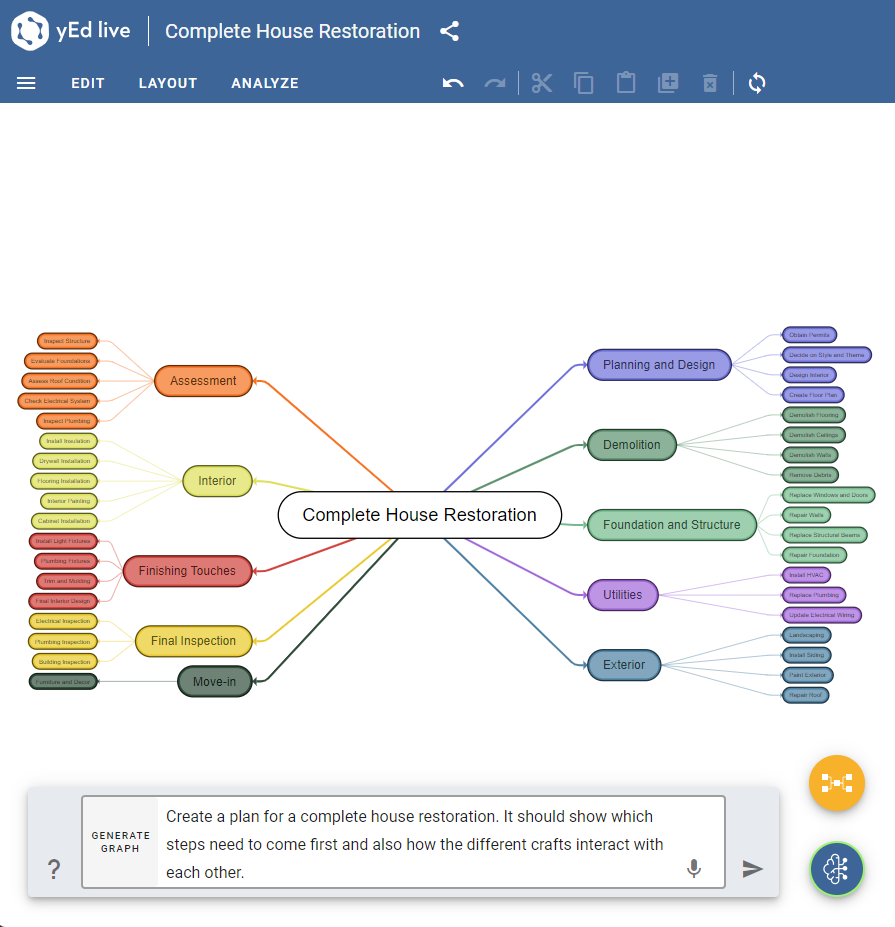 Prompt: "Create a plan for a complete house restoration. It should show which steps need to come first and also how the different crafts interact with each other."
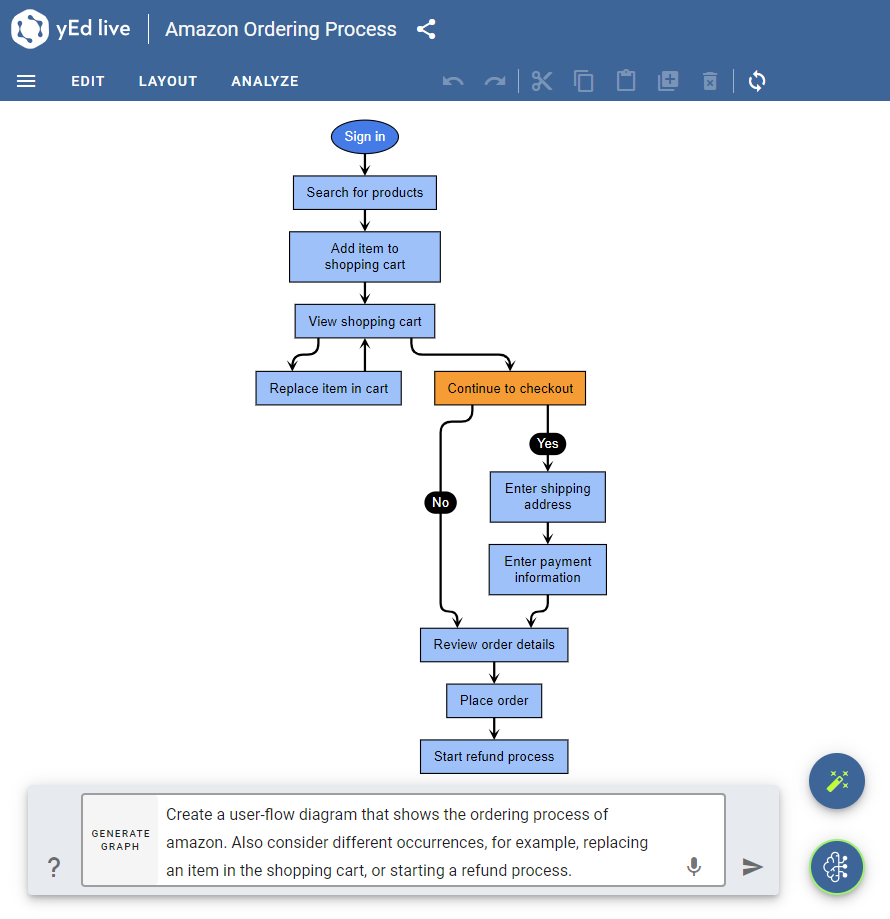 Prompt: "Create a user-flow diagram that shows the ordering process of amazon. Also consider different occurrences, for example, replacing an item in the shopping cart, or starting a refund process."
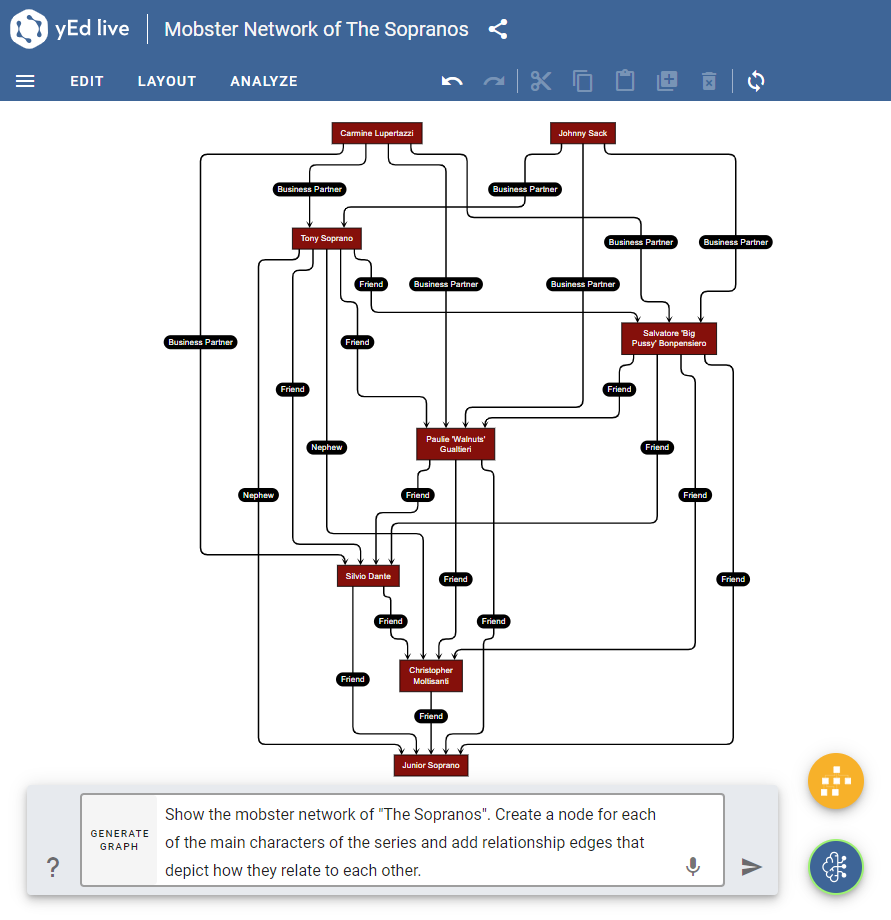 Prompt: "Show the mobster network of "The Sopranos". Create a node for each of the main characters of the series and add relationship edges that depict how they relate to each other."
Implementation
The integration of ChatGPT in yEd Live is similar to the approach of our Mattermost ChatGPT plugin. The user input is enhanced with additional instructions for ChatGPT such that it should create a structured JSON and an appropriate document title as response. The communication between the yWorks backend and OpenAI is handled by the official openai Node.js library. The response is then parsed and visualized as graph with yFiles in yEd Live.
 Technical structure of the ChatGPT integration in yEd Live (Open in yEd Live)
The easiest part of the entire process is actually creating a yFiles graph from the structured data that is provided by ChatGPT. yFiles comes with a powerful GraphBuilder convenience class that can be configured to match almost any structured data and automatically create a graph from it. Also, there is no need for the data to contain any item locations because yFiles' automatic layout algorithms can arrange the graph in a pleasing and easily readable manner. In the case of the ChatGPT integration, we let the AI choose a suitable layout algorithm out of hierarchic, circular, organic, tree and use this information to create a related yFiles layout configuration.
Test and experience yFiles free of charge!

- Free support
- Fully functional
- 100+ source-code examples
We rely on ChatGPT's expertise to decide the color scheme for our diagrams. While it might not always result in the most aesthetically pleasing diagram, the colors are often chosen based on the specific topic or convey a particular meaning.
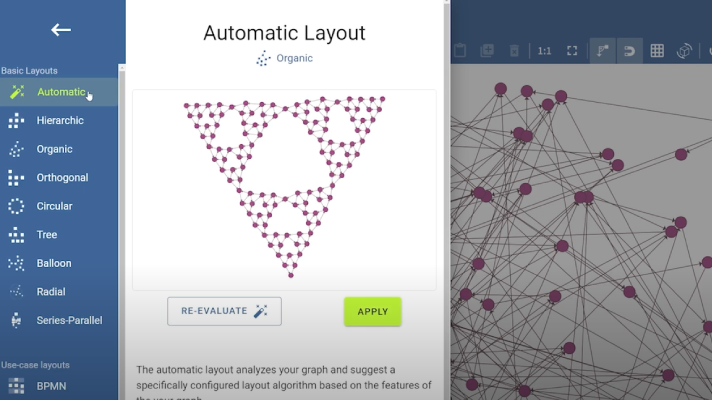
In contrast to the Mattermost plugin, we also use the available features of yEd Live to fine-tune the resulting graph for example by applying automatic node sizing and one of the available automatic layout algorithms in yEd Live.
Creating good user experience
While integrating the feature into the user interface we encountered a UX challenge: The wait times for OpenAI to process the data and return something from which we could create a nice visualization were sometimes excessively long. That is something we cannot change on our end.
A spinning animation indicated the processing stage, but after a certain period, users inevitably wondered whether the process was hanging up. Besides, it's just not fun to wait that long.
But challenges are there to be solved and we got help from ChatGPT again.
We designed a new loading screen that, on the one hand informs that the process may take longer but, more importantly,
shows the individual steps required to complete the diagram. To make this more entertaining, we didn't care about the truth,
but asked ChatGPT to spit out some funny processing steps, for example:
- Mastering the ancient art of pixel-fu
- Channeling Bob Ross for happy little nodes and edges
- Enrolling nodes in group therapy for better connection
- Brewing a fresh pot of creativity
- Bribing the AI with virtual cookies for faster results
- ...
How to use the feature
yEd Live can be launched at yworks.com/yed-live.
Launch yEd LiveMore about yEd Live
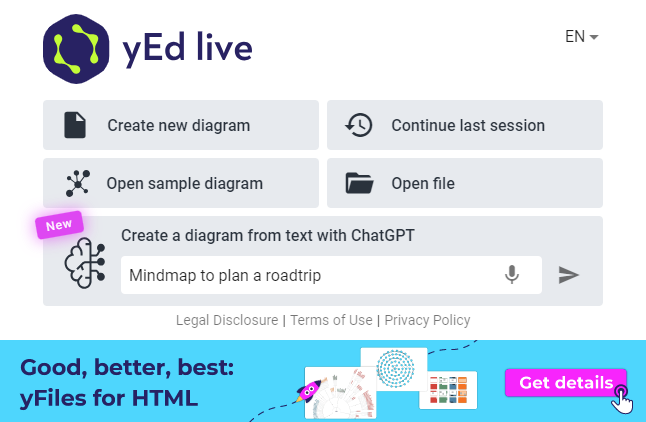
Upon accessing the welcome screen, users can utilize the new feature by typing in a description of the diagram they wish to create.
That's all it takes to explore a diagram on the desired topic.
What an efficient way to create visualizations!
Example Prompts
We asked ChatGPT to provide us with some sample input for you to try.
- Connectivity of ecosystem impacted by wildfires and the remediation efforts undertaken after the incidents
- Generate a diagram depicting the connectivity and communication network in a connected car system.
- Create a diagram that depicts the relationships between various software components in a system architecture model
- Generate a diagram titled 'The Path to Social Media Fame' and humorously visualize stages like 'the selfie overkill' or 'the viral cat parody
- A visualization of product purchases at a retail chain
- Showcase the components and connections in a hybrid electric vehicle's powertrain system
- Create a network diagram depicting the relationships between different social media platforms, their user bases, and popular content to showcase the digital influence in today's society
- Generate a diagram depicting the 'Epic Battle of Breakfast Foods,' including a humorous visualization of the strategic strengths of pancakes, waffles, and French toast
Impressive but not perfect
As impressive as ChatGPT and its integration into yEd Live may be, it is not perfect yet. Sometimes ChatGPT fails to provide meaningful results despite having sufficient input information which results in an error. Resending the same input sometimes delivers results after all.
Additionally, It should be noted that ChatGPT has its strengths in creativity rather than truthfulness.
This means incorrect information creeps in occasionally, such as when Arnold Schwarzenegger is suddenly married to Patrick Kennedy.
However, they are not always that obvious, therefore it is important to think carefully about what the diagrams are used for.
The feature is particularly useful for creating sample diagrams that look meaningful at first glance, but where the exact content is not important.
But ChatGPT is just the beginning, AI will certainly remain a big topic in the coming years.
Conclusion
The integration of AI in an application like yEd Live marks an exciting step forward in the field of data visualization. It offers users the ability to generate diagrams from text descriptions, opening up new possibilities for communication and exploration. While the integration is not without its limitations, such as occasional errors or inaccurate information, it provides a valuable tool for quickly creating diagrams. As we continue to refine and improve the integration, user feedback will play a crucial role in shaping its future development. This initial integration serves as a promising starting point, and further experimentation and exploration will undoubtedly uncover even more potential in the intersection of AI and diagramming.
Discover the power of yFiles
Transform complex data into beautiful, interactive graphs and visualize it like never before with yFiles, the diagramming SDK. Its comprehensive set of layouts and features provides endless possibilities for creating powerful graph drawings and interactive applications on any platform.