


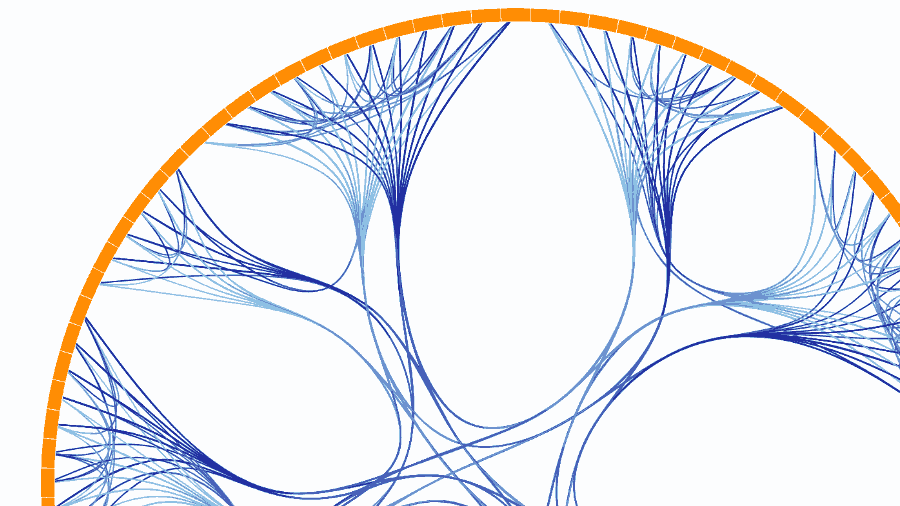
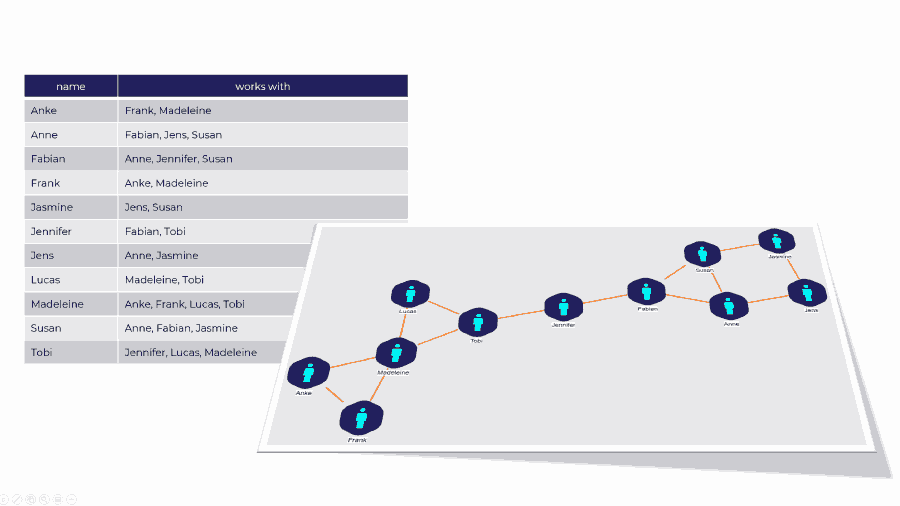
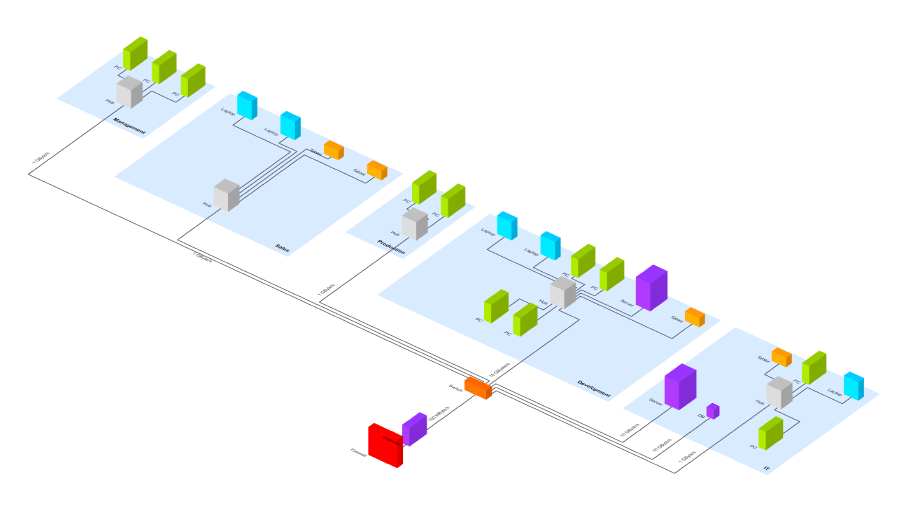
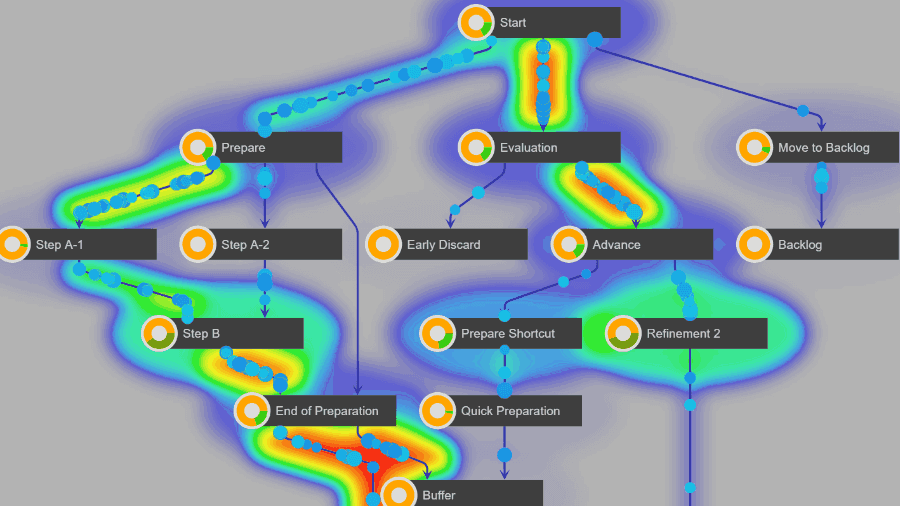
Why visualize connected data?
click me
click me
What sets yWorks apart?


Experience
yWorks has been providing graph visualization solutions for over 20 years. Building on our university background, we combine the latest scientific findings, current technological standards, and profound software development expertise – to bring the future of graph visualization to life. We aim to deliver optimum advice and support for every use case you can think of.
Confidence
With more than 1 million users and customers in over 60 countries, yWorks is trusted by many different types of companies around the world. Our customers value our experience and appreciate our enthusiasm. Plus our graph drawing algorithms are second to none.
Excellence
We offer solutions for almost every technology and platform. Each customer benefits from direct support provided by our core developers and graph visualization specialists. We are proud to offer the industry-leading software library for visualizing, editing, and analyzing graphs.
Make the most of your connected data!

Add value to your data by visualizing it – the results will look amazing!
Numerous world-renowned companies, research institutes, and universities rely on the expertise of yWorks.
yWorks products
yFiles - the diagramming SDK

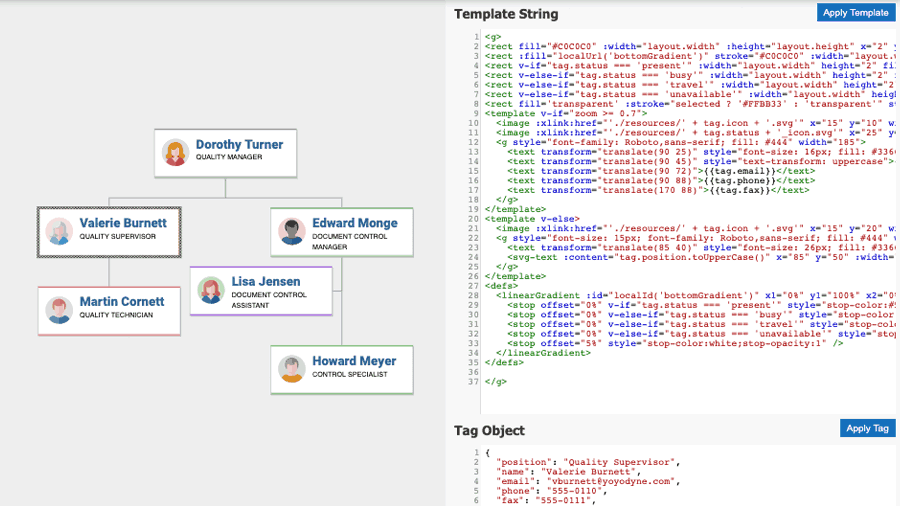
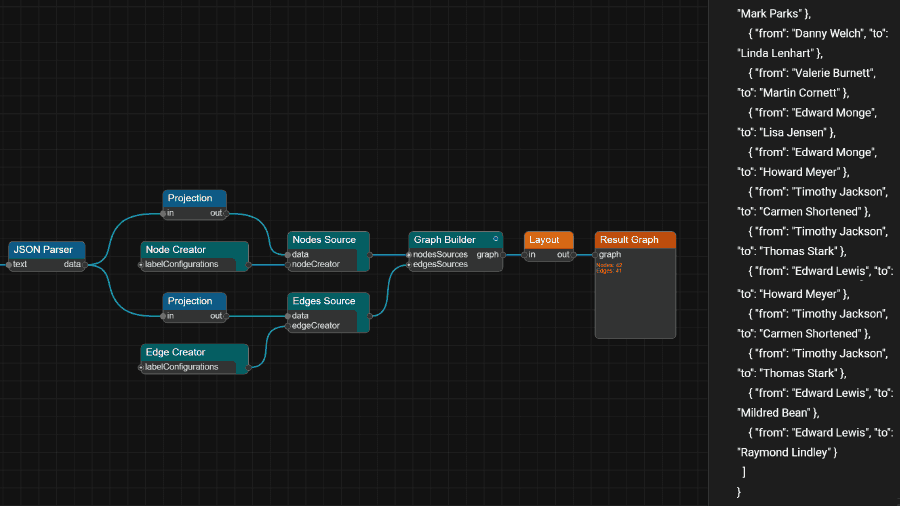
yFiles ‑ the diagramming SDK
yFiles is the industry-leading software library for graph and network visualization, editing, and analysis.
The well-documented software development toolkit offers you every conceivable possibility to create custom graph software, interact with your data, and gain deeper insights. If there is a solution, you can find it with yFiles!
Discover more
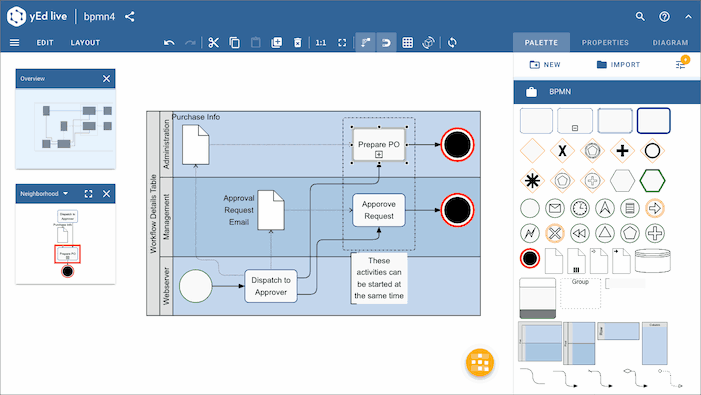
The diagram editor family
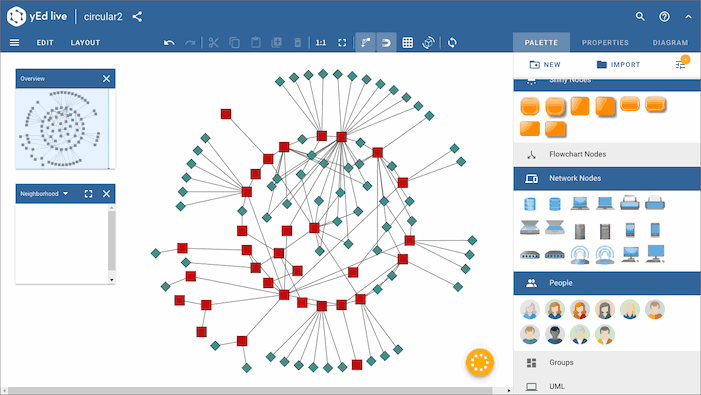
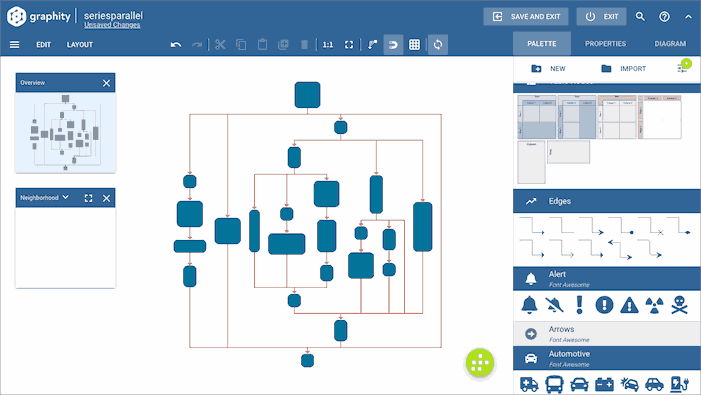
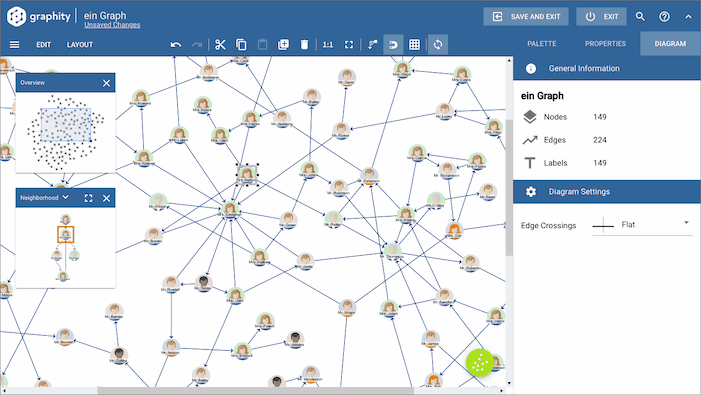
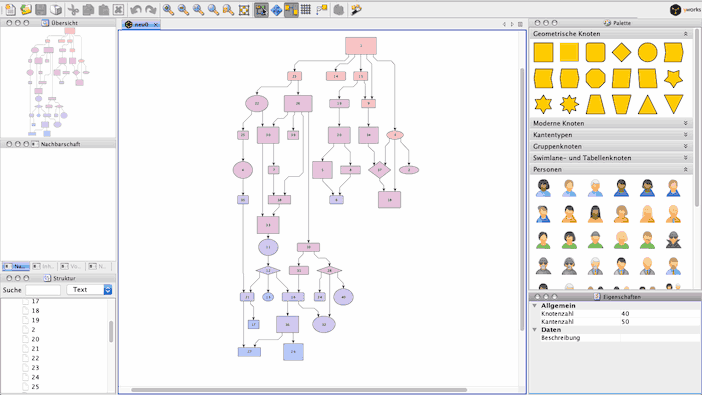
Whether you are a software developer or not, creating diagrams with our intuitive family of diagram editors will make you happy!
Choose between the free and powerful desktop application yEd, its lightweight, modern online version yEd Live – also free of charge – and the specially adapted version Graphity for Confluence. Graphity offers enterprise features for teams like collaborative working and user rights management.
Our graph editors can be used to quickly generate high-quality network drawings. They let you do it all: from creating diagrams manually to importing your data for analysis. The automatic layout algorithms arrange even large data sets at the press of a button.
Discover more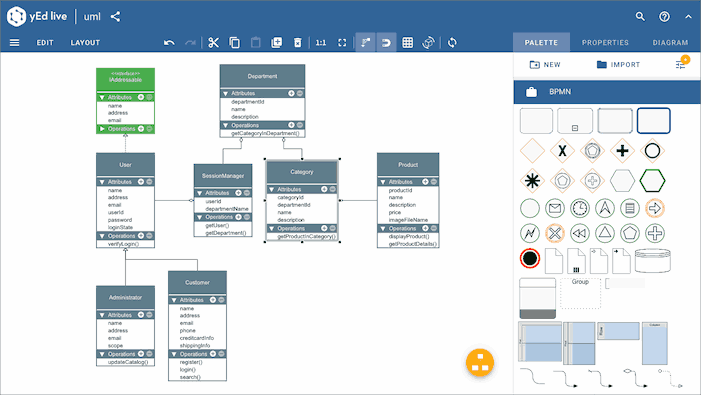
The diagram editor family

Tools
As a provider of holistic solutions, we offer a selection of tools to support graph drawing and software development.
For graph drawing
Use a selection of yFiles features with third-party software like Jupyter, Neo4J, or Cytoscape.
For software development
Ensure secure code, provide good documentation, and enjoy high quality PDF graphics.
yWorks services
As the diagramming experts, we offer a comprehensive range of services.
From software support to training courses – everything you need to work successfully with data structures, complex algorithms, and advanced graph and diagram visualization.
Learn from yWorks: We invite you to participate in our free webinars, customized online seminars, and coaching sessions.
Get support from yWorks: We offer rapid support during your project, as well as professional workshops and in-depth consulting services.
Delegate tasks to yWorks: Let us take care of project reviews, code reviews, coding, and more.

Stories & news
You can count on yWorks to share lots of information and exciting news items about graph visualization and our products. Find the latest case studies, use cases, blog articles, and more.


Start your journey here– with the diagramming experts

Our team is happy to advise you – no strings attached. Let's talk about your project and find the perfect solution for your needs!
E-mail: hello@yworks.com
Your message has been sent.
Your request could not be sent. Please reload the page and try again.
If the problem persists, please report the error to webmaster@yworks.com.
Learn more in our privacy policy.