
Outdated technologies
Every end is a new beginning
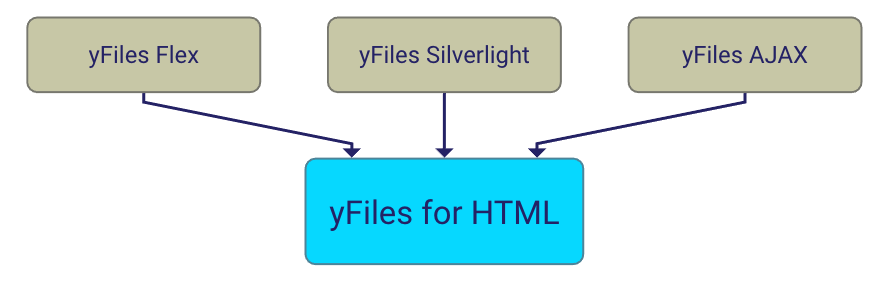
Software changes over time, and so does yFiles. We develop our diagramming SDK for new technologies as these become established. And although we support outdated yFiles versions for a very long time, we have to say goodbye at some point.
Easy migration
Thanks to similar APIs across the different technologies, it’s easy to migrate between yFiles products to cover new platforms. So there’s no need to start from scratch! If you want to use another yFiles variant, talk to our team and we will assist you with the migration!
Now that you’re here,
you might want to explore
you might want to explore


Why, how, what? —Just ask the diagramming experts!

Our team is happy to advise you – no strings attached. Let's talk about your project and find the perfect solution for your needs!
E-mail: hello@yworks.com
Thank you!
Your message has been sent.
Your message has been sent.
We are sorry,
Your request could not be sent. Please reload the page and try again.
If the problem persists, please report the error to webmaster@yworks.com.
Your request could not be sent. Please reload the page and try again.
If the problem persists, please report the error to webmaster@yworks.com.
The data you enter will only be used to contact you regarding your request.
Learn more in our privacy policy.
Learn more in our privacy policy.