
yFiles
product details

yFiles
yFiles is the industry-leading software library for visualizing, editing and analyzing graphs.
The Graph Visualization SDK is available for 5 major platforms and technologies:
HTML, JavaFX, Java (Swing), WinForms, and WPF.
This release features a modernized API, powerful new capabilities, and major improvements to streamline development and enhance graph visualization. Get early access to explore what's new and see how it can enrich your projects.
You have been forwarded from a yFiles for HTML link. If you are interested in specific technical details about this yFiles variant, click here!
Explore the yFiles product page
Features
Graphing that fits your needs
yFiles is the most advanced and complete graphing tool on the market. Our powerful and flexible API offers a wide array of functions - right out of the box. Just select the options that best suit your requirements.

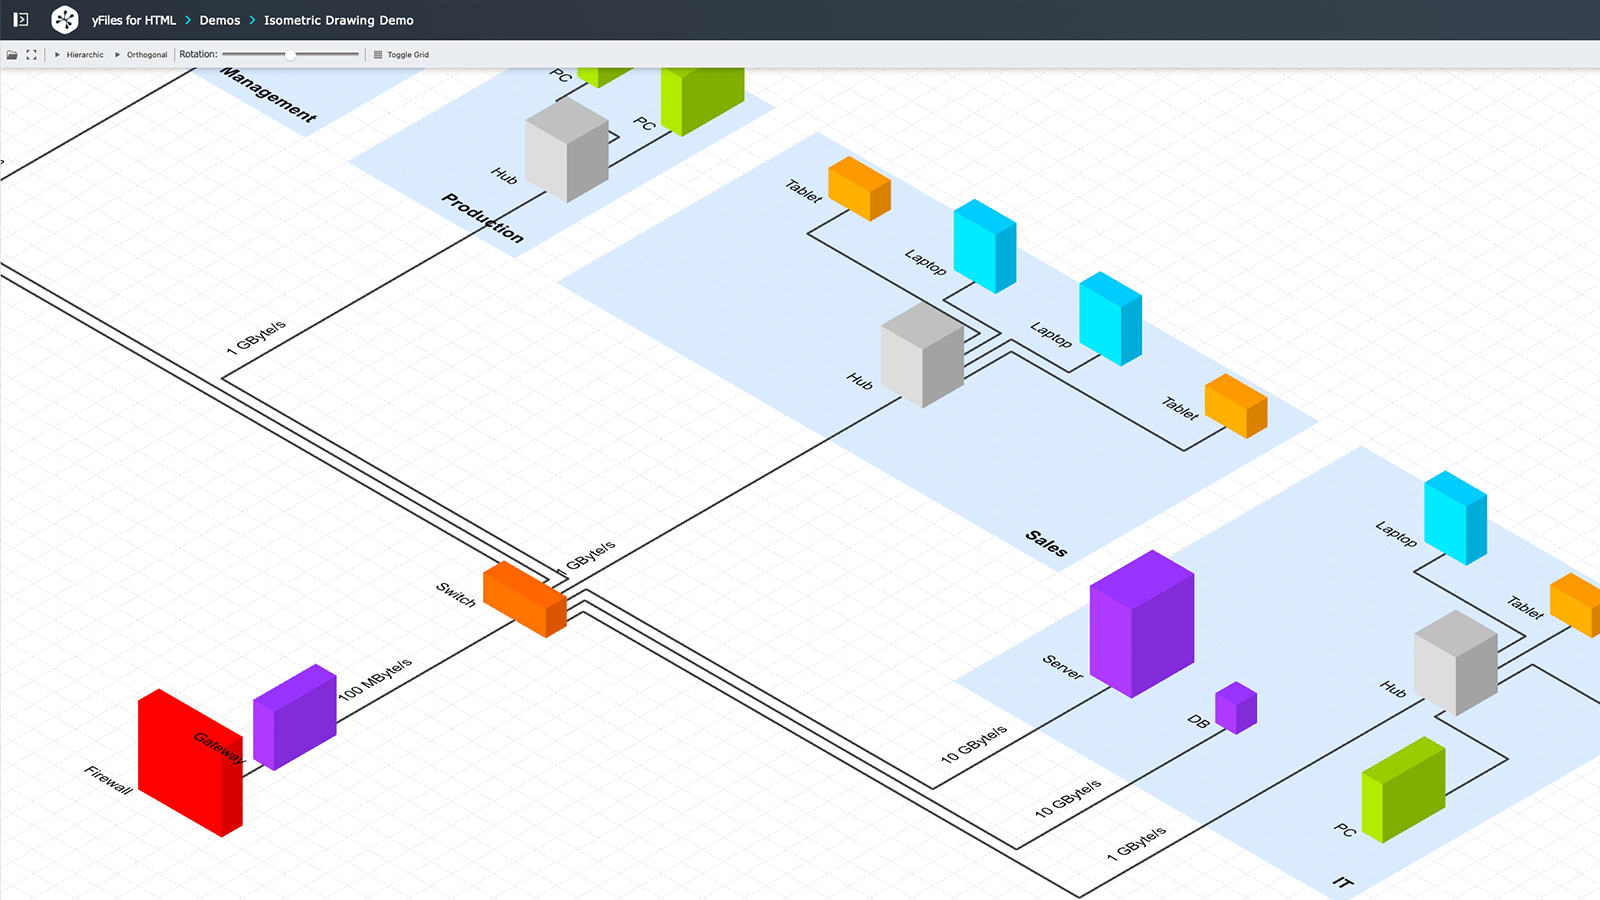
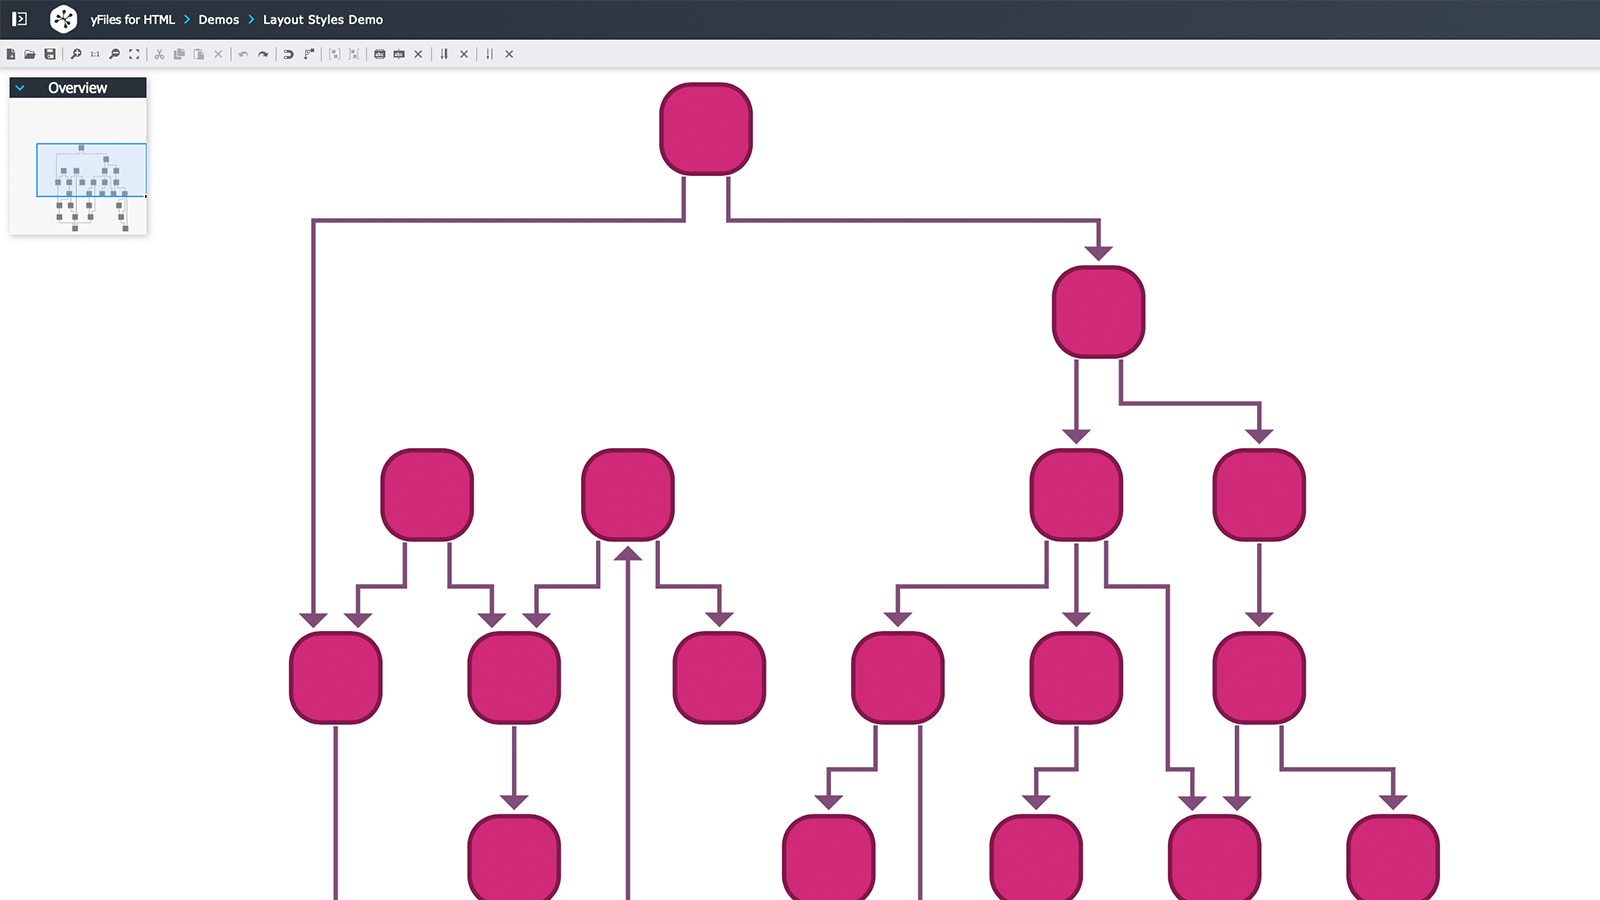
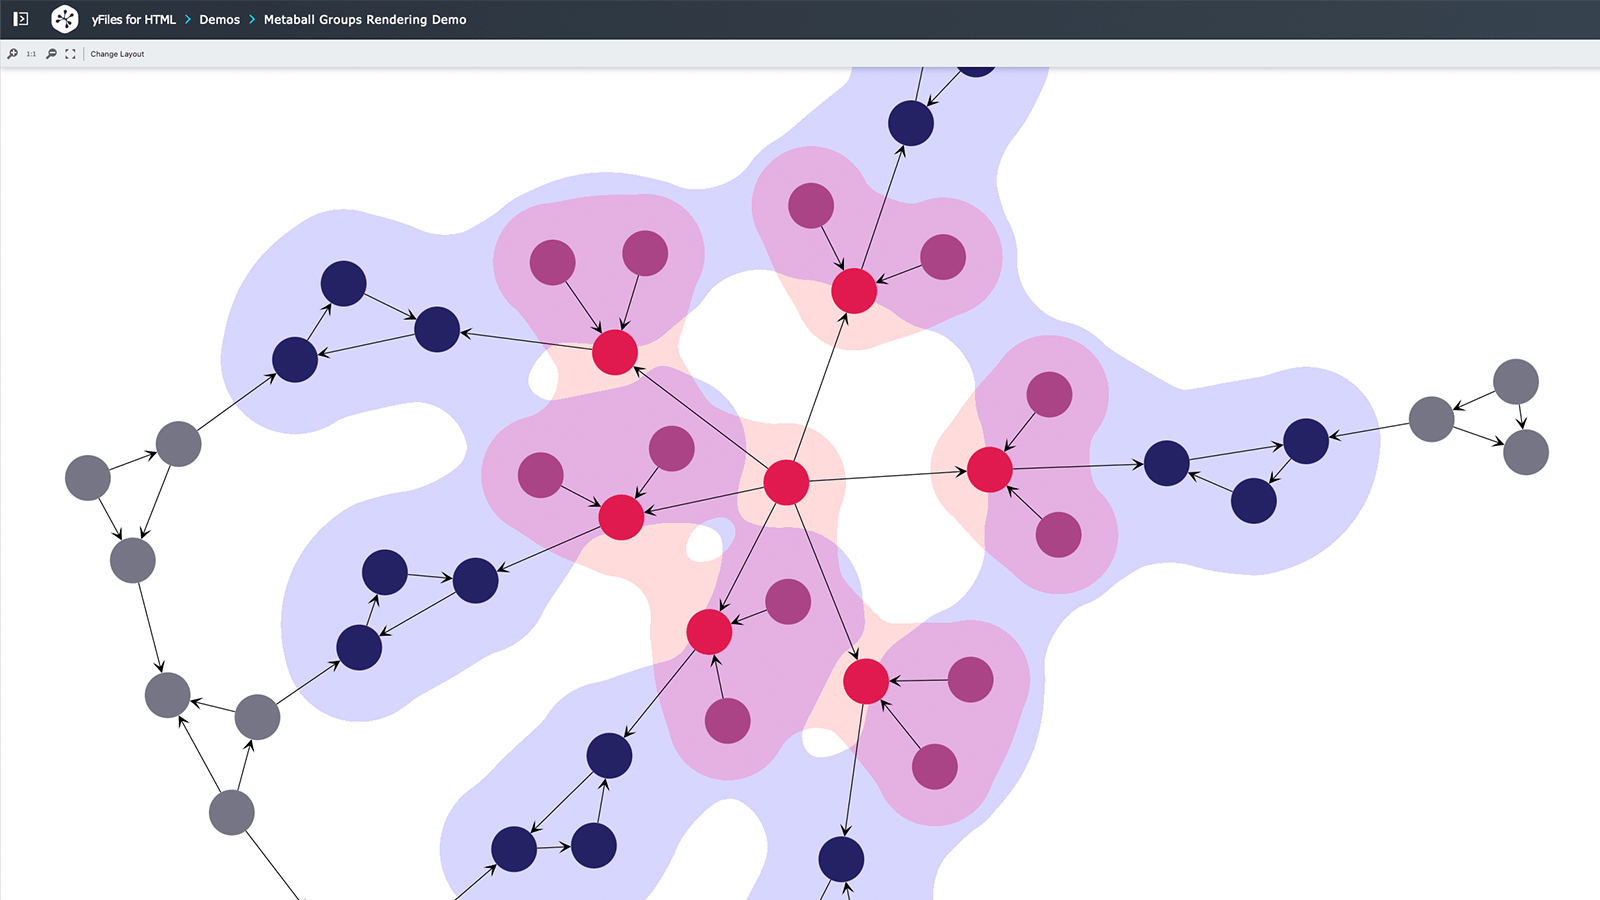
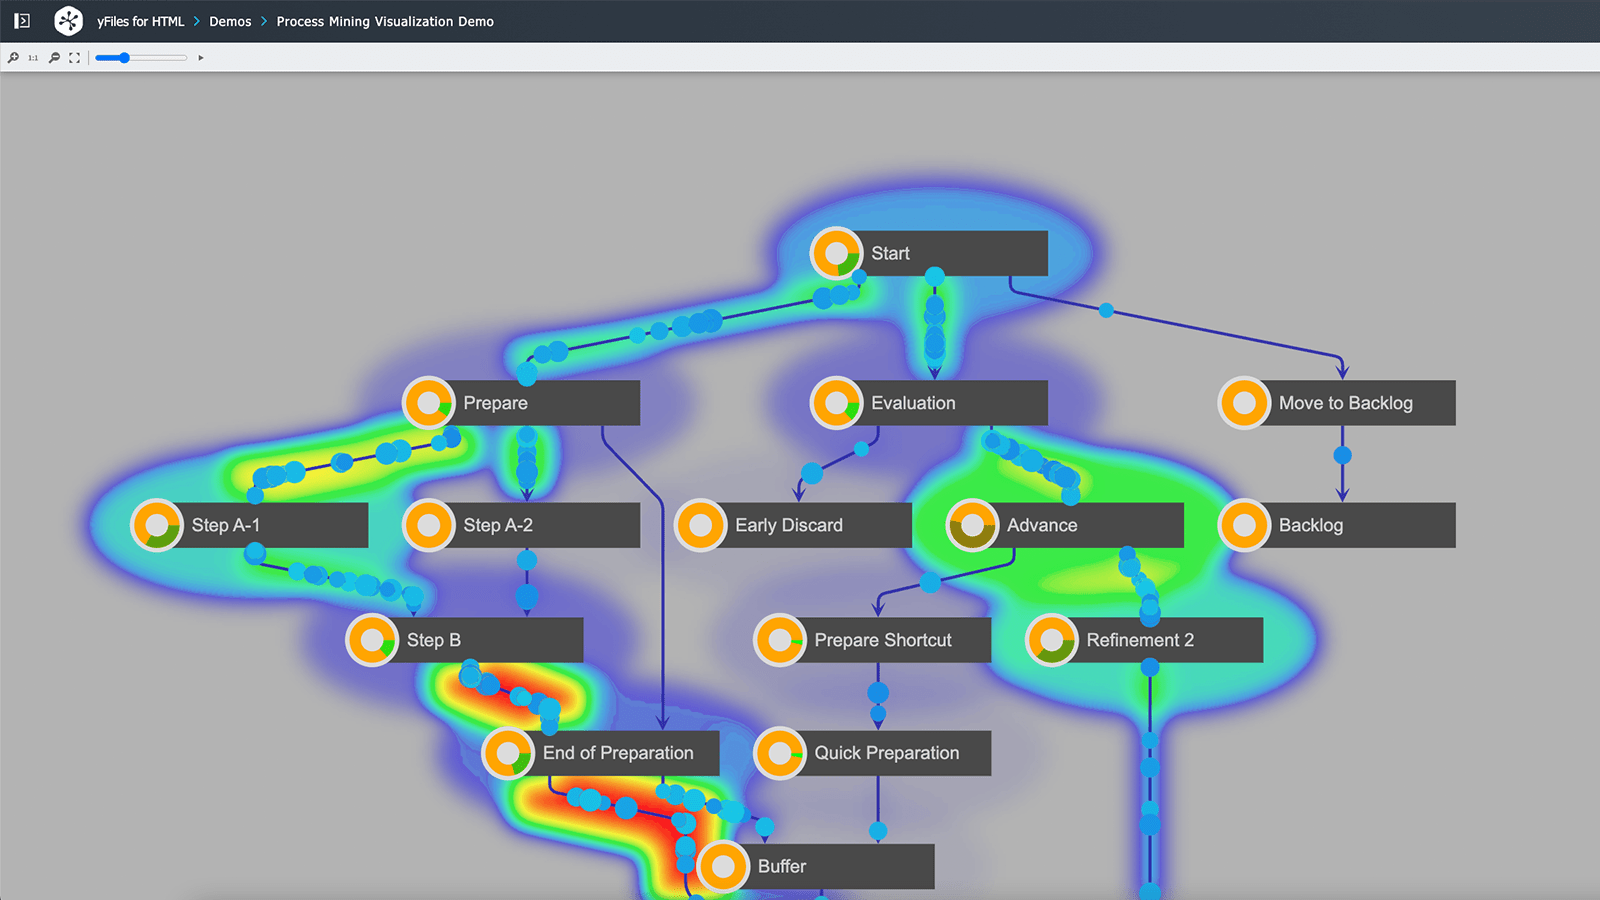
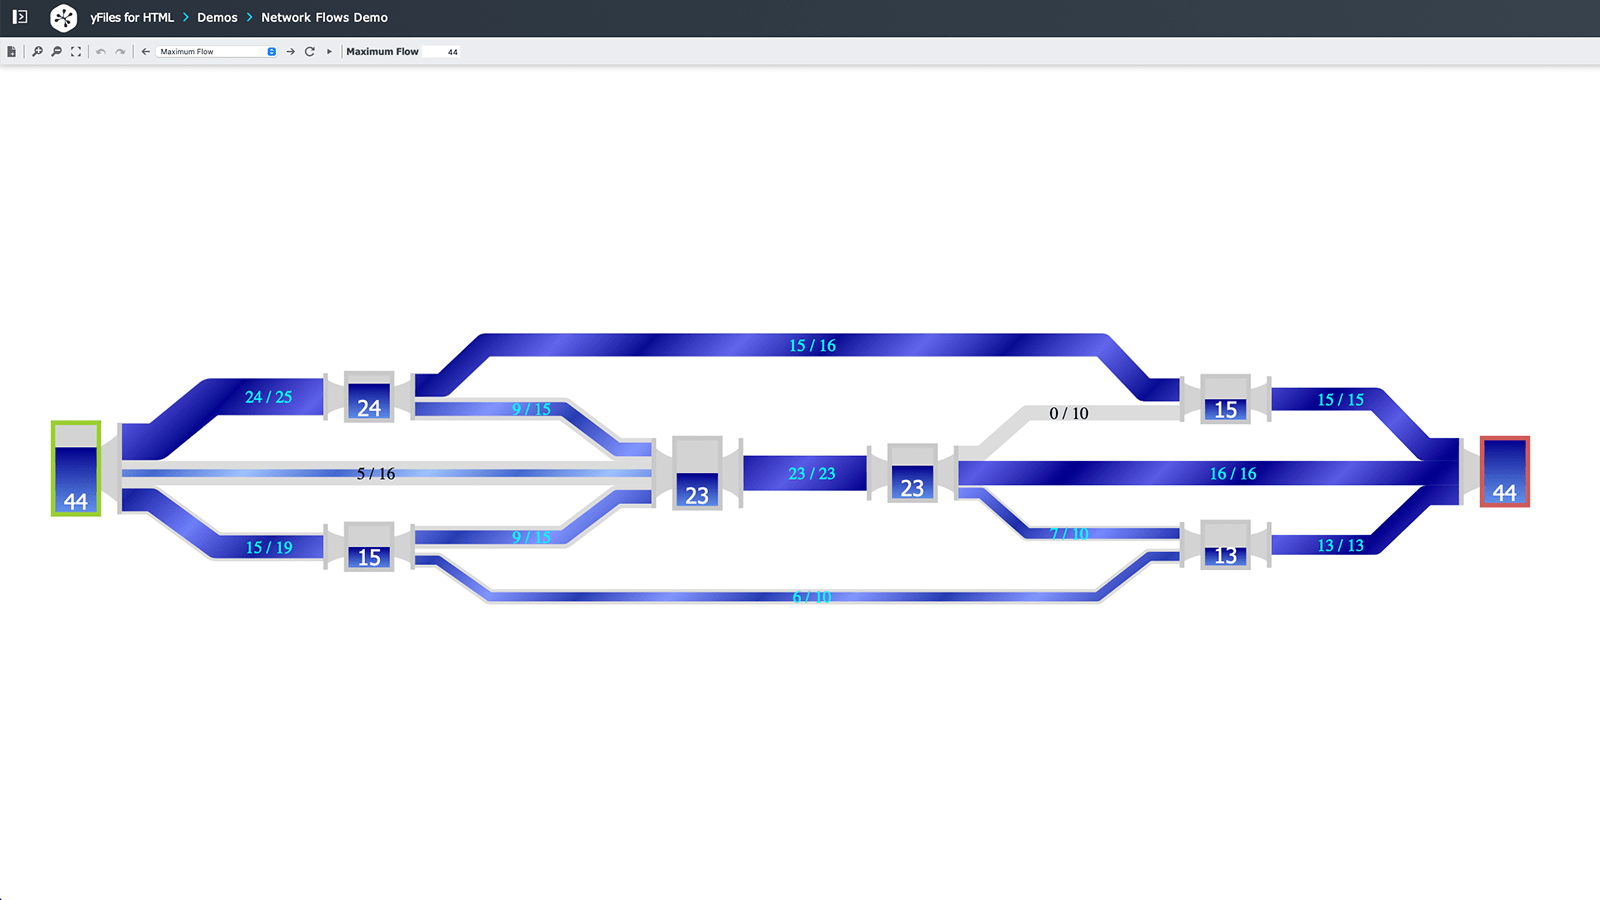
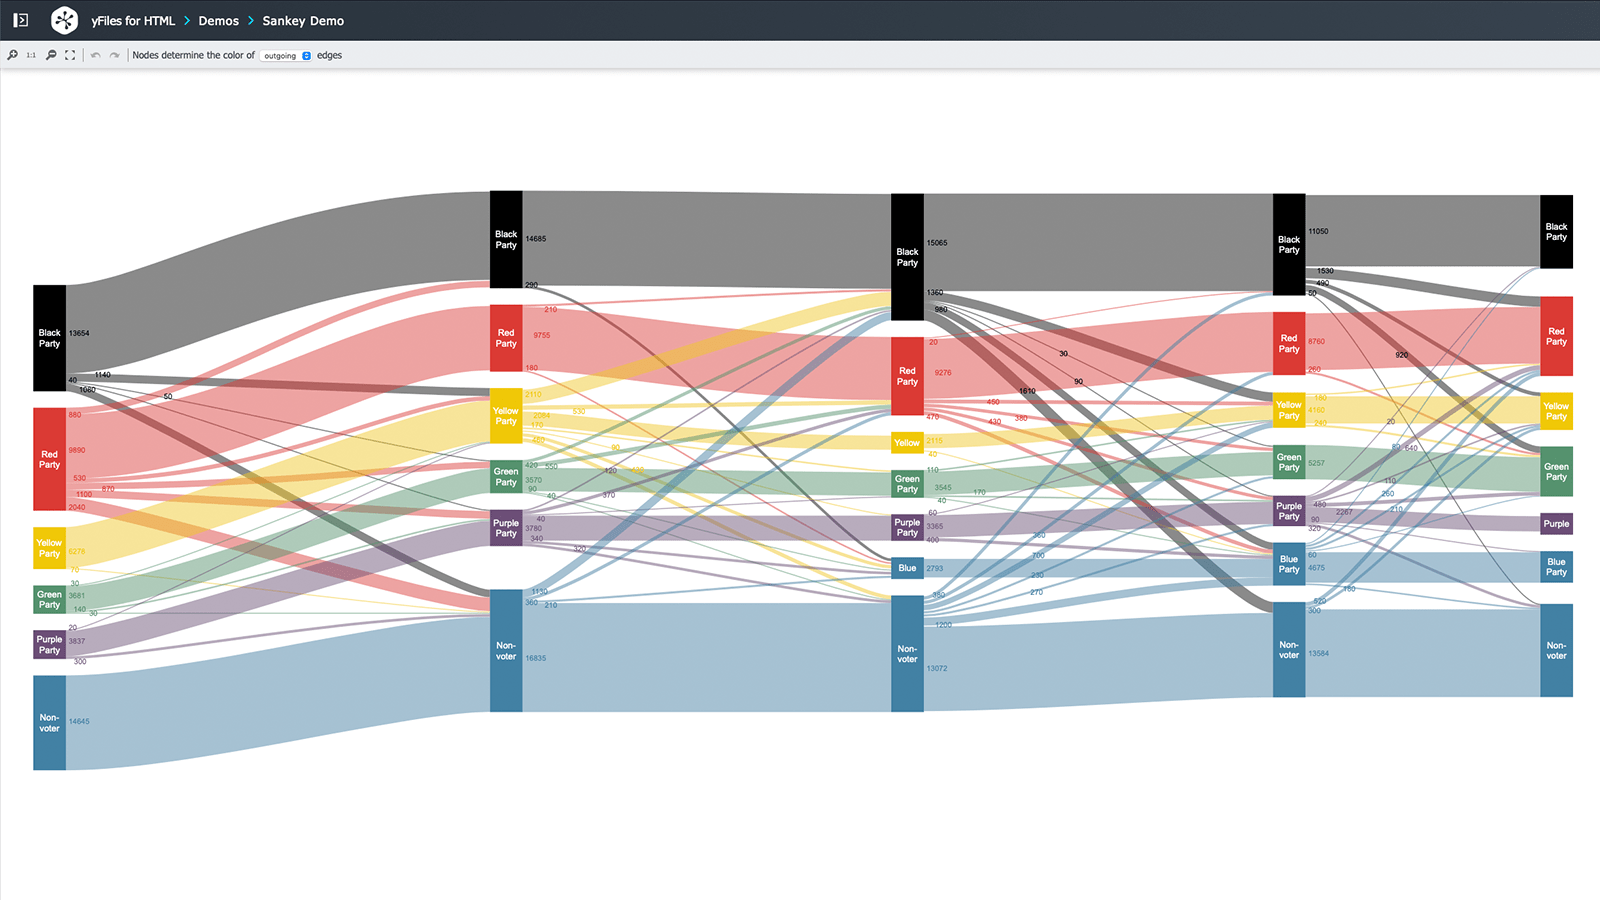
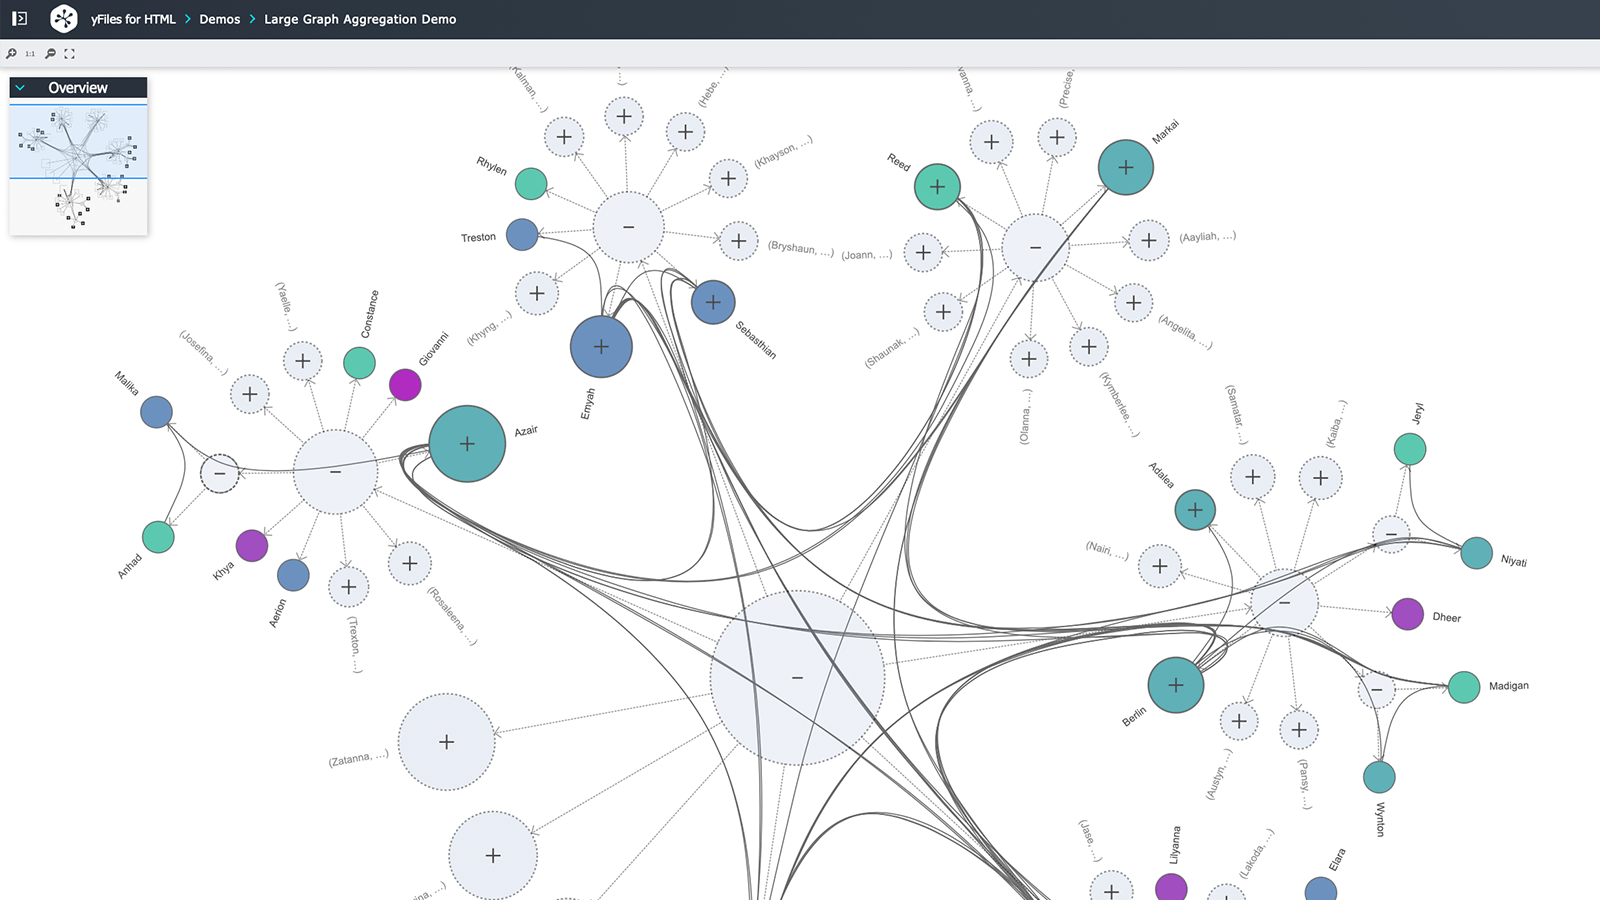
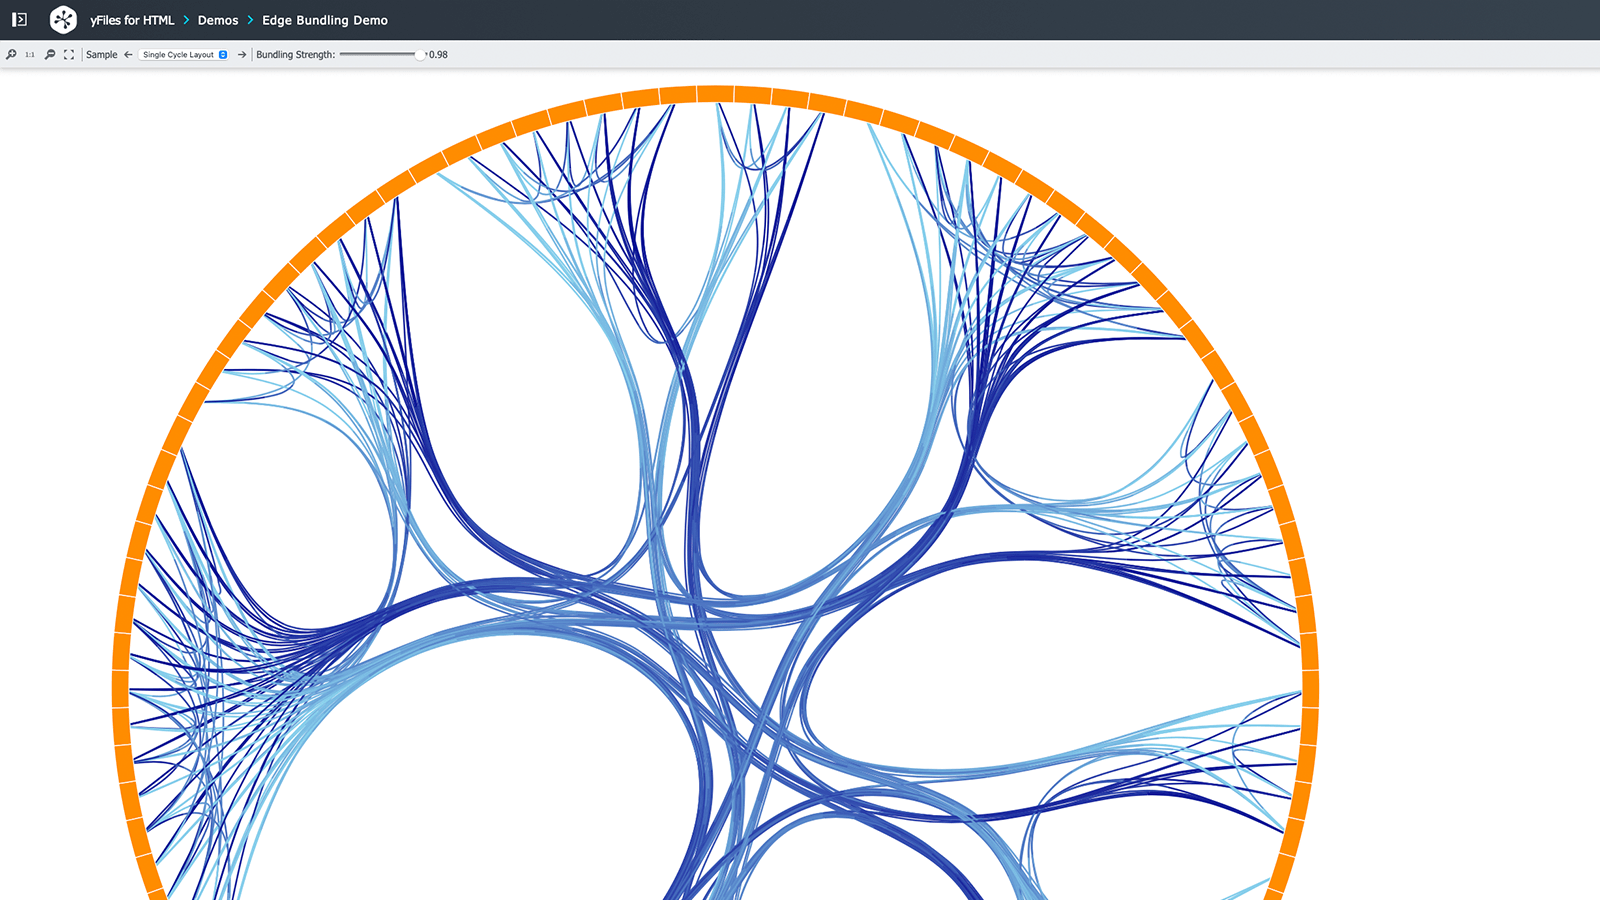
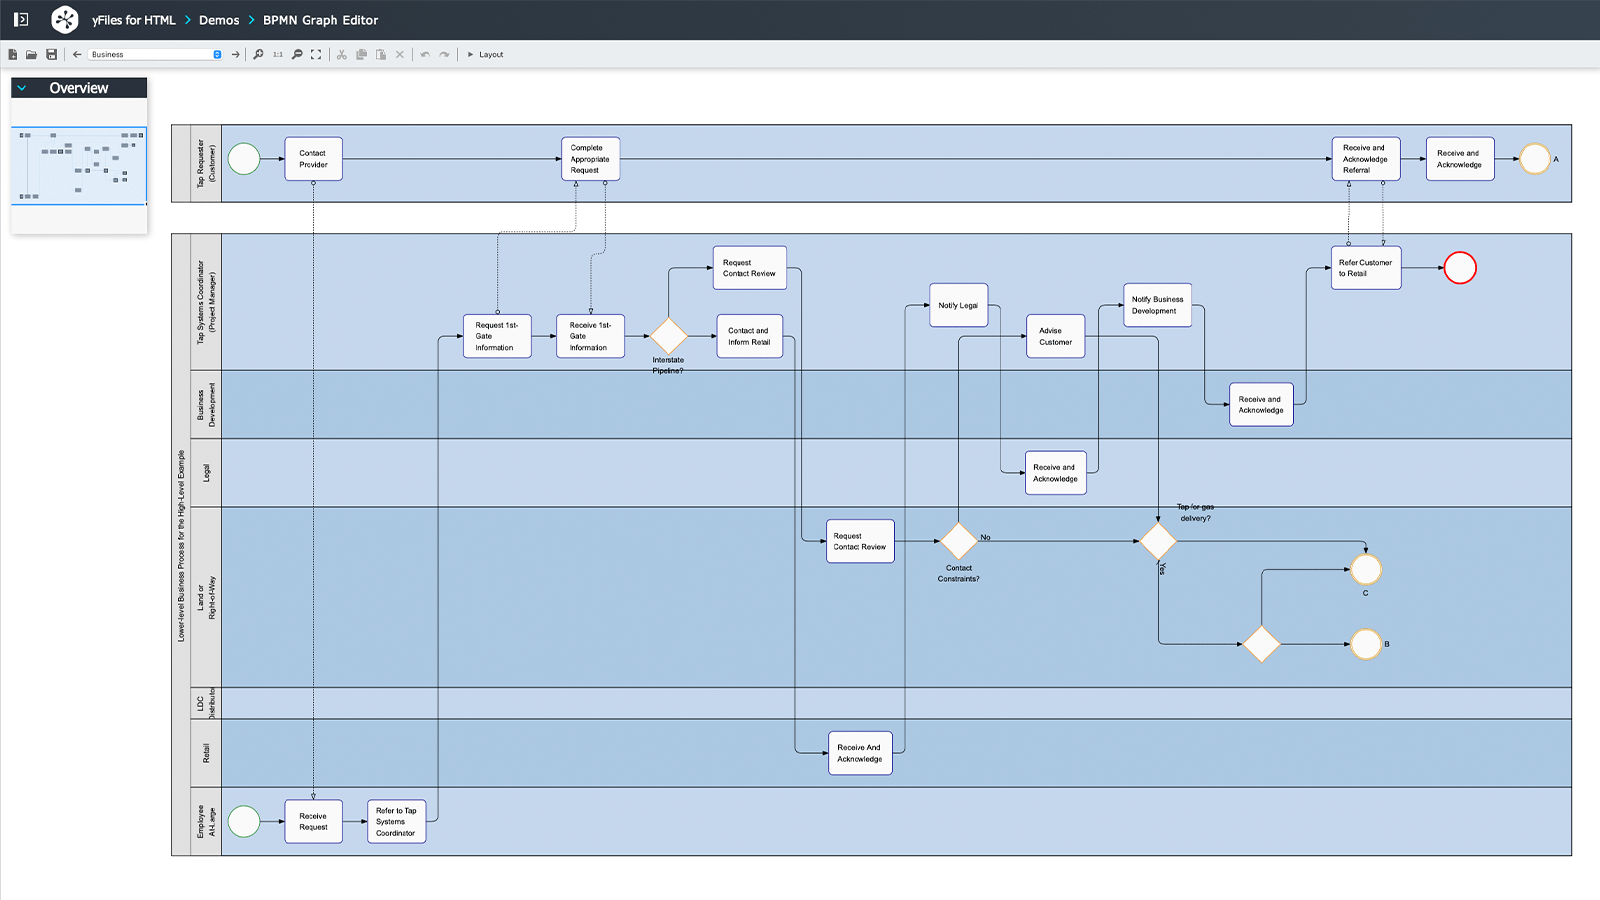
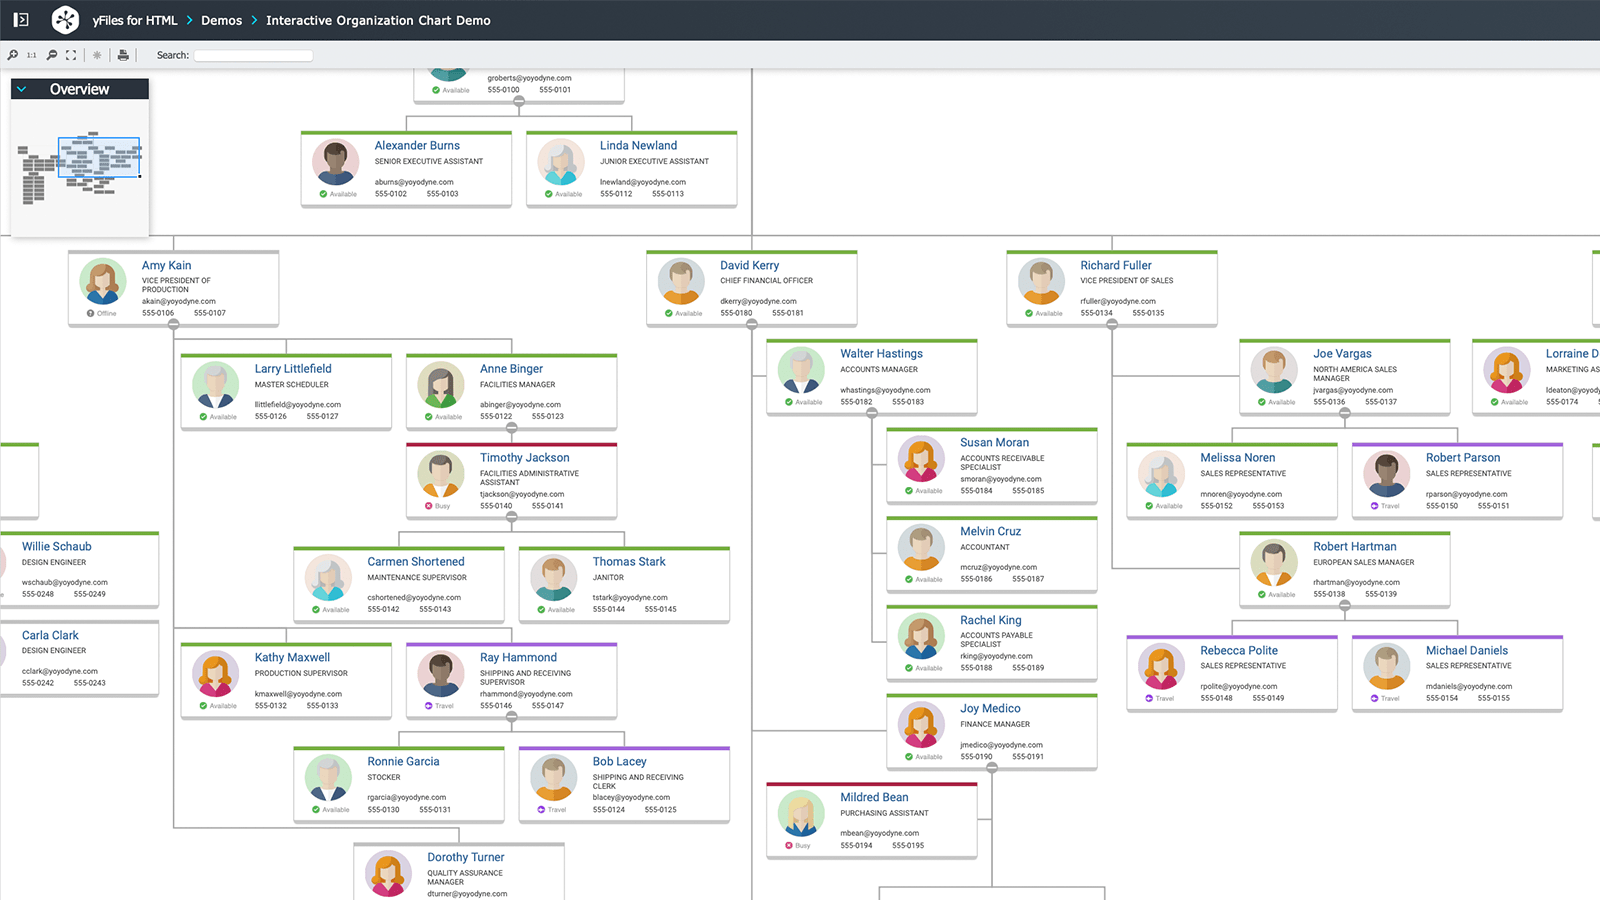
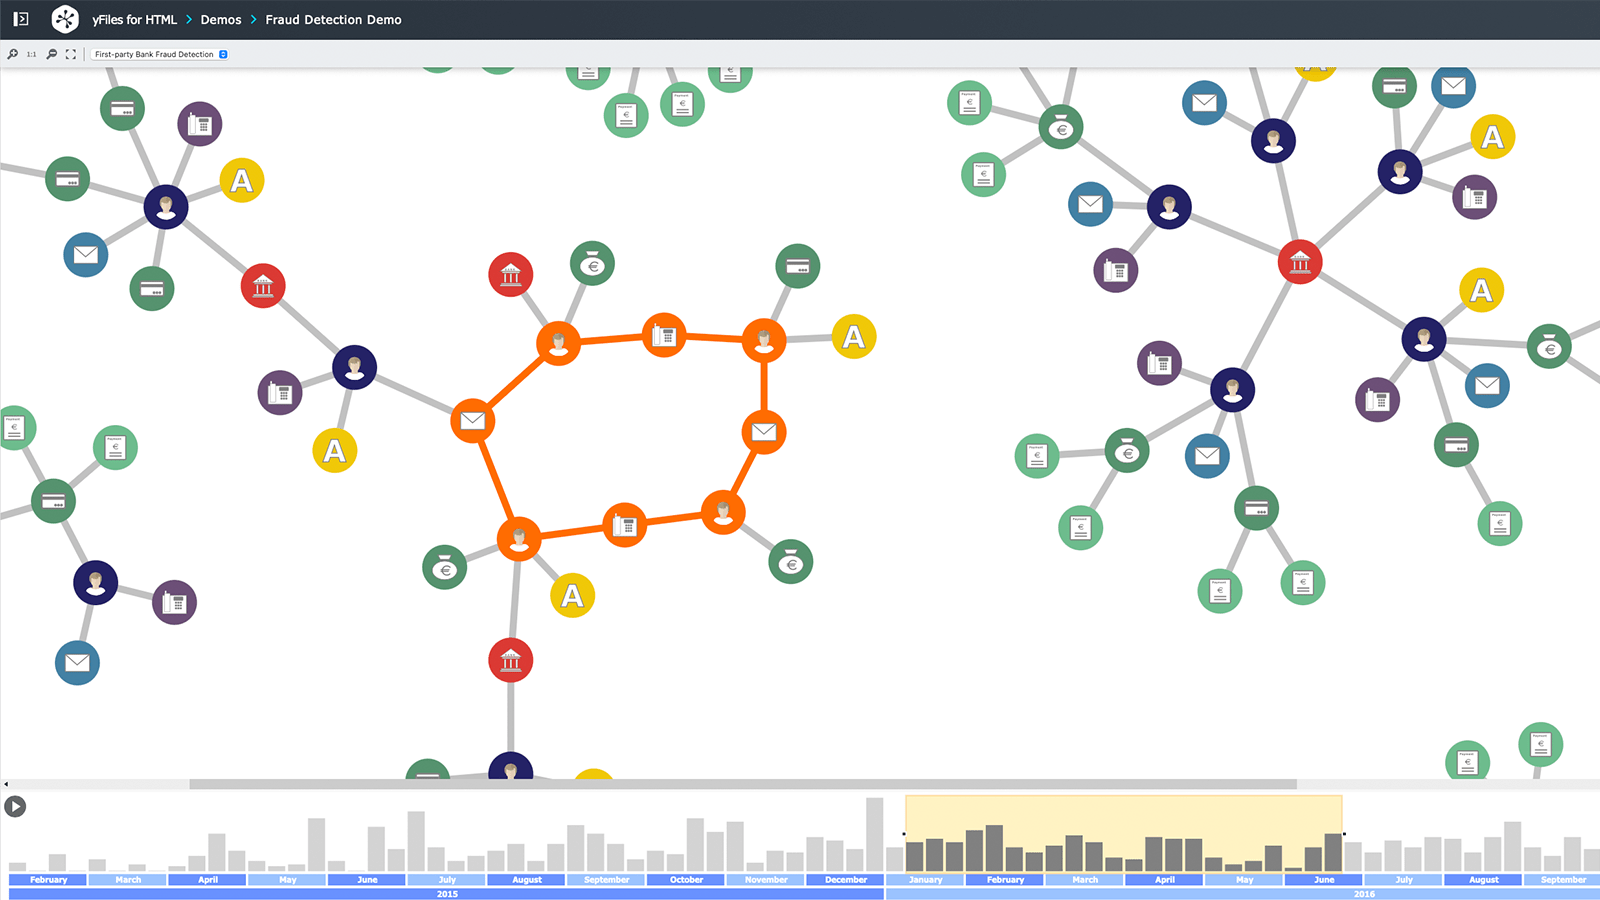
yFiles provides the widest range of high-quality automatic layout arrangements in the industry. Over a dozen different applications with several hundred different settings let you fine-tune the output. With the right algorithm and configuration, you can add relevant information to your visualization, helping users find answers to their questions, simply by looking at the diagram.
Incorporate business data, graph analysis results, and user input to drive the configuration and highlight key aspects. Use animation to blend between different layouts and help users keep their mental map with smooth incremental changes.
Use keyboard, mouse, touch, and pen input to interact with the diagrams and data. Provide dynamic help, visual feedback, and a customized UI to provide the best possible user experience.
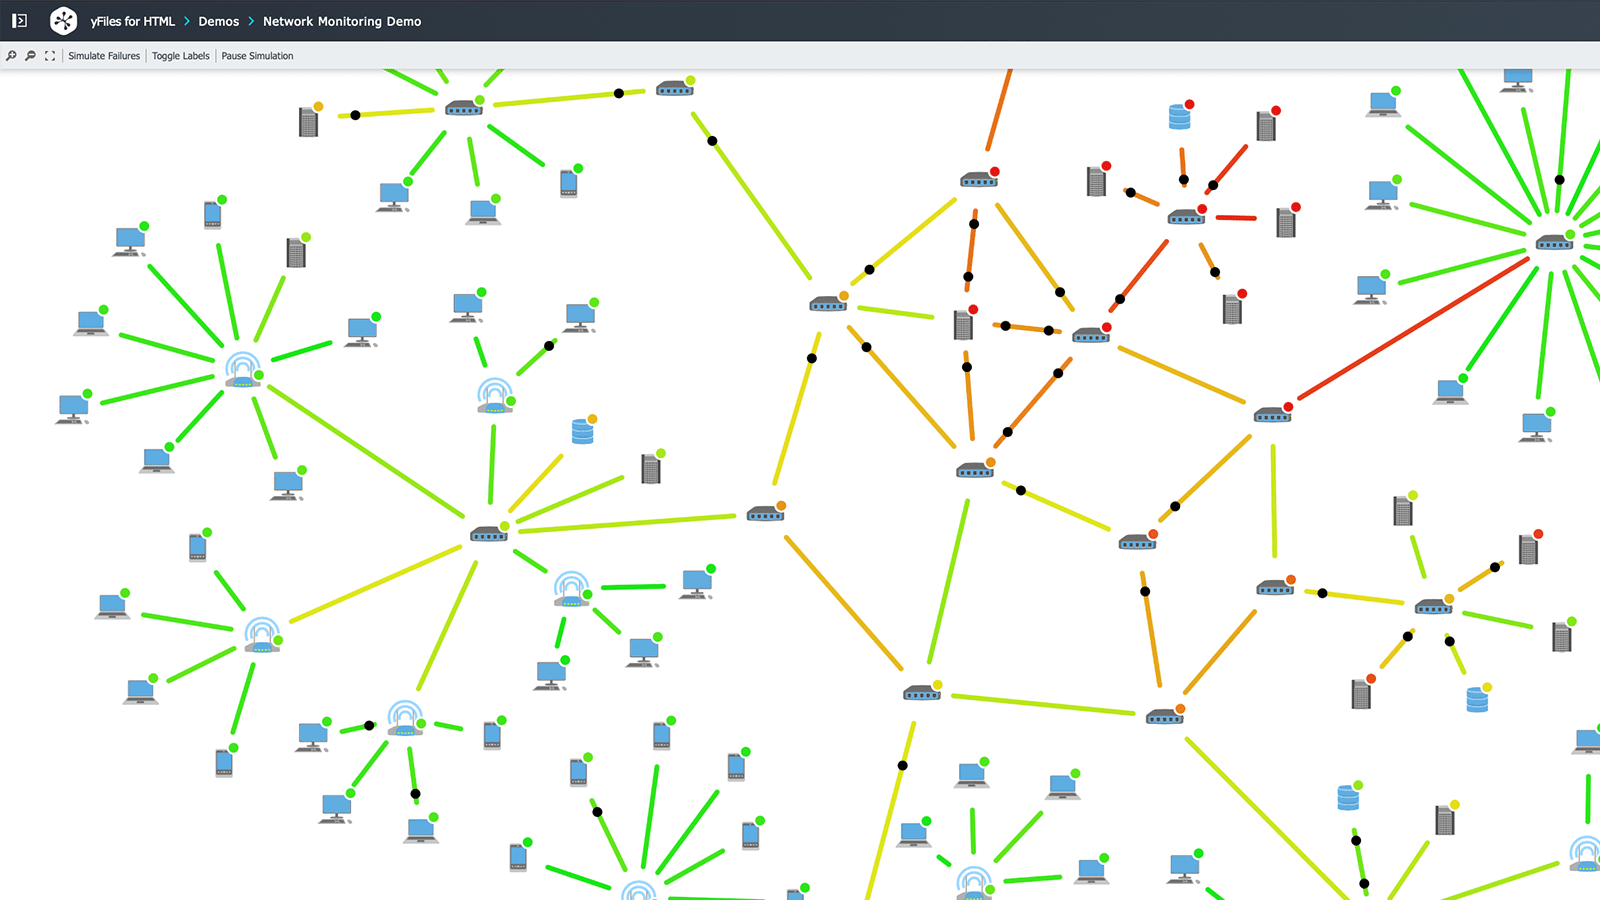
Adjust the design dynamically to the required zoom level or data updates. Display dynamic data within visualizations that adapt based on the context. Add interactivity and reactivity to the diagrams. Configure your design to display only the essential information your users require.
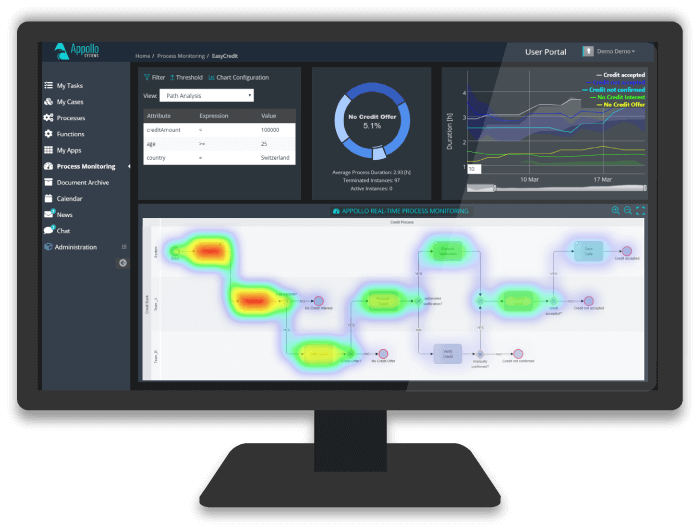
Automatically update your visualizations in real-time as data changes, while still maintaining a consistent design. Highlight important aspects in both the structure and the metadata of your diagrams.
Connect to one or more databases, graph databases, data stores, or other resources. Use any protocol available on the platform. The choice is yours!

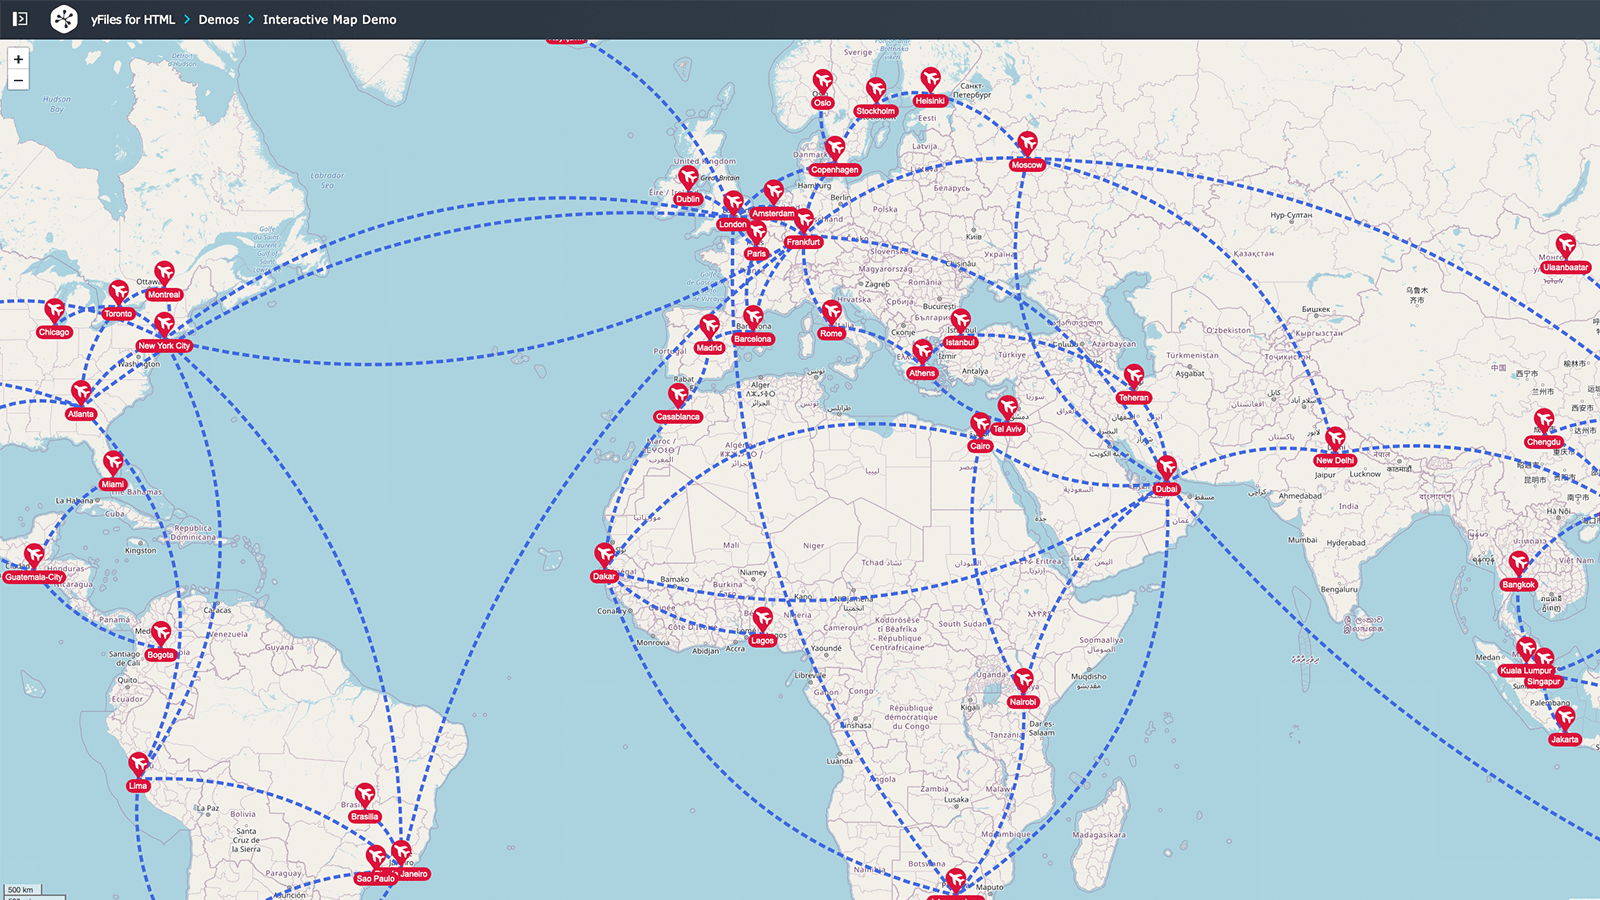
No matter what technology you are using. Add yFiles to existing apps, dashboards, and reports, or create new stunning apps that gracefully integrate with your line of products' look and feel.
Connect to any of your data sources and systems to create reactive and engaging applications that integrate perfectly with your users' workflow.
Interactive
yFiles Playground
Your interactive space to explore yFiles, the superior diagramming library. Let your creativity flow as you try out different examples, get a firsthand feel for yFiles and its capabilities.
Start experimenting with yFiles.
yFiles PlaygroundThank you very much for your prompt help and great support. The framework is impressive and we will definitely continue to use it.Dirk Stoermer, ATLAS.ti
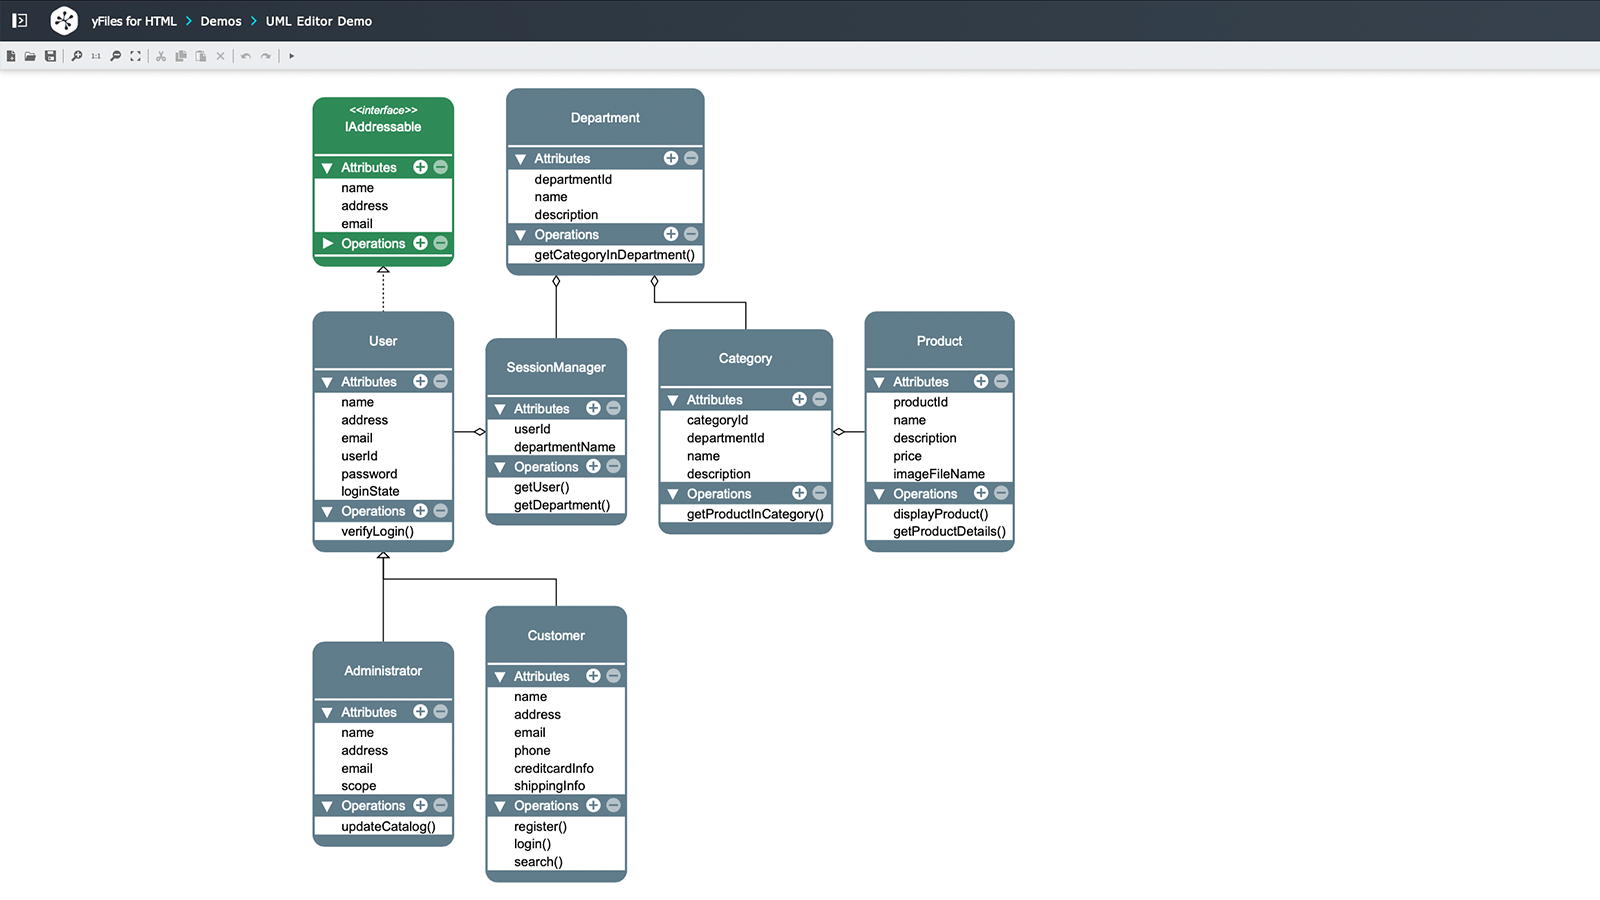
Ready to use React components for specific use cases like organization charts, company ownership charts or supply chains?
Discover our advanced React components.
yFiles React ComponentsVSDX Export
Due to the high demand, we offer an additional add on that allows you to export all graphs also in Visio format VSDX.
This add on is only available for yFiles for HTML.
VSDX ExportTechnologies
yFiles platforms & variants
yFiles is available for 5 major platforms: HTML, JavaFX, Java (Swing), WinForms and WPF.
While yFiles is very similar on every platform, there are some minor differences due to the respective technical specifications.
Thanks to similar APIs across the different technologies, it’s easy to migrate between yFiles products to cover new platforms. So there’s no need to start from scratch when technologies change (as they always do)!
platform
platform
platform
Advanced integration possibilities

Interactive live demos
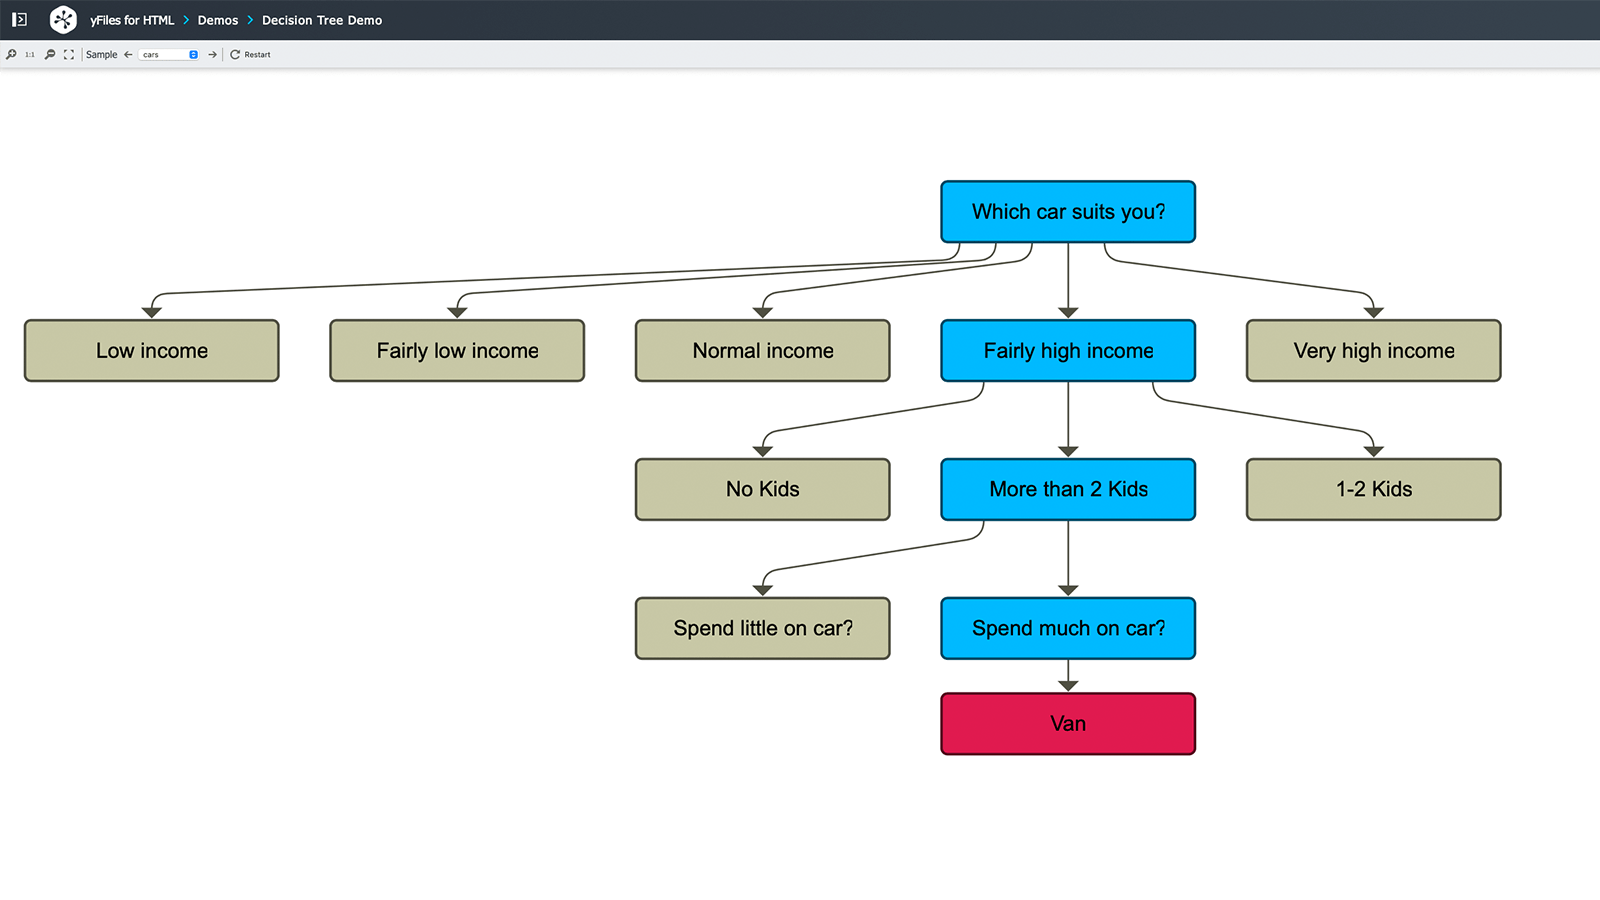
Explore a compelling presentation developed using yFiles for HTML.
Try yEd Live, our free online diagram editor.
yFiles free of charge!


Got questions?
Ask our Customer Success Team!
We’re here for you –for technical support, info on licensing, or efficient feedback.
Support & help
We are dedicated to your development's success.
Explore our collection of free, invaluable resources:
code
Review the origins of more than two hundred source code applications and tutorial steps. Try out the apps online and browse the fully commented and documented sources in our GitHub repositories.
Play with hundreds of demos, online, discover yFiless’ unmatched features. Find demos illustrating complete use-case application, or technical demos focusing on specific features, integrations, and customization options.
Browse and read the complete documentation for the yFiles API. Learn more about the type, class, interface, default, and configuration options. Find hundreds of source code examples and illustrations with best-practices, common-idioms, and customization options.
Guide
Find a detailed description of the features available in yFiles in our extensive Developer's Guide. Get everything from a high-level introduction to detailed customization options on the concepts, data structures, layout- and graph analysis algorithms.
Get a wide selection of videos. Watch how-to clips to get started in no time. Learn from previously recorded webinars. We show you how to set up your IDEs to get productive in no time, how to learn from and leverage the existing source code samples, or how to gracefully and smoothly integrate components for diagram creation into your existing apps and frameworks.
Services
As the diagramming experts, yWorks offers a comprehensive range of services.
From software support to training courses – you get everything you need to work successfully with data structures, complex algorithms, and advanced data visualization.
We have outstanding webinars, online seminars, coaching sessions, support, workshops, consulting services, project reviews, code reviews, coding, and more.


You get assistance directly from our core developers, ensuring a successful outcome from start to finish.
Licenses & pricing
We offer a variety of licenses to match your precise needs.
All yFiles licenses are perpetual, with zero royalty fees. You can add an optional annual subscription for maintenance and support.
The right yFiles license is just a few clicks away. If your requirements are not covered, let us know – we also offer individual, customizable licenses.
Choose what best suits you:
Choose your next step!
Connect with our Customer Success Team regarding your ideas or projects.

Get more detailed information about specific yFiles topics.
Try yFiles and our premium support free of charge.
you might want to explore


Why, how, what? —Just ask the diagramming experts!

Our team is happy to advise you – no strings attached. Let's talk about your project and find the perfect solution for your needs!
E-mail: hello@yworks.com
Your message has been sent.
Your request could not be sent. Please reload the page and try again.
If the problem persists, please report the error to webmaster@yworks.com.
Learn more in our privacy policy.