Interactive Showcase of Graph Layouts
Because layouting options are numerous, exploring them with a tool is best.
Automatically and sensibly arranging a graph is one of the hardest challenges in graph visualization. While, at first glance, there are some general guidelines such as avoid overlapping nodes or minimize the number of crossings between edges, there are a plethora of specialized constraints and exceptions which are highly dependent on the desired type of diagram.
Layout Algorithms
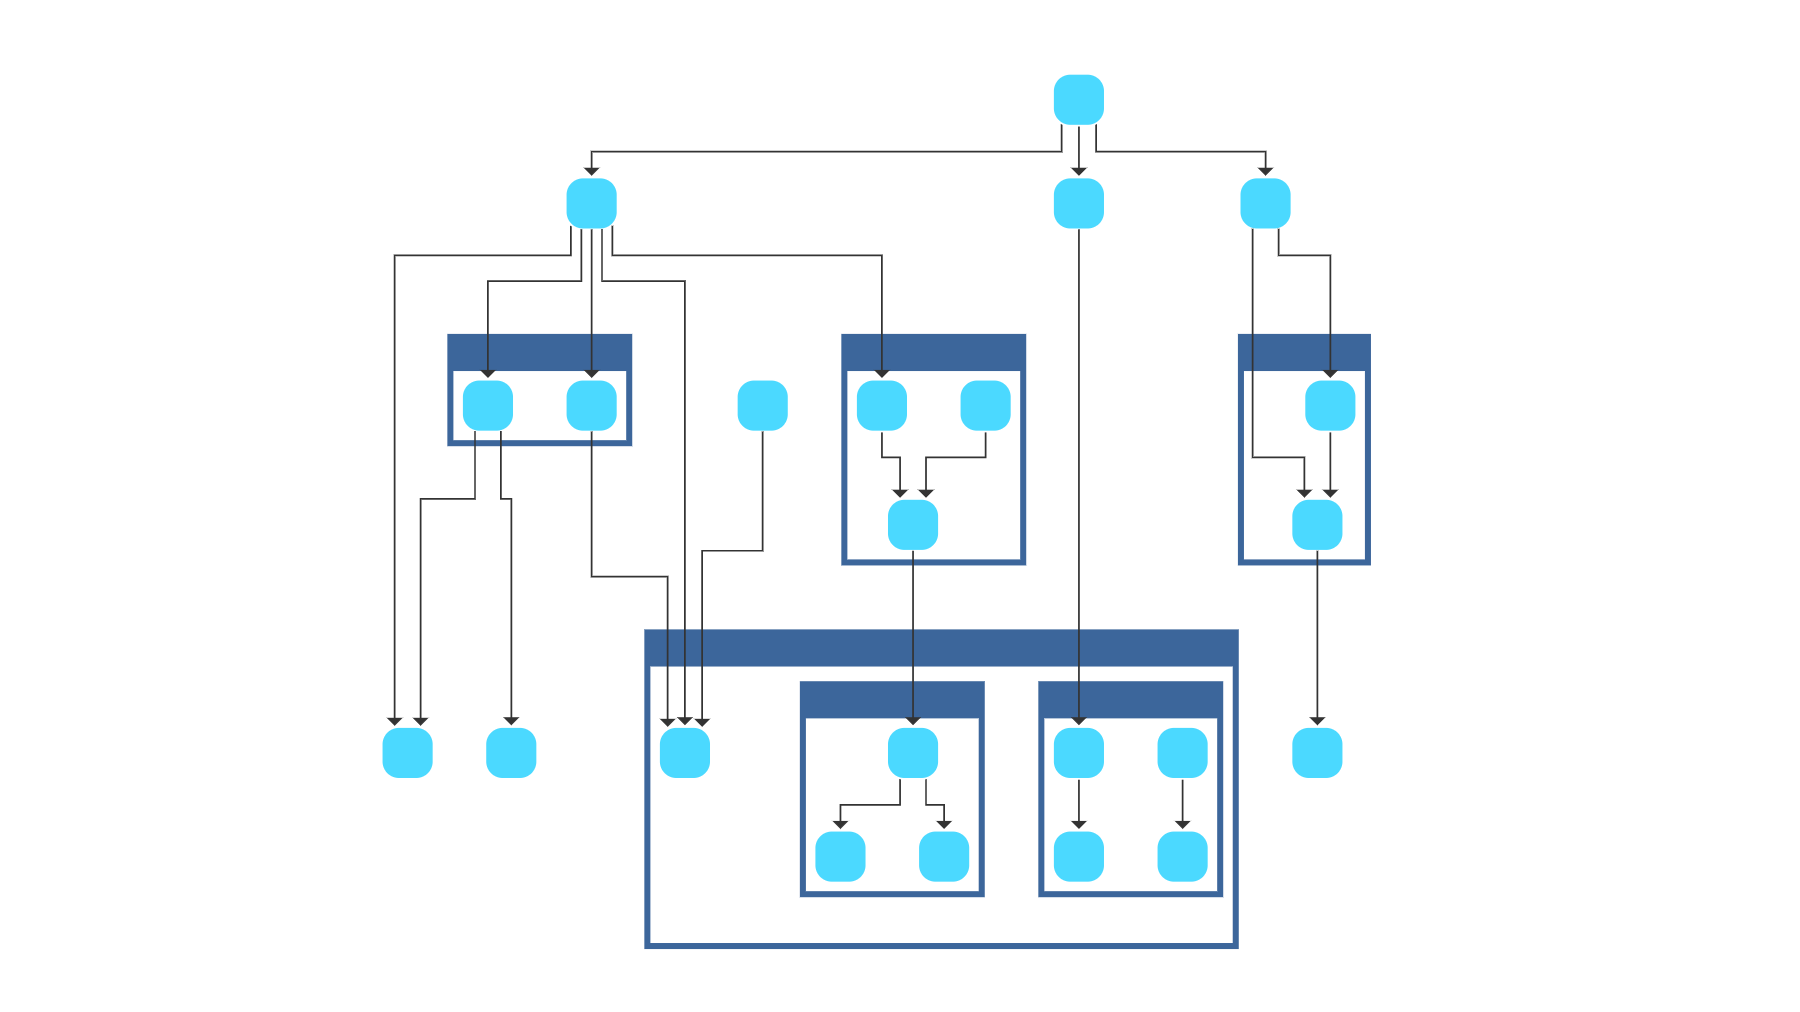
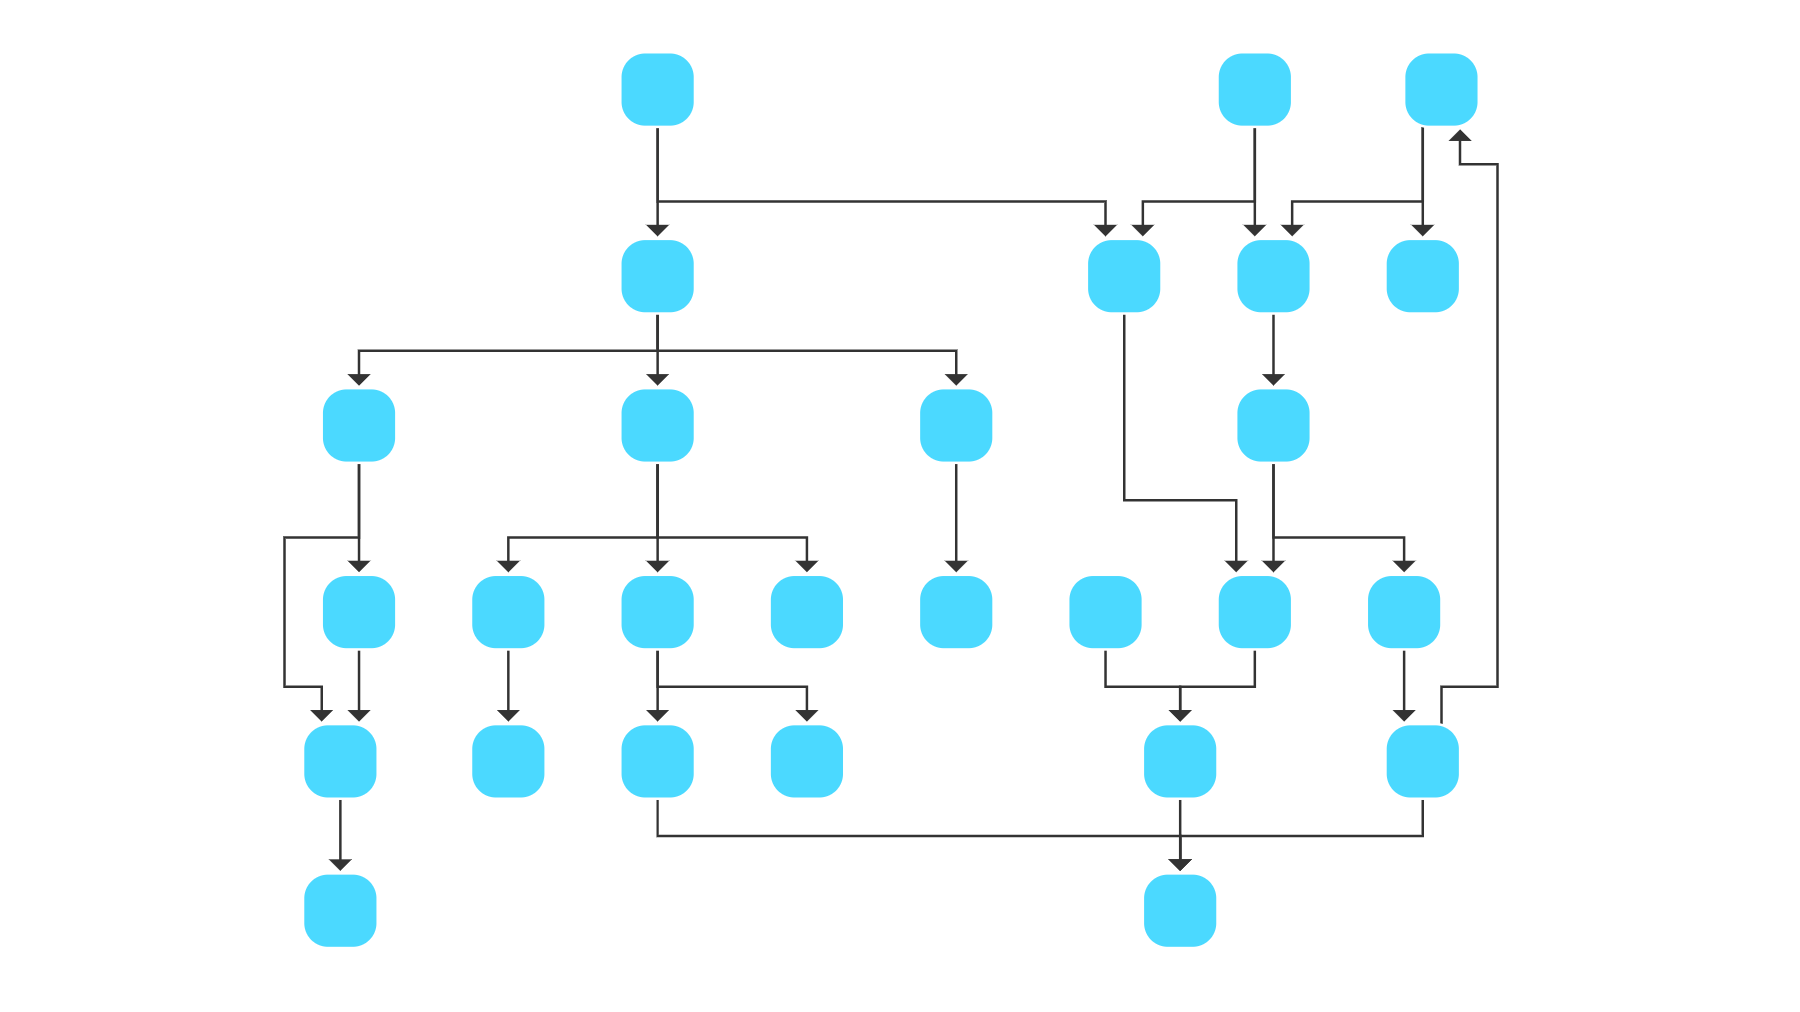
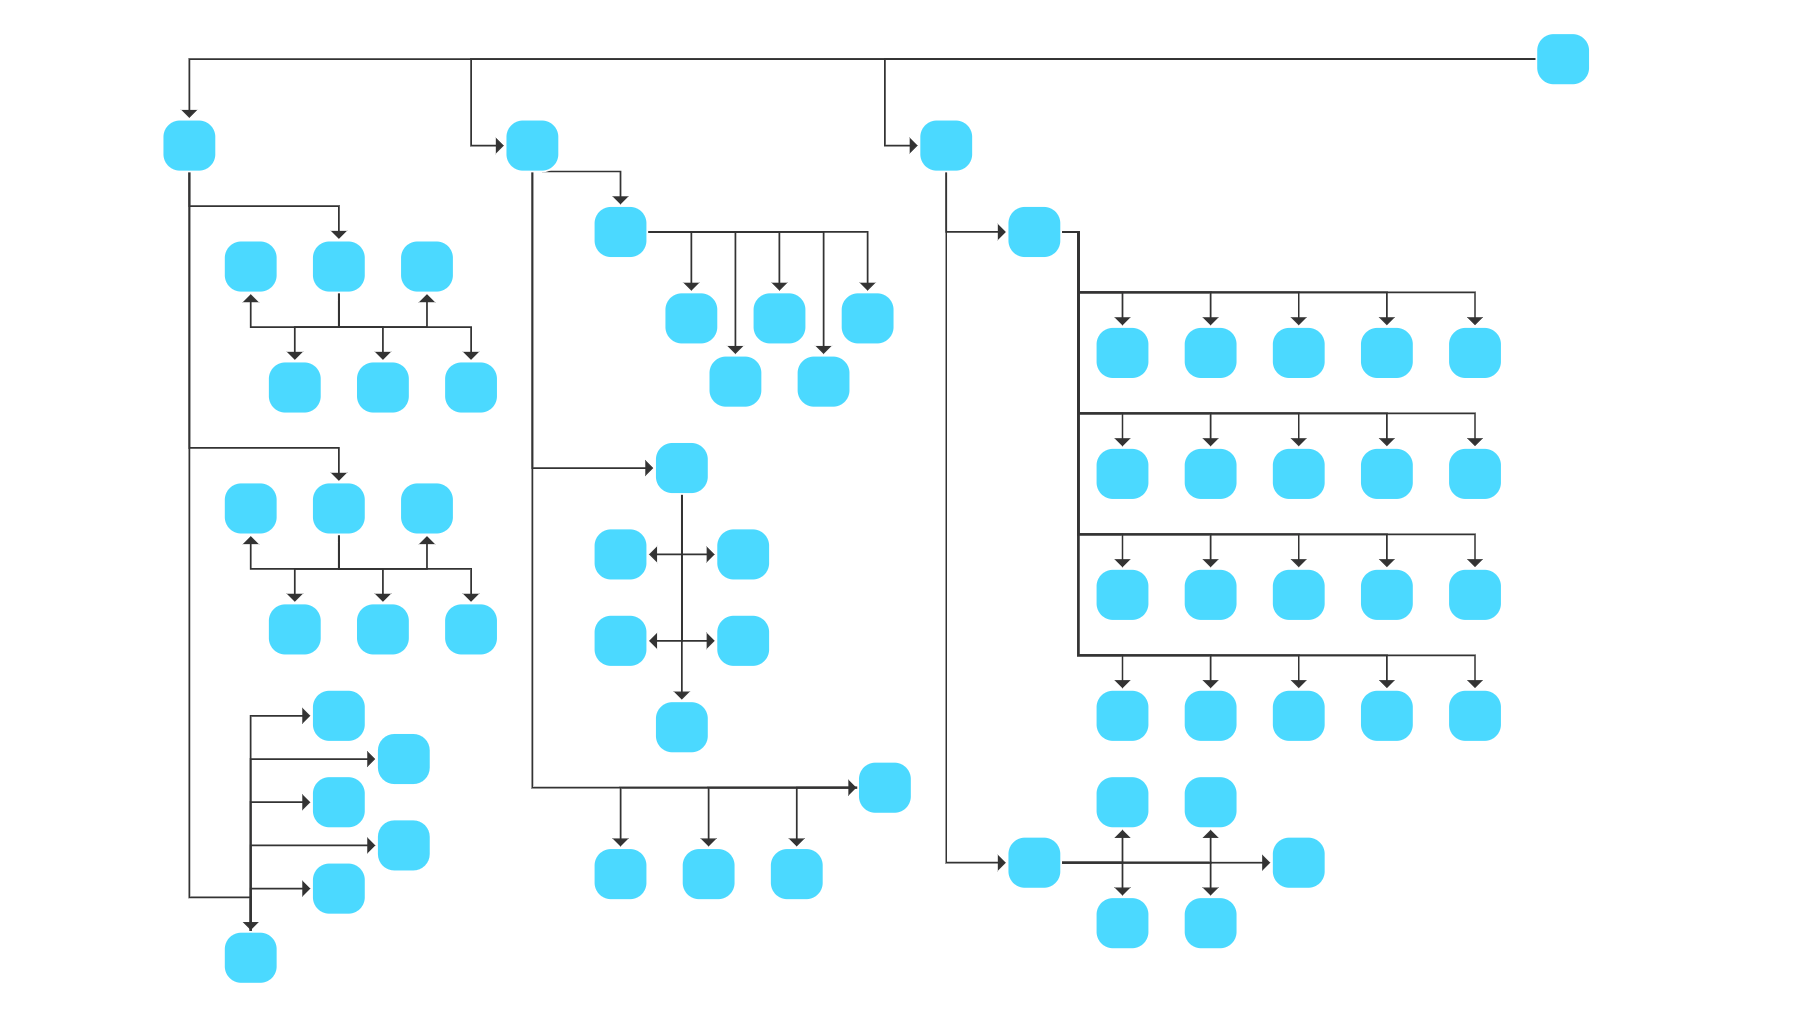
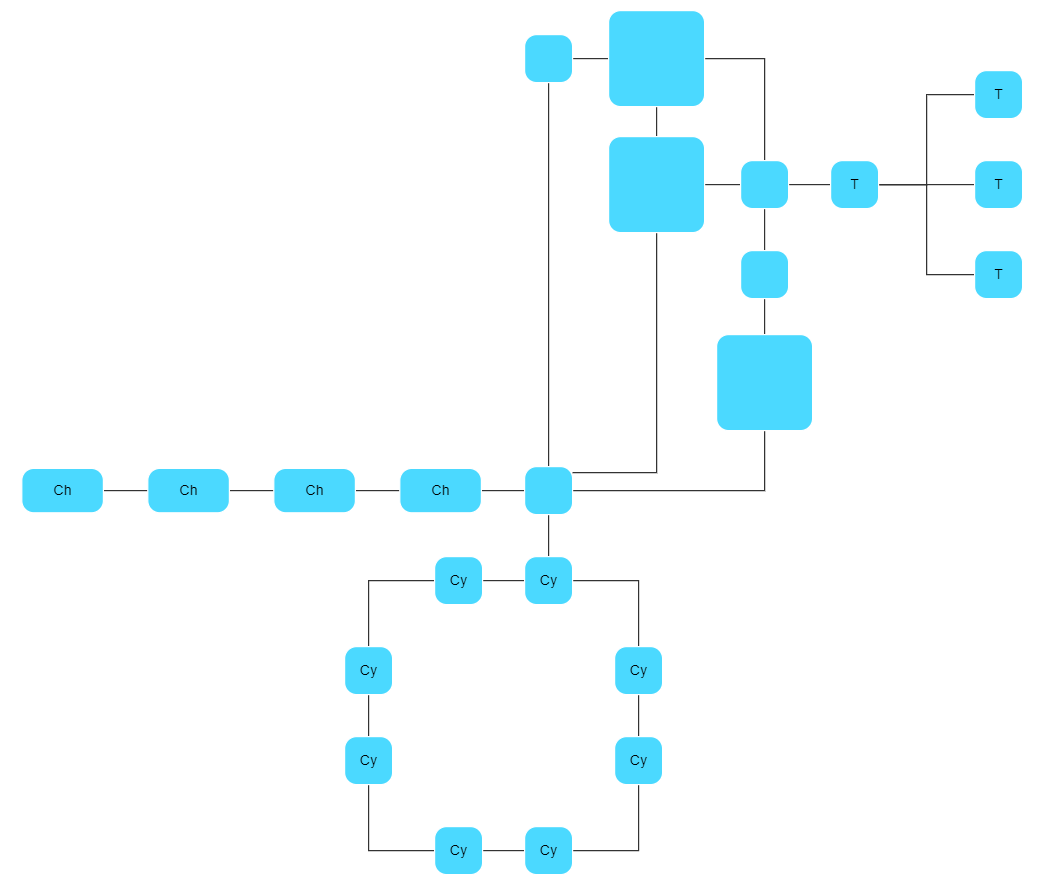
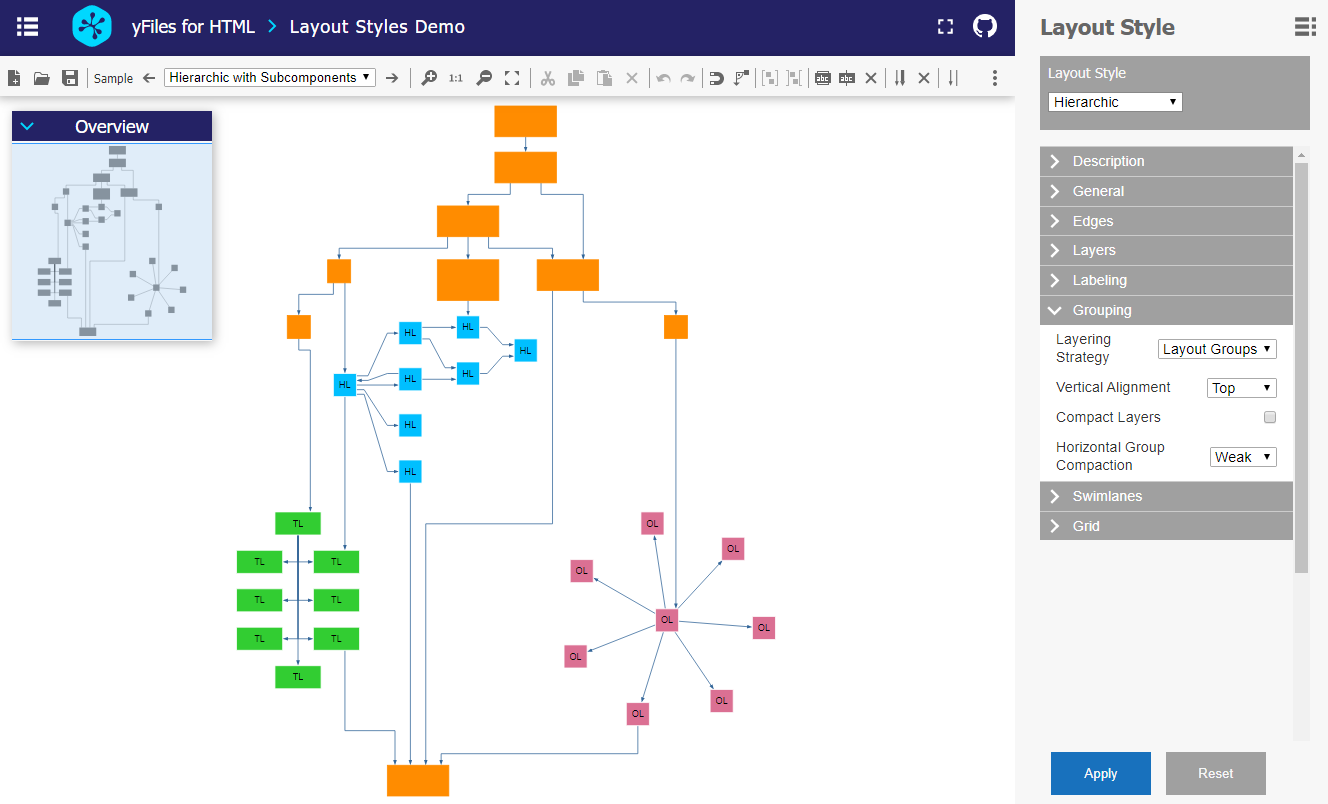
In a Hierarchical Layout, the nodes are distributed into layers so that most of the edges point to the main layout direction. The order of the nodes within the layers ensures that the number of edge crossings is as small as possible. There are different edge routing styles available: Edges can be orthogonal, polyline, or octilinear.
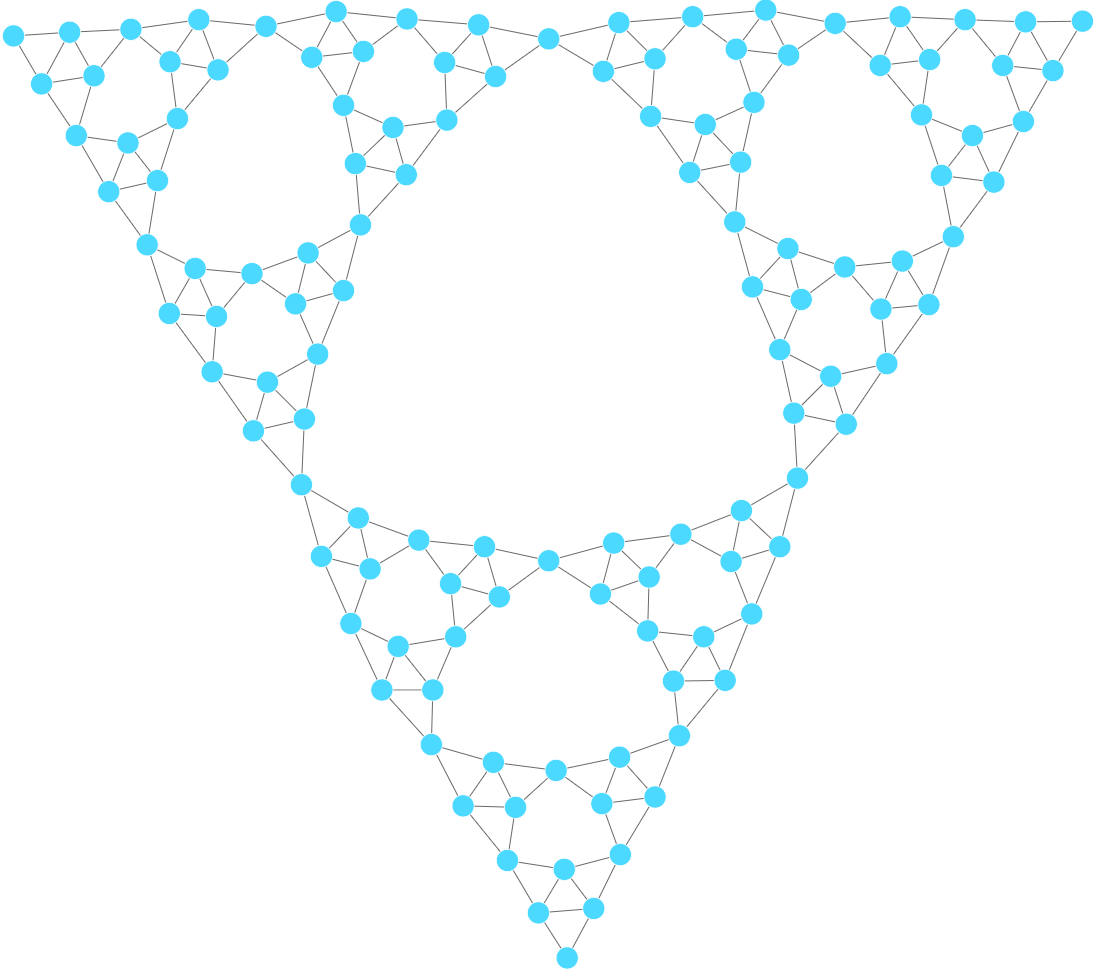
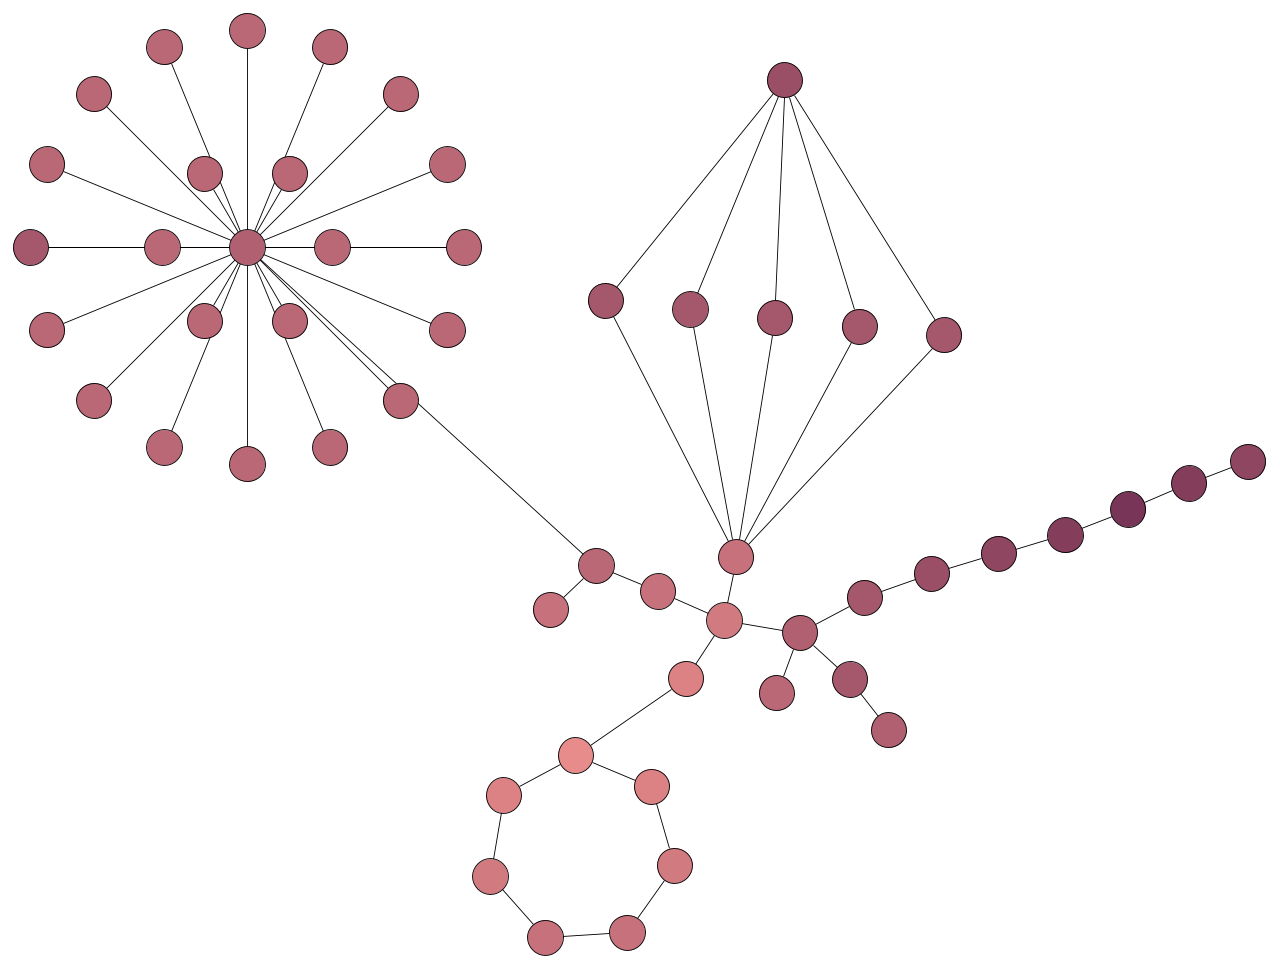
Organic Layouts result in a natural distribution of nodes that exhibits clusters and symmetric properties of the graph. The layout is very compact and places nodes close to their adjacent nodes. Edges maintain uniform lengths and are routed using straight-line segments without bends.
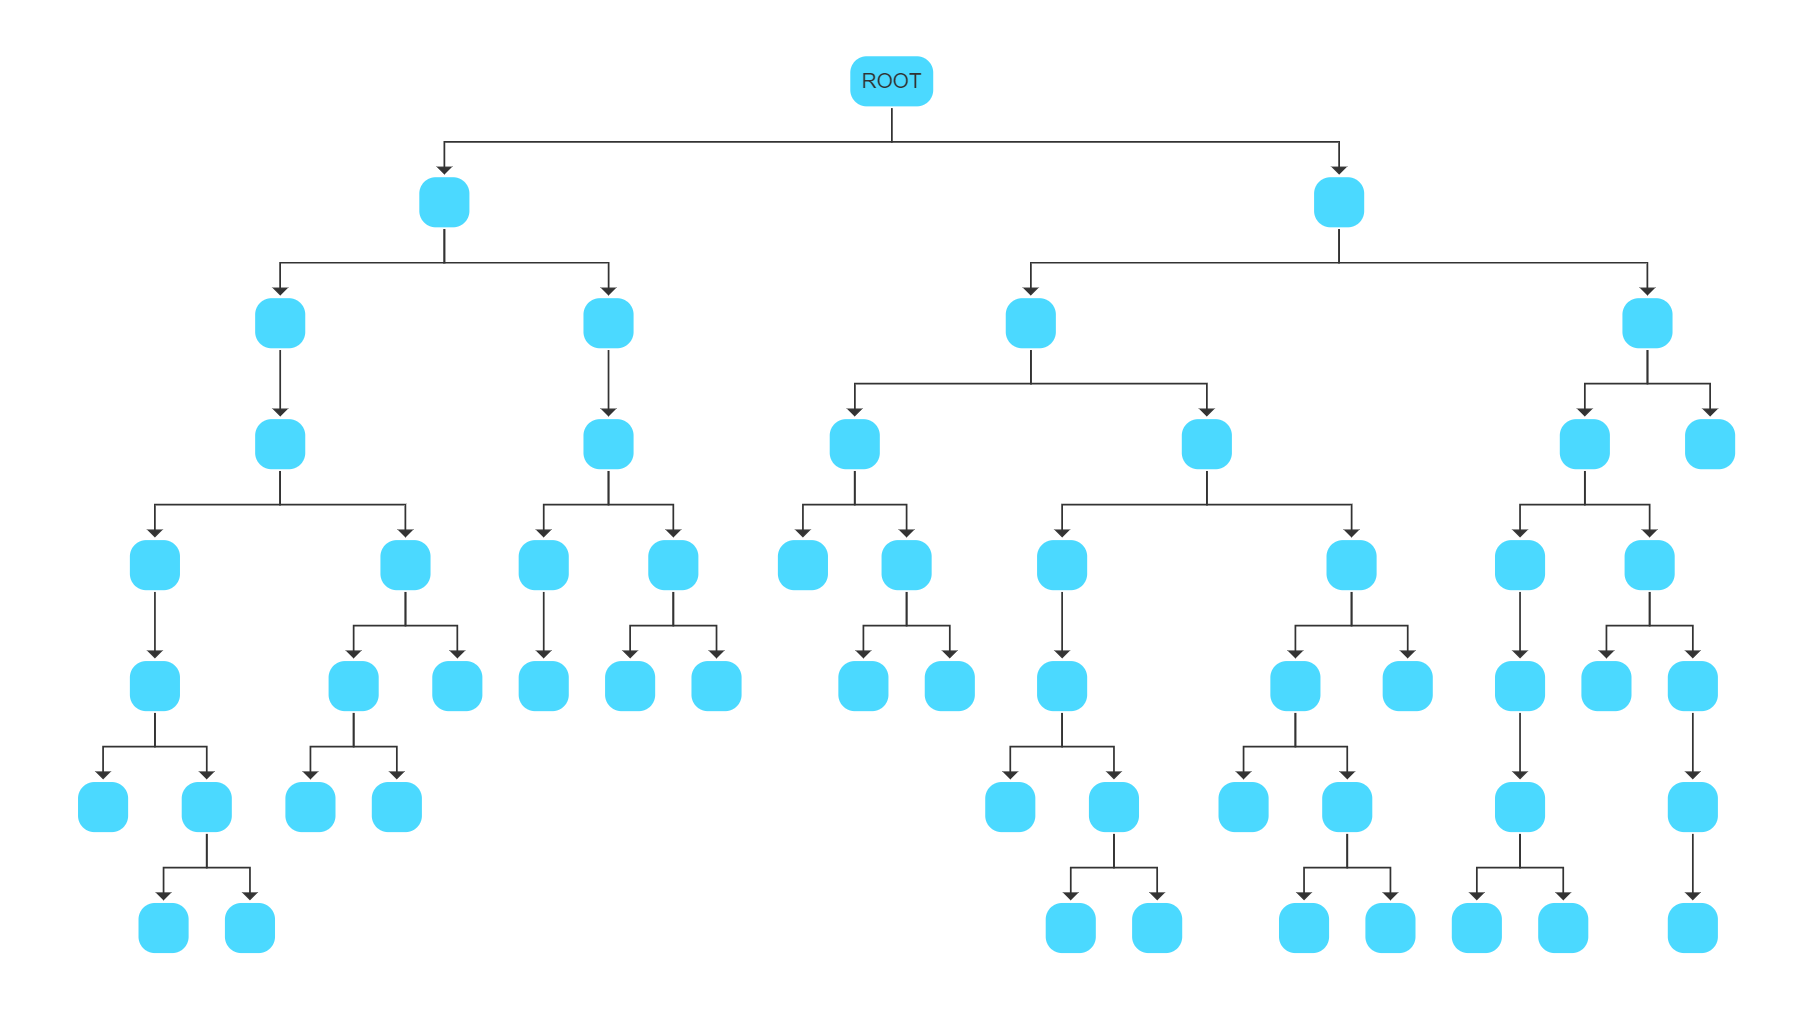
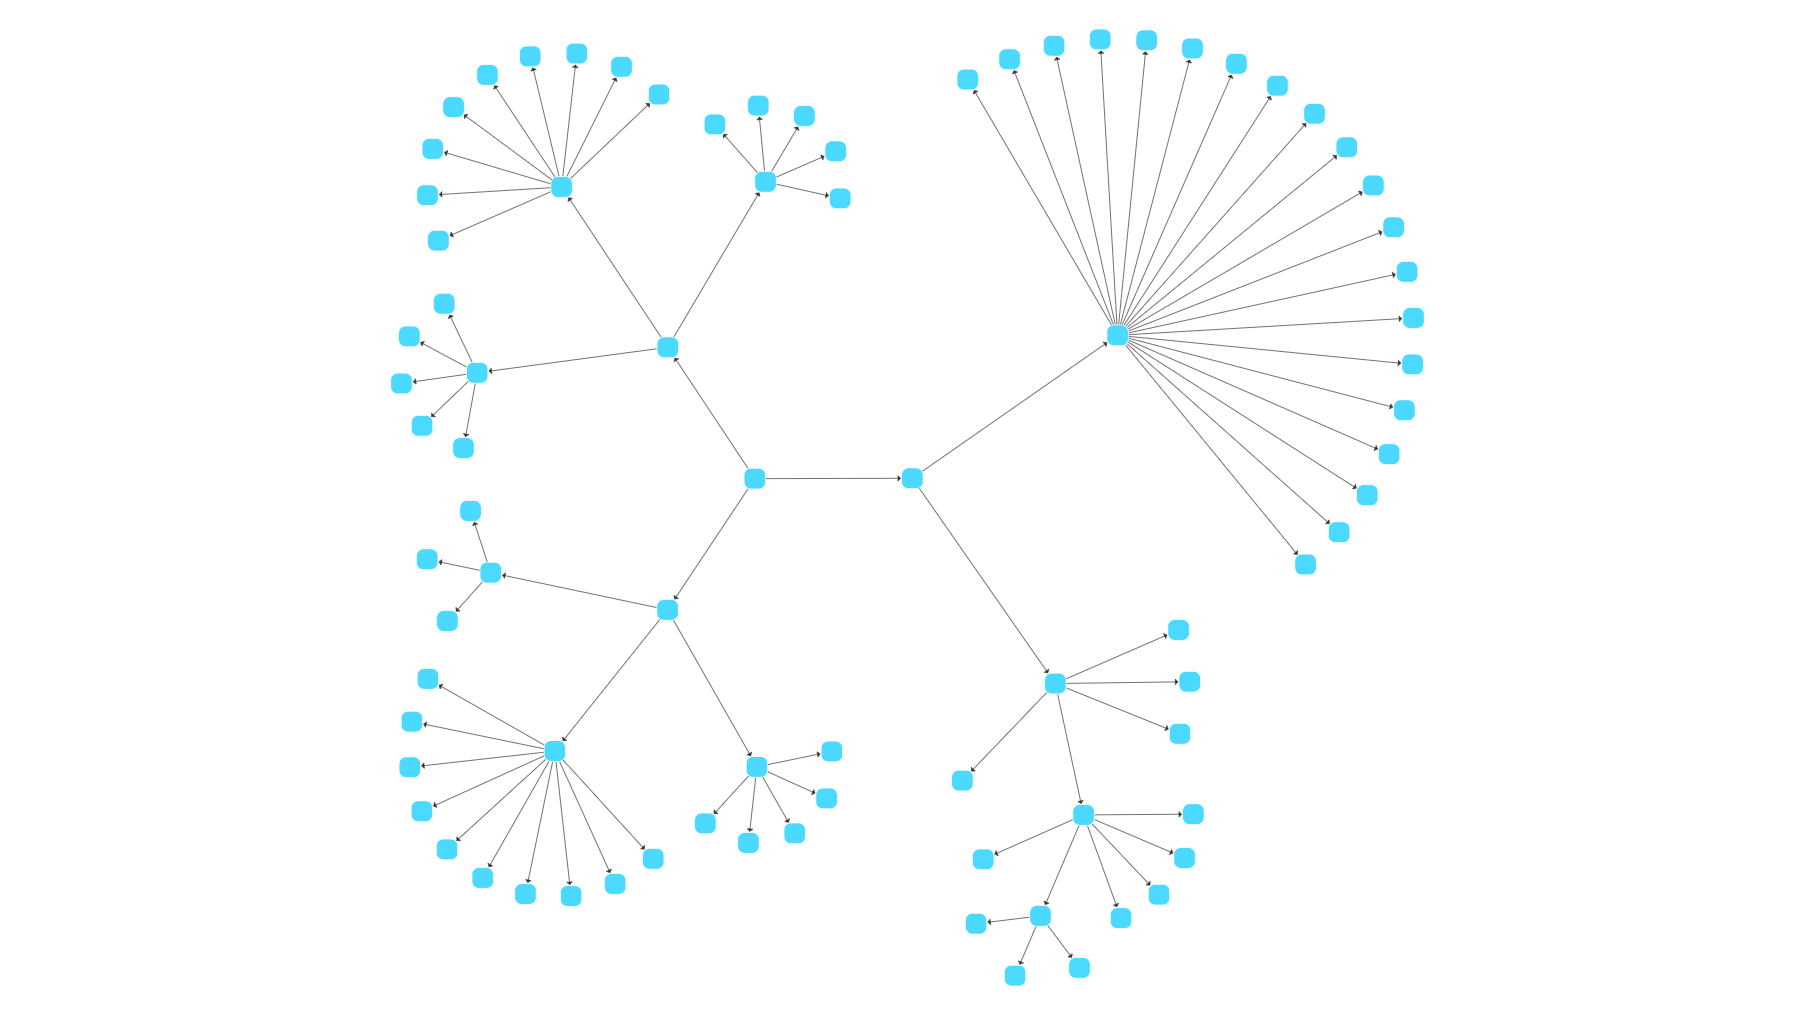
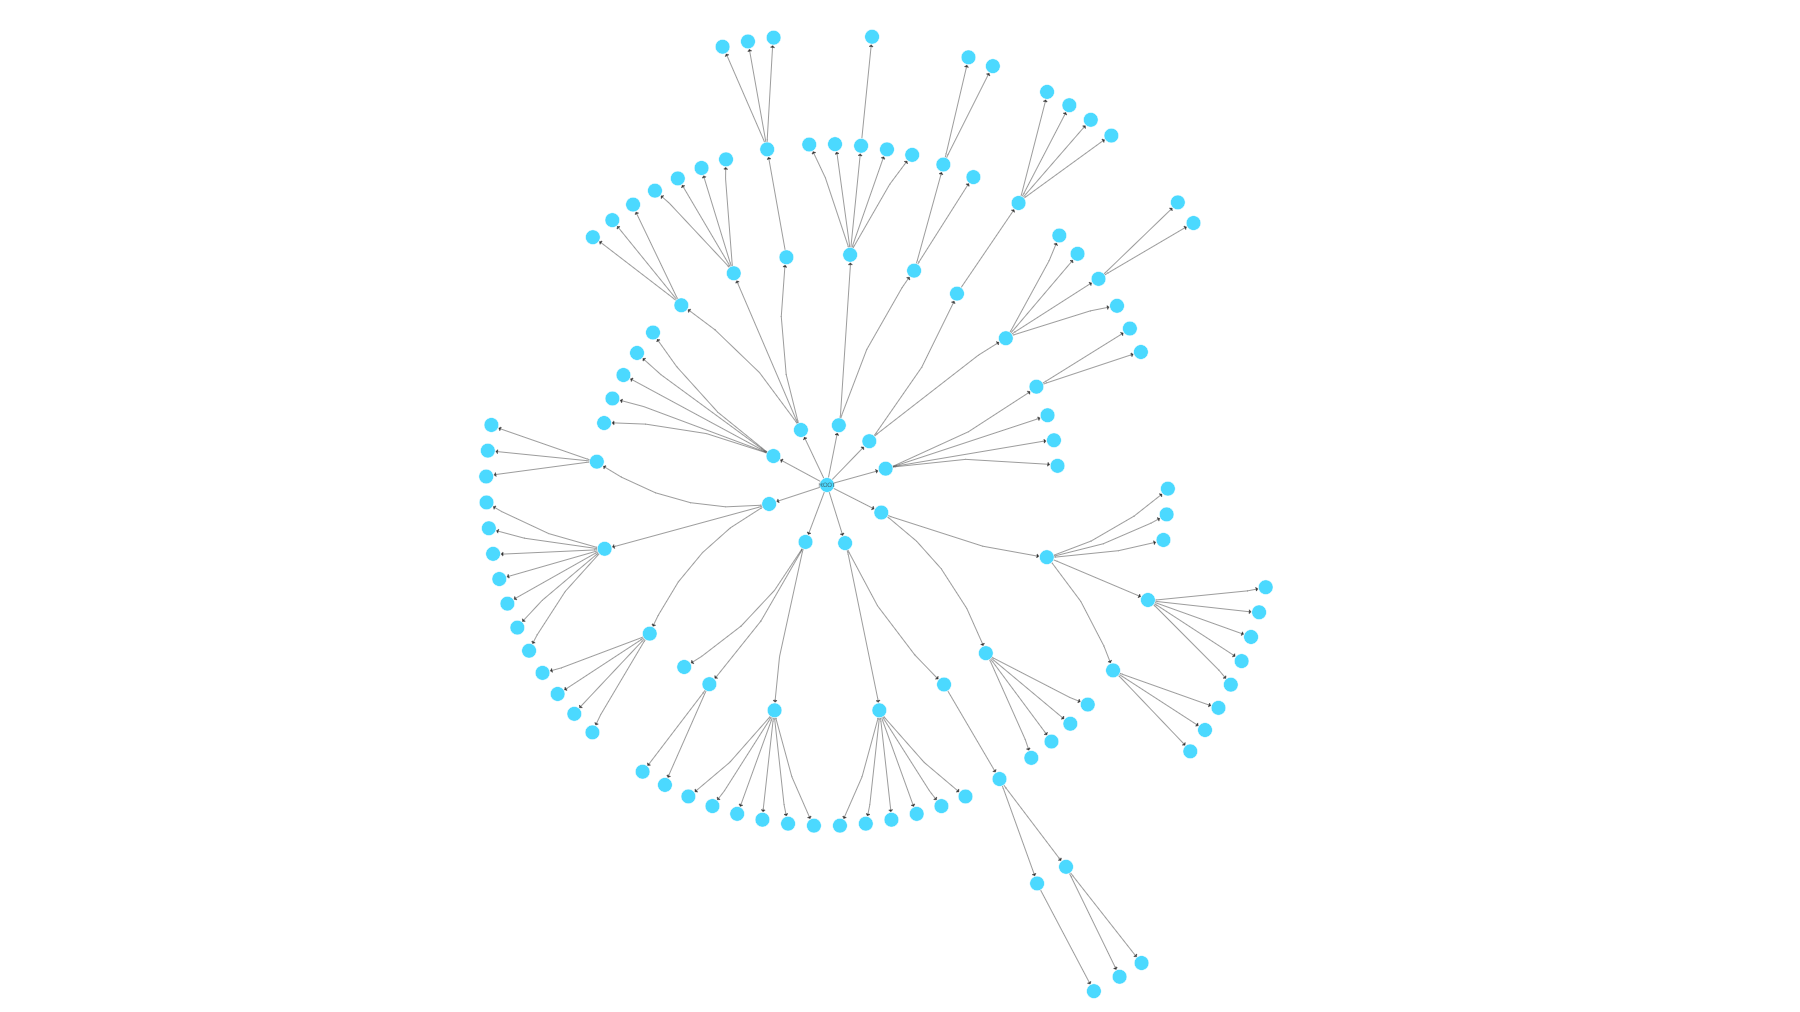
Tree Layouts arrange graphs as a tree that has a unique root node. All children are placed below or around their parent, corresponding to the main layout direction. The edges of the graph are routed as straight-line segments or in an orthogonal bus-like fashion.
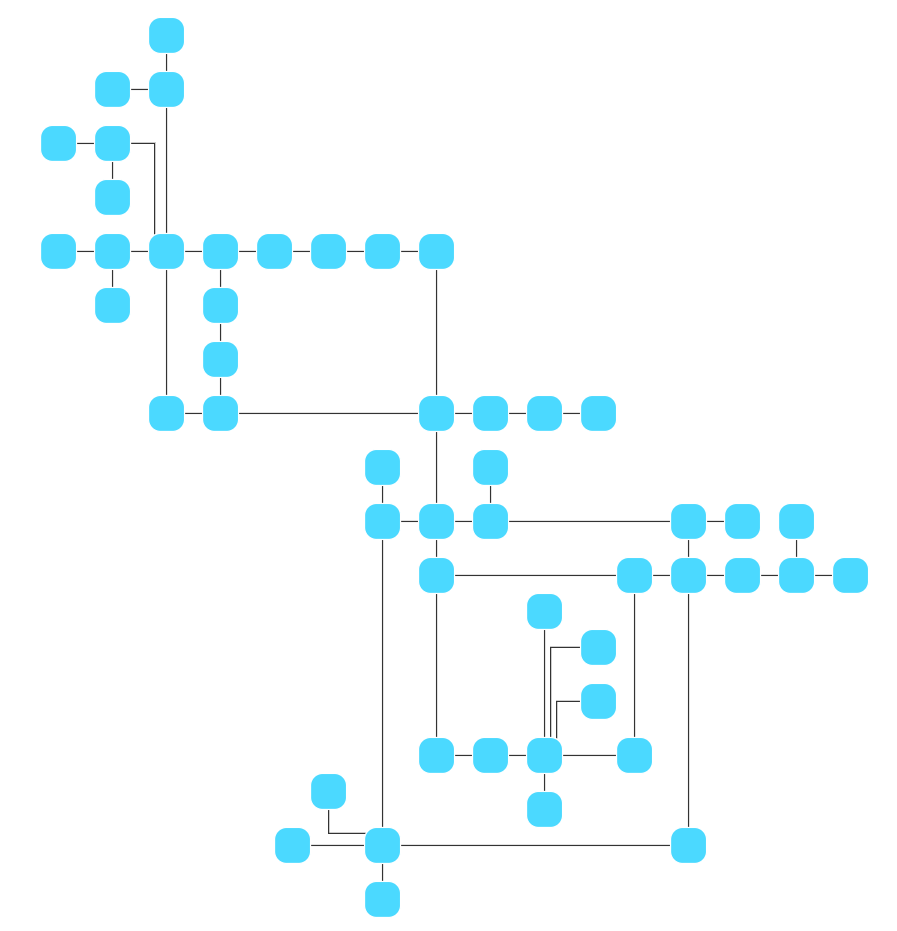
Orthogonal Layouts arrange the nodes of a given graph such that each edge consists of an alternating sequence of horizontal and vertical segments. This layout produces compact drawings with no overlapping nodes, few crossings, and few bends. It is well suited for small and medium-sized sparse graphs.
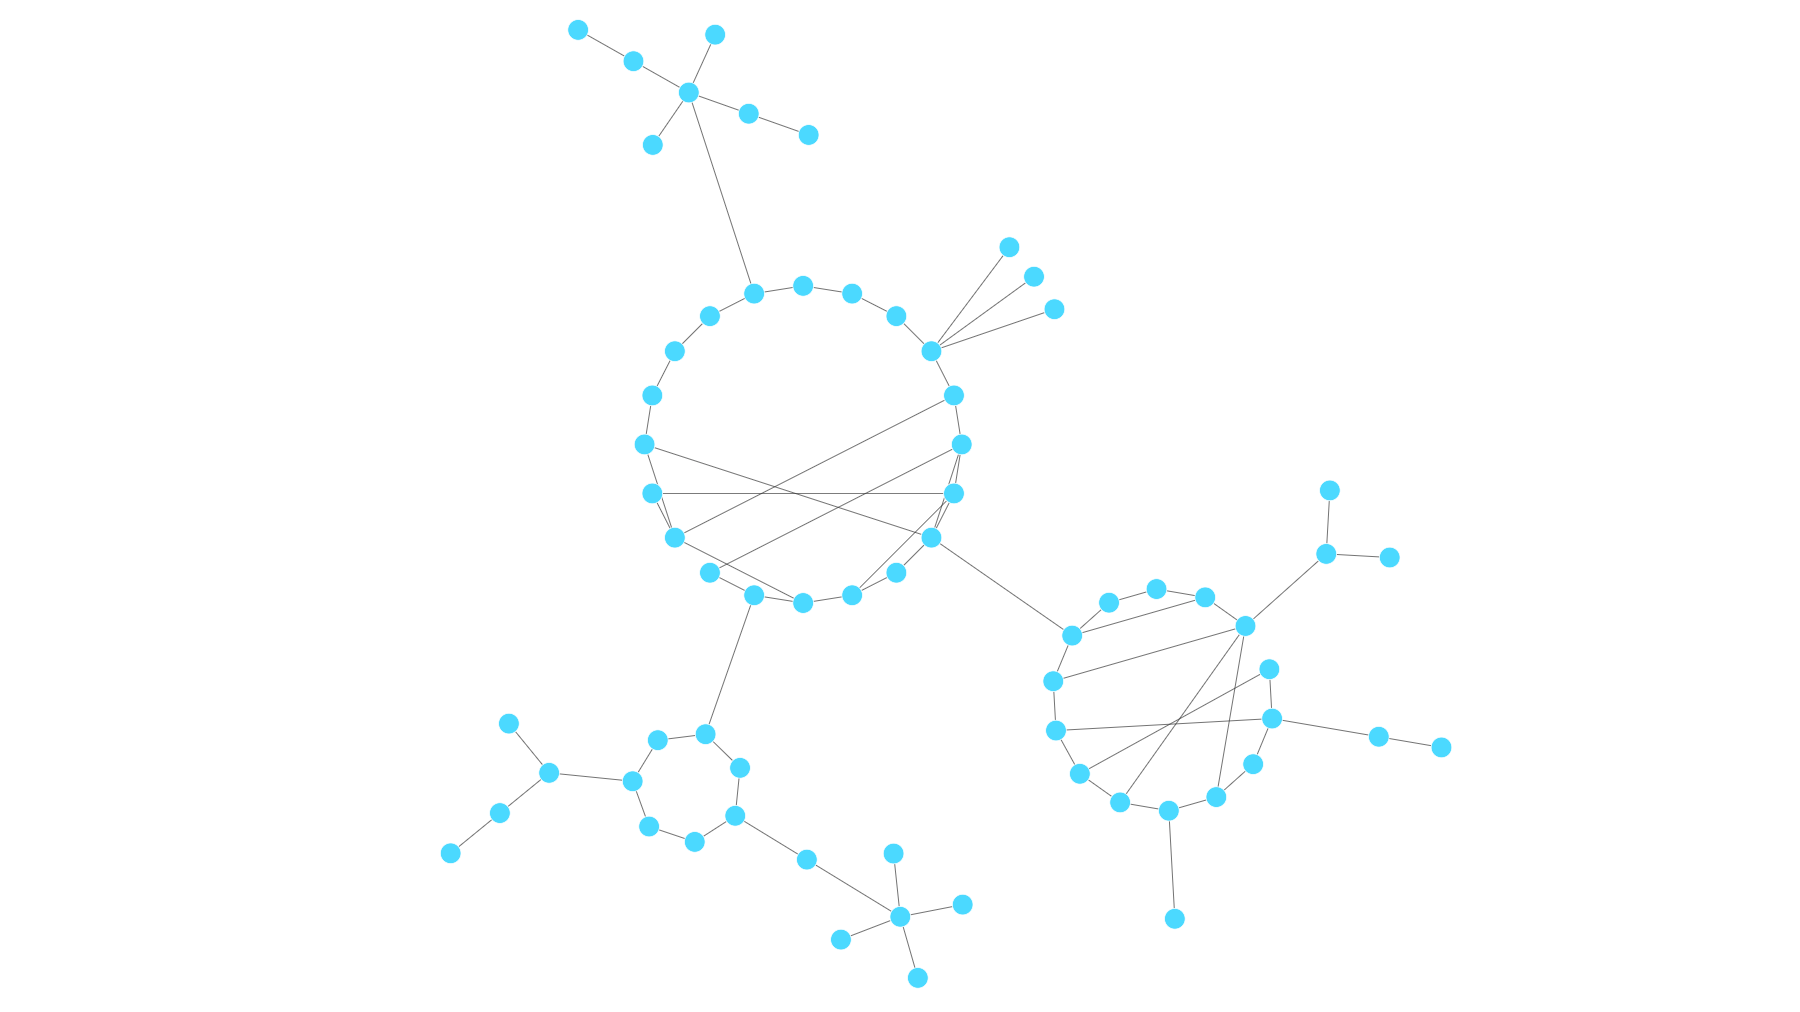
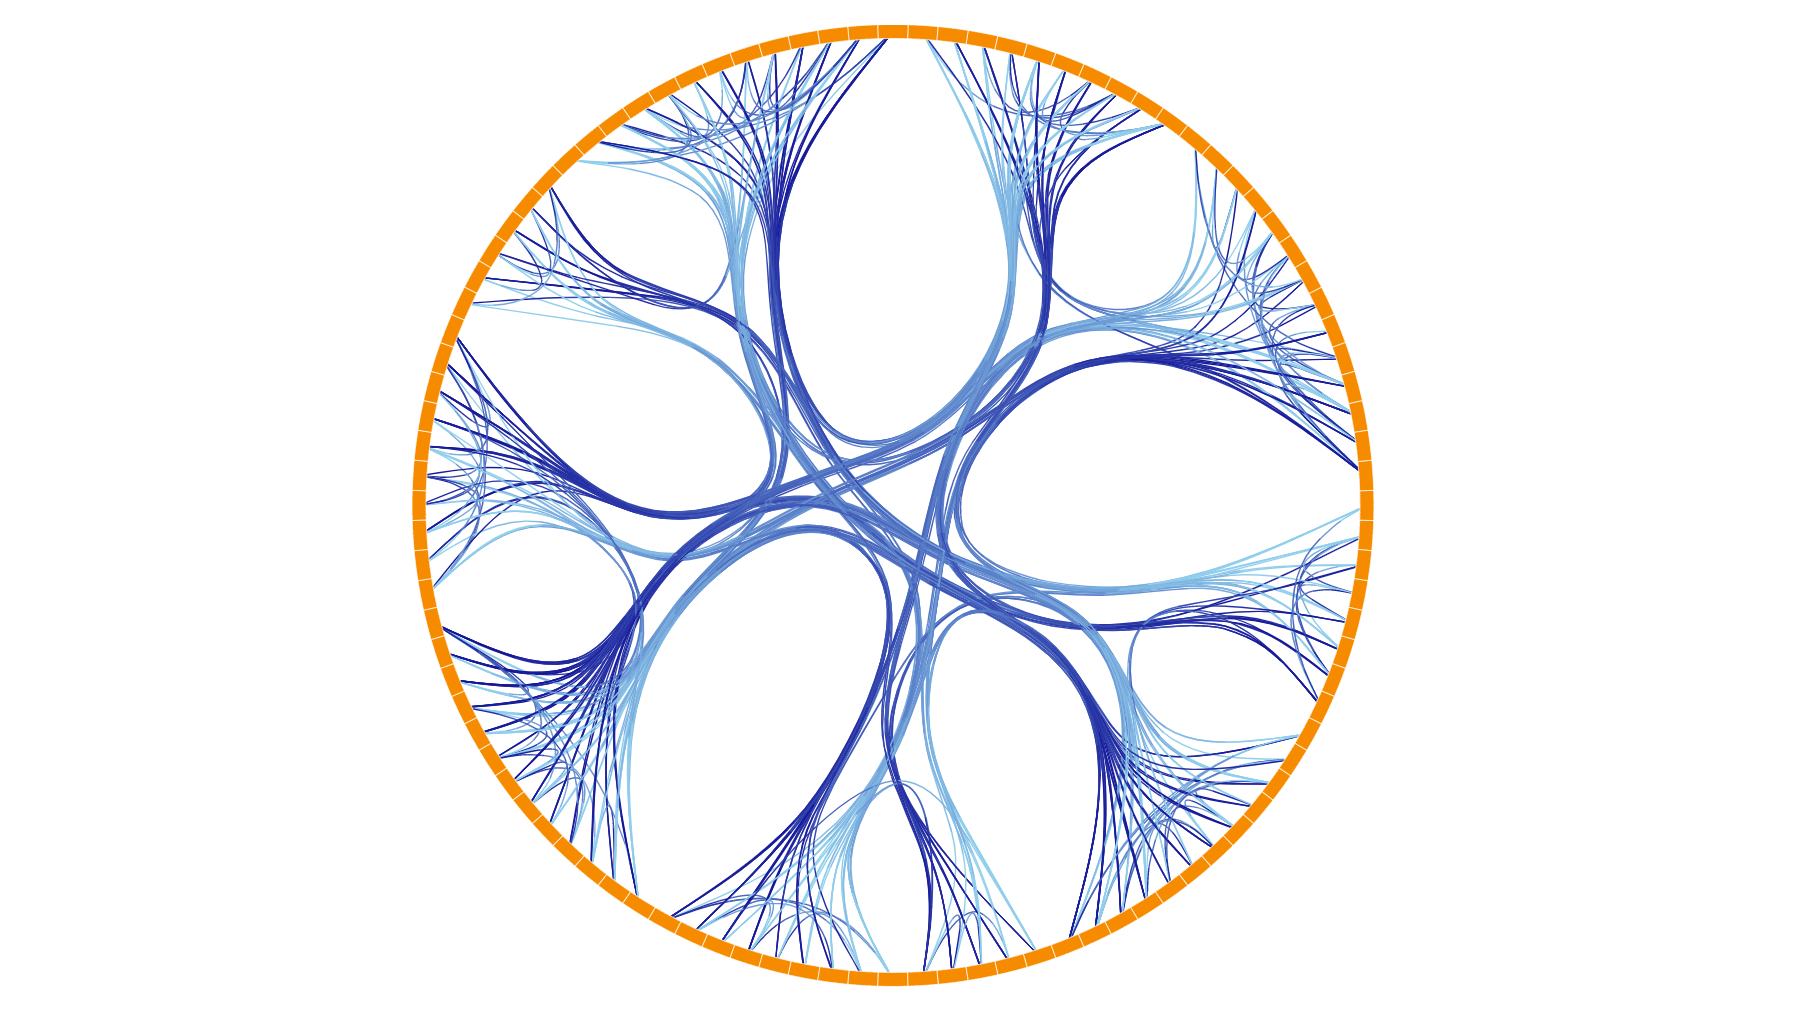
Circular Layout is suitable to emphasize group and tree structures as well. In contrast to other layouts algorithms, this layout arranges the nodes in circles and stars.
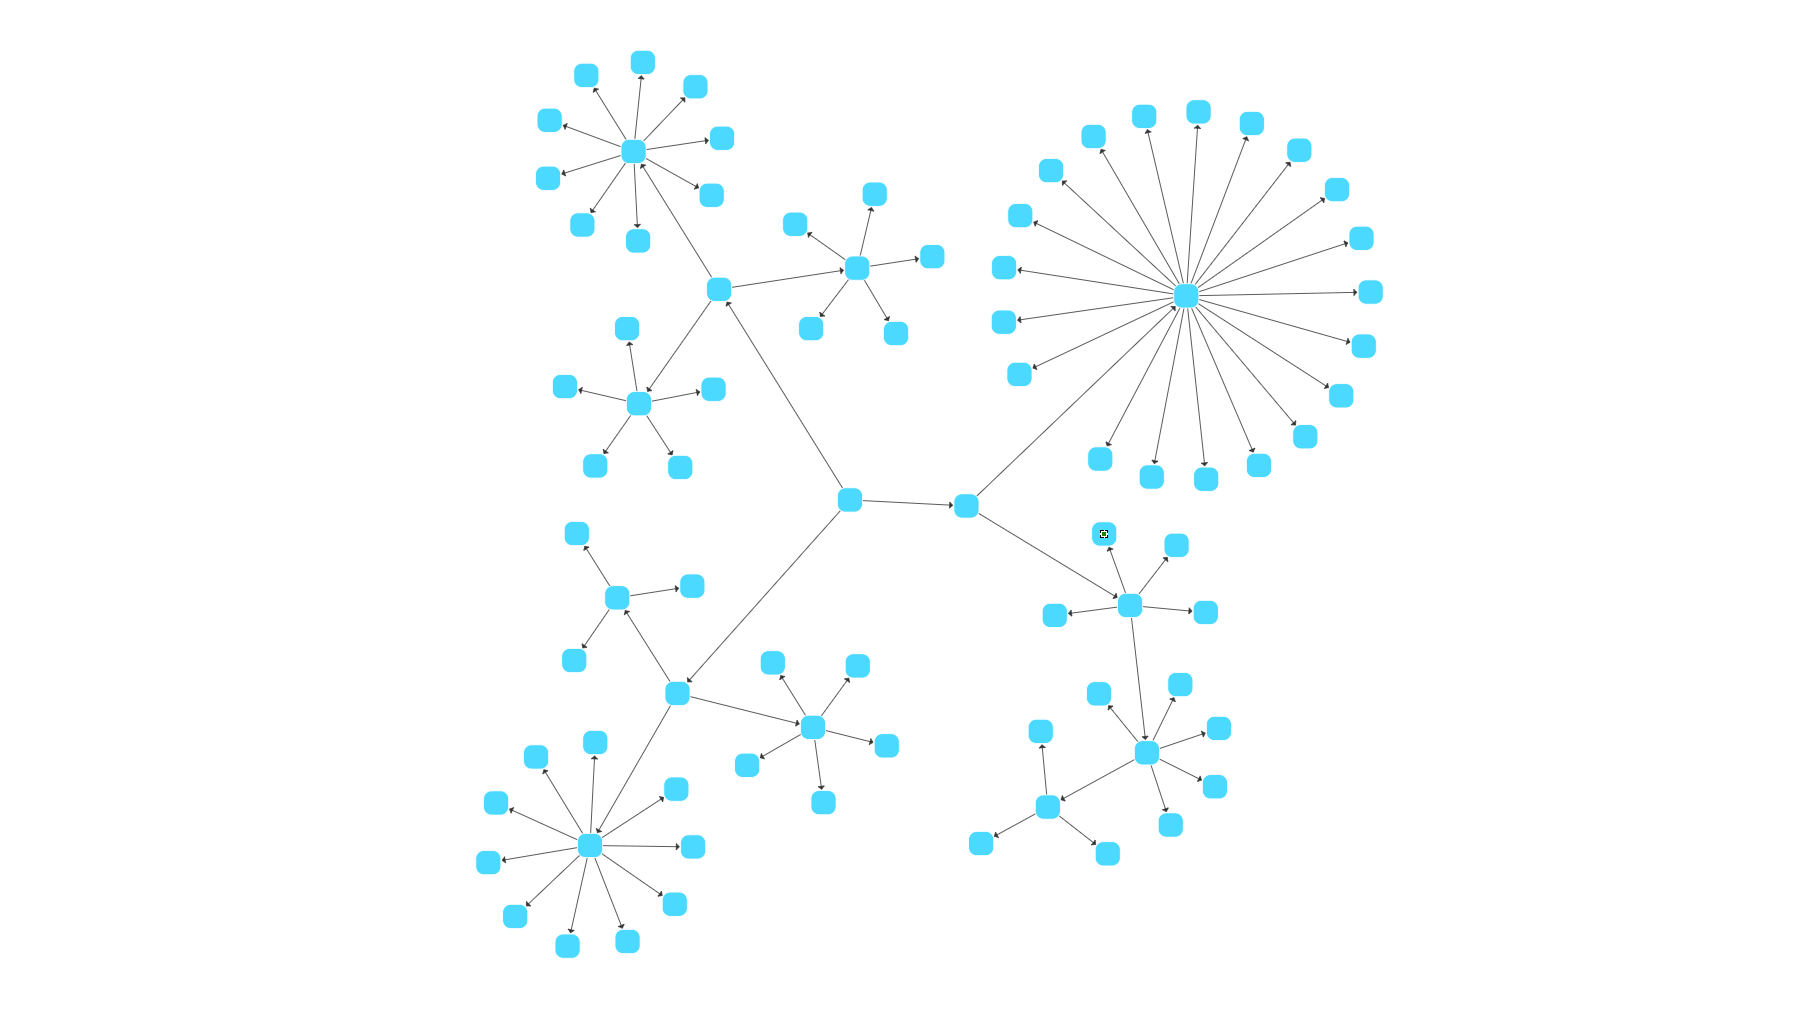
Radial Layout distributes the nodes of a graph in layers that are then drawn on concentric circles. If the first layer consists of just one node, its location determines the center of these circles. In case there are several nodes in the first layer, the center matches the center of the innermost circle.
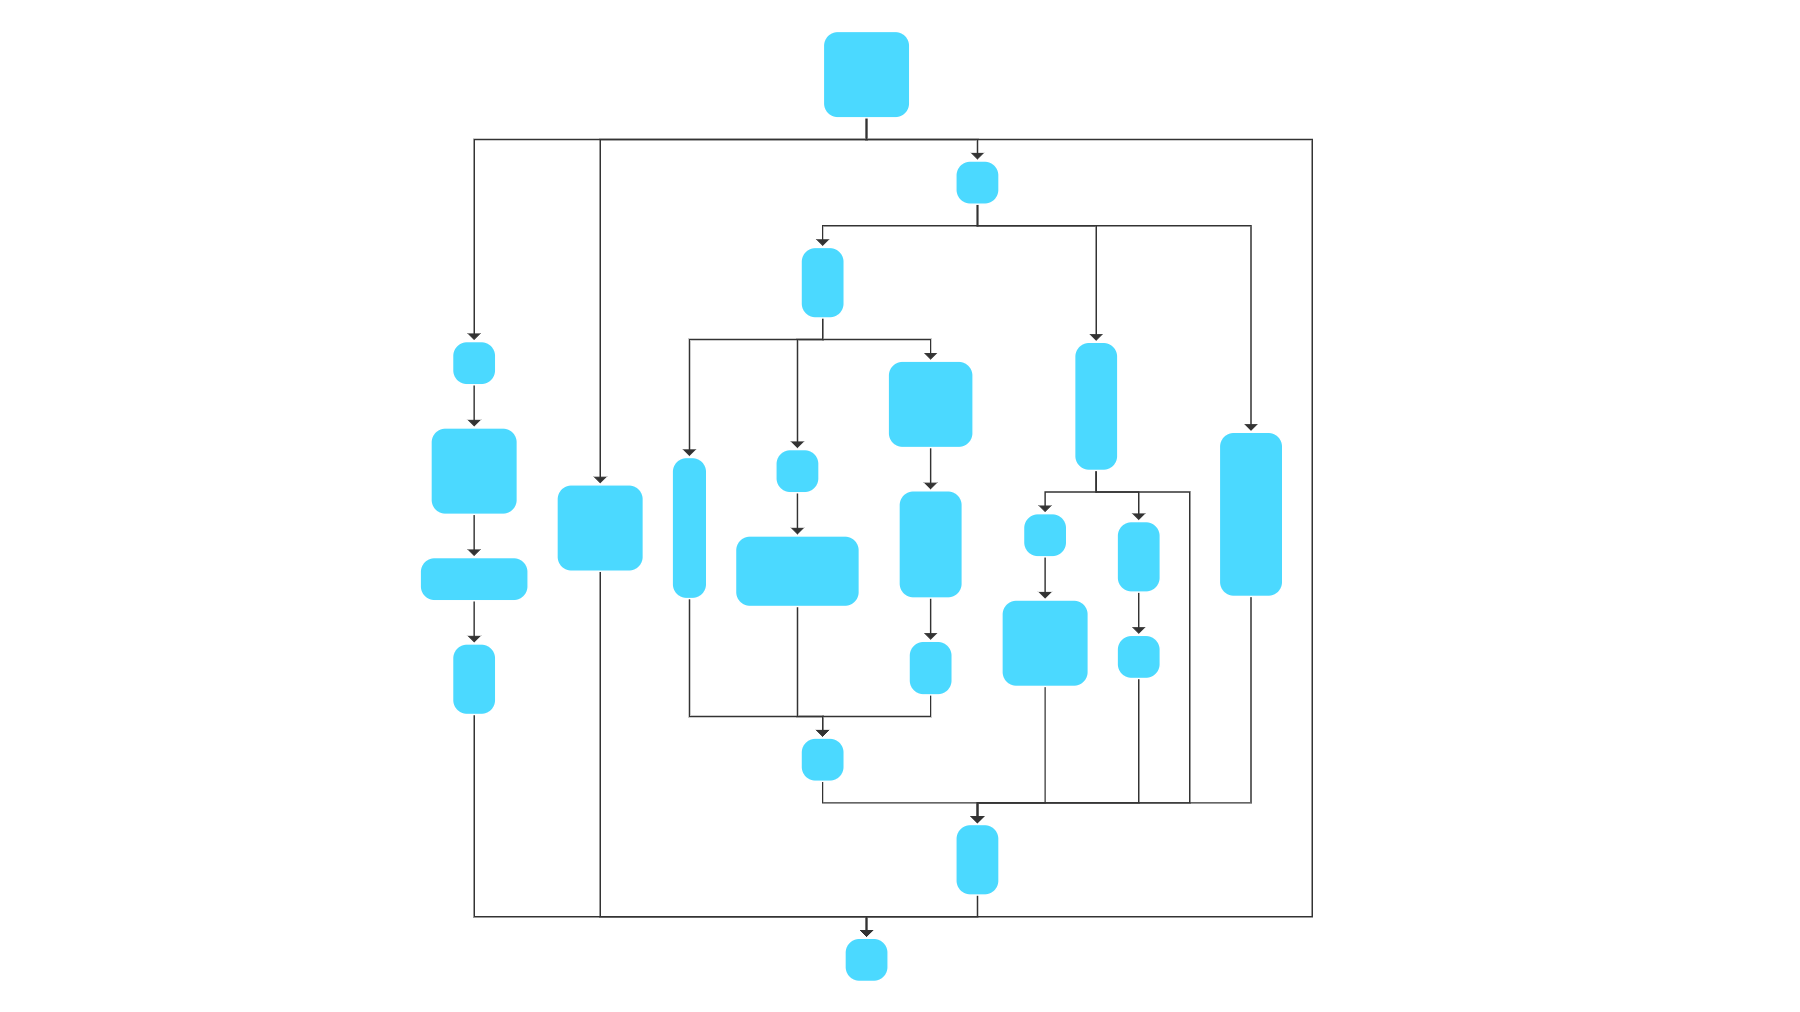
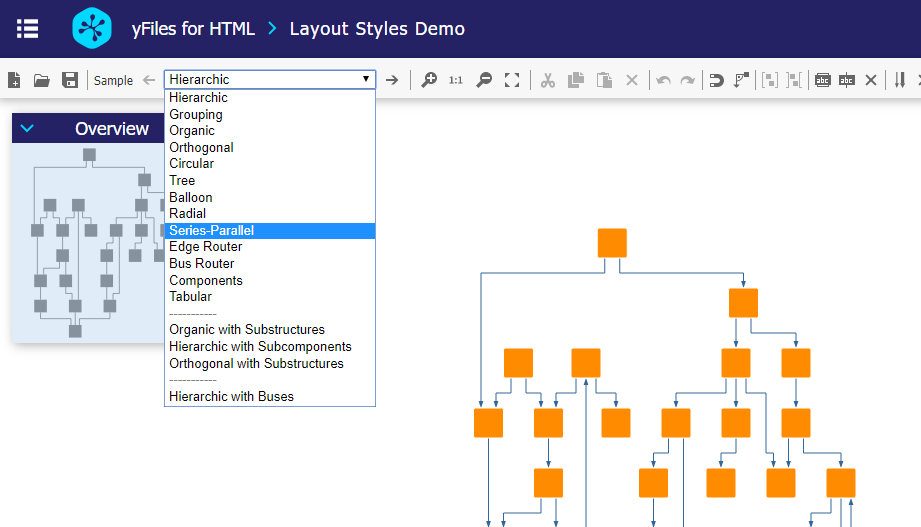
Series-parallel graphs are directed graphs with a single source (node without incoming edges) and a single sink (node without outgoing edges) that are built recursively by series and parallel compositions. Series-parallel Layout highlights the main layout direction, i.e., from source to sink. It also emphasizes the paths through the graph because edges routes contain few bends.
Showcase Application
yFiles comes with a Layout Styles Showcase Application. This example provides an extensive UI for the configuration of yFiles’ graph layout algorithms.
Sample Datasets
Naturally, not every layout style works well for every type of graph. Therefore this demo includes several sample datasets from which to choose. Still, you can layout any of the included sets with an arbitrary layout algorithm. Selecting a sample dataset will automatically apply the recommended layout style for this dataset.
Layout Styles
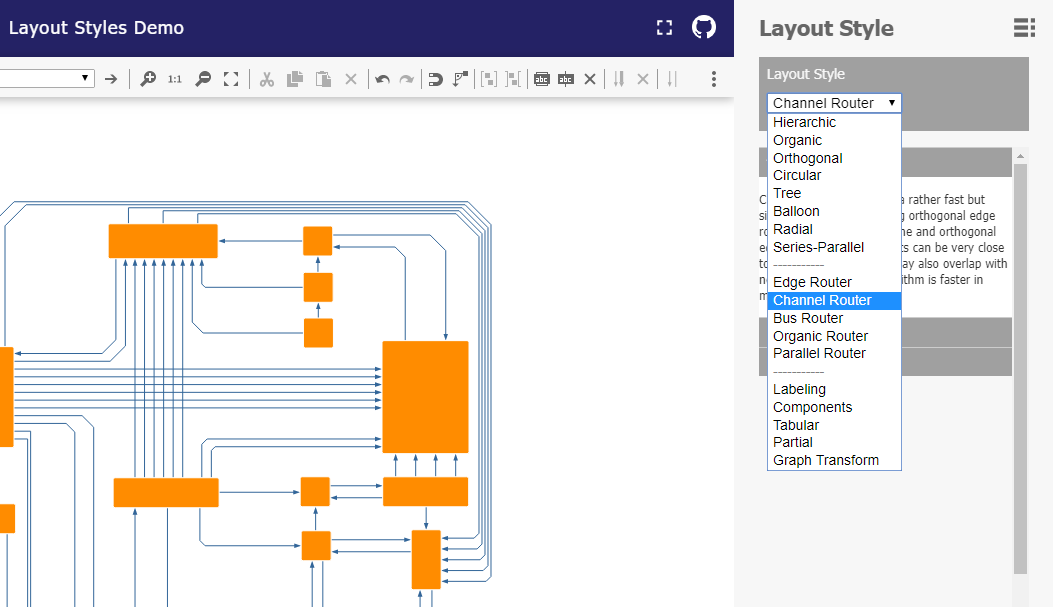
What algorithm you choose typically stems from the type of data you want to visualize. However, you are free to select an arbitrary style from the Layout Style-Dropdown.
Be aware that you could theoretically combine any edge routing algorithm with any node placement algorithm. To explore some unconventional combinations, layout your graph by any algorithm, select one of the routers from the layout styles dropdown, and click apply.
Configuration Options
You will find some preset configuration options of different layout algorithms in the submenus below. Aside from algorithm specific options such as Center Allocation Strategy for radial layouts or Orientation of Main Flow for series-parallel layouts, these typically include some options for labeling and routing. You may want to have your labels oriented along the edge or horizontally for better readability, for example, or adjust the distance from a node — listing all options for all layout styles is beyond the scope of this document.
Source Code
The source code of the Layout Styles Showcase Application is part of all yFiles packages and available on the yWorks GitHub repository:
yFiles Graph Layout Algorithms in Your Own Application
Test the yFiles graph layout algorithms with a fully-functional trial package of yFiles. The yFiles graph layout algorithms work on the standard yFiles graph model and can be used in any yFiles-based project. Configuring and running a layout algorithm requires only a few lines of code.
