
yFiles Layout Algorithms for React Flow
In this comprehensive guide, we explore the integration of yFiles for HTML with React Flow, offering unparalleled customization and access to advanced features for building complex and interactive node-based UIs.
React Flow is a popular open-source library for building interactive graphs and node-based editors in React applications. However, when delving into more advanced features or when intricate layout algorithms are necessary, additional functionality from external libraries is required. The integration of yFiles for HTML brings advanced layout algorithms, extensive customization options, and seamless integration to React Flow projects.
What is yFiles exactly? Well, yFiles for HTML is a commercial programming library explicitly designed for graph, network, and diagram visualization. It stands out with its advanced layout algorithms, rich styling options, and interactive user interactions. Its support for various graph types, including directed, undirected, grouped or hierarchical graphs, along with powerful layout algorithms, enables you to create clear, visually stunning, and highly functional graph visualizations for a wide range of applications.
Whether you are a developer looking to build enterprise-grade applications or innovative data visualization tools, yFiles provides the tools and support needed to bring complex ideas to life with ease. It opens up a world of possibilities for creating applications such as network visualization tools, organizational chart viewers, process flow diagram editors, and supply chain management dashboards.

Introduction to Node-Based UIs and React Flow
Imagine you are part of a software development team working on a complex project with multiple tasks and dependencies. To streamline collaboration and ensure efficient task management, your team decides to develop a custom task management application using React with a node-based UI.
So what do we mean when we talk about a node-based UI?
Node-based UIs refer to user interfaces that are built using a graphical representation of nodes or elements interconnected in a specific structure. In this context, a node typically represents an individual component or data element within the UI, while the connections or edges between nodes represent relationships between them. In cases where we want to organize and see our data, we usually want to opt for a node-based UI. Think of workflow management, data visualization, mind mapping tools, data visualization platforms or content organization.

The React Flow library remains a frequently chosen way to implement node-based UIs in React projects. It refers to a popular open-source library specifically designed for building interactive graphs and node-based editors within React applications, suitable for simple workflow visualization and rapid prototyping.
Overview of React Flow and yFiles
React Flow offers some basic features to edit your graphs, such as dragging nodes, zooming, panning, selecting multiple nodes, and adding/removing elements. Essentially offering you some elementary editing on nodes, edges, layout and interaction.
→ But what if you need more complex graph structures that need to be automatically arranged?
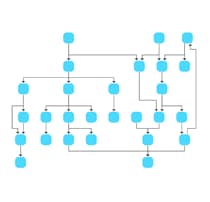
Fortunately, yFiles now has their layout algorithms and extensive customization options available in your React Flow apps. It includes a rich collection of layout algorithms that are optimized for various graph structures and use cases. These algorithms encompass hierarchical, orthogonal, circular, and force-directed layouts, among others. They are designed to efficiently arrange nodes and edges in complex graphs while ensuring optimal readability and aesthetics.
By seamlessly integrating yFiles with React Flow, you can enhance your projects with features like node placement, advanced edge-routing (including support for polyline edges with bends), node/edge label placement and port positioning.

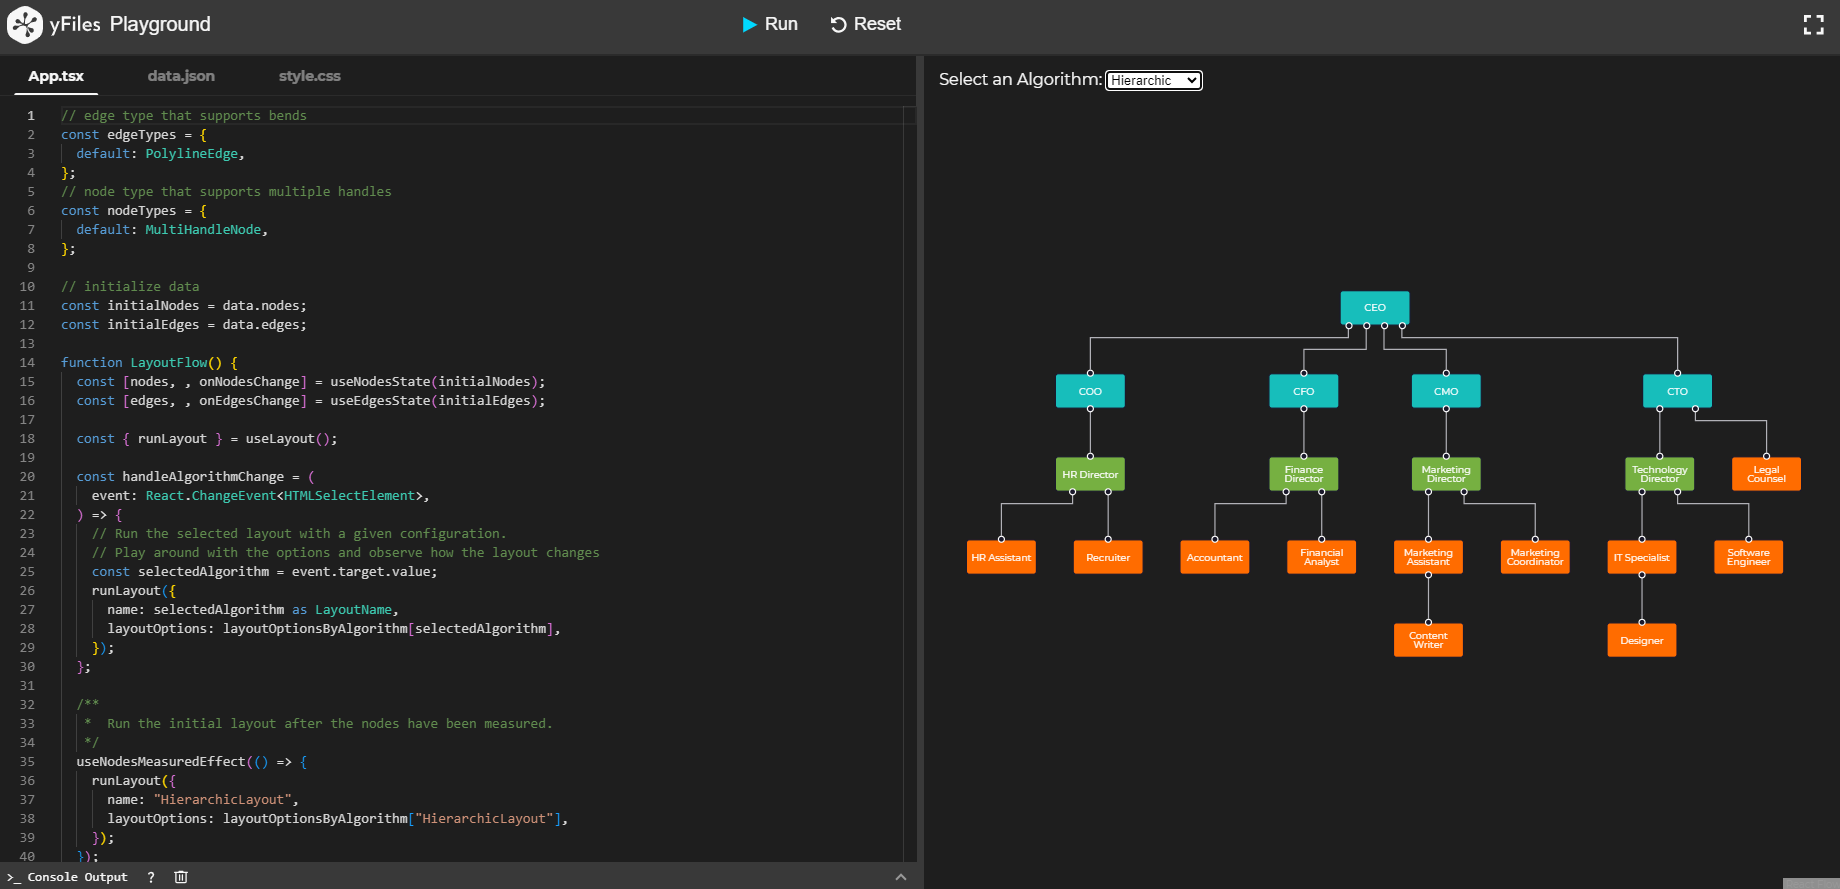
You can explore the major layout styles in this comprehensive demo!
How to integrate yFiles into React Flow projects
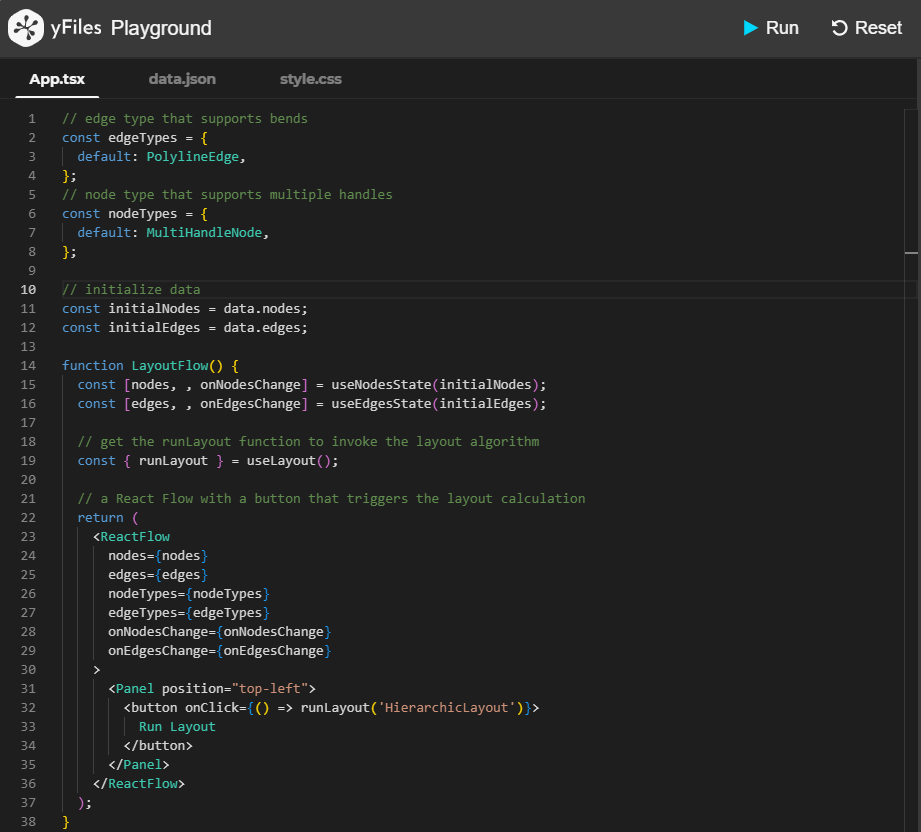
Integrating a layout algorithm in your React Flow application is as easy as this:
yFiles Layout Algorithms for React Flow provides the useLayout-hook that can be called in your React Flow app to return the function that invokes
the configured layout algorithm on the given data. The layout is applied to the current node and edge data within the flow.
const { runLayout } = useLayout()To apply the layout algorithm, you only need to specify its name within the runLayout-method.
runLayout('HierarchicLayout')You can explore the yFiles Layout Algorithms for React Flow through the yFiles Playground, an optimal platform for getting acquainted with the module and its functionalities.
Layout Customization
The useLayout hook serves as the primary interface for integrating yFiles layout algorithms into your React Flow components.
As previously mentioned, to run a layout algorithm the runLayout-method has to be called with the name of
the desired layout algorithm.
Optionally, you can configure the layout algorithm according to your requirements using the available properties of each algorithm. For instance, the layout can be enhanced by providing additional properties such as routing styles, node/edge distances, layout orientation or defining mappings for specific elements like port candidates.
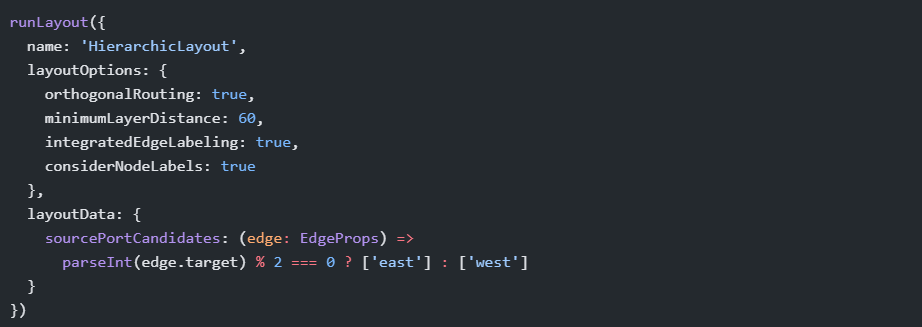
For more information on how to configure a layout algorithm, please refer to the documentation.
Custom Element Types
Certain algorithms, such as hierarchic or orthogonal layout, offer predefined port locations or support polyline edges. Additionally, many of these algorithms facilitate automatic label placement of nodes and edges.
To seamlessly integrate the algorithm results, consider employing for nodes the MultiHandleNode style.
This custom style accommodates multiple handles on a node and a label. If you already have a
custom style, you can enhance it by wrapping it with the withMultiHandles
higher-order component (HOC).
Similarly, for robust support of polyline edge routes, consider incorporating the PolylineEdge style for edges.
For more information on applying custom styles, please refer to the documentation.
Labeling
The yFiles Layout Algorithms for React Flow features support for labeling algorithms, allowing users to place labels on both nodes and edges. Labels can be positioned either by opting for a layout algorithm that inherently allocates space for node/edge labels and positions them accordingly (e.g., HierarchicLayout, OrganicLayout), or by directly applying the GenericLabeling algorithm.
Node labels can be positioned inside or outside the nodes, and they can also be rotated depending on the configuration of the layout algorithm. Similarly, edges can have several labels, and additional information about where to place them can also be given to the layout/labeling algorithm.
For additional details on labeling, please consult the documentation.
Supported Layout Algorithms
In this section, we will introduce the layout algorithms supported by yFiles Layout Algorithms for React Flow, accompanied by concise descriptions.
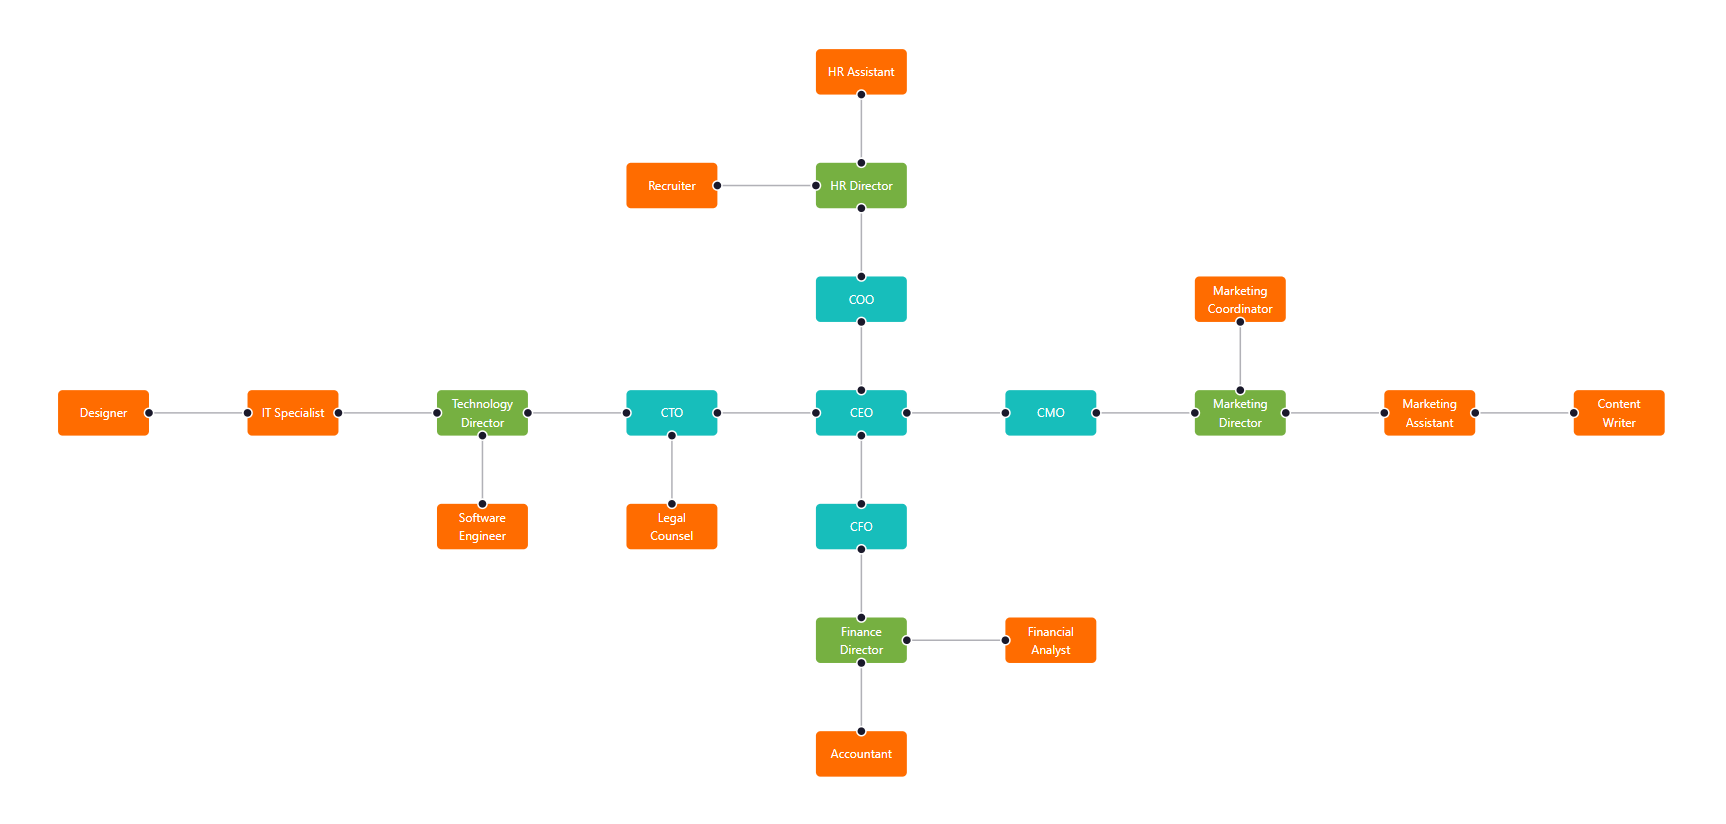
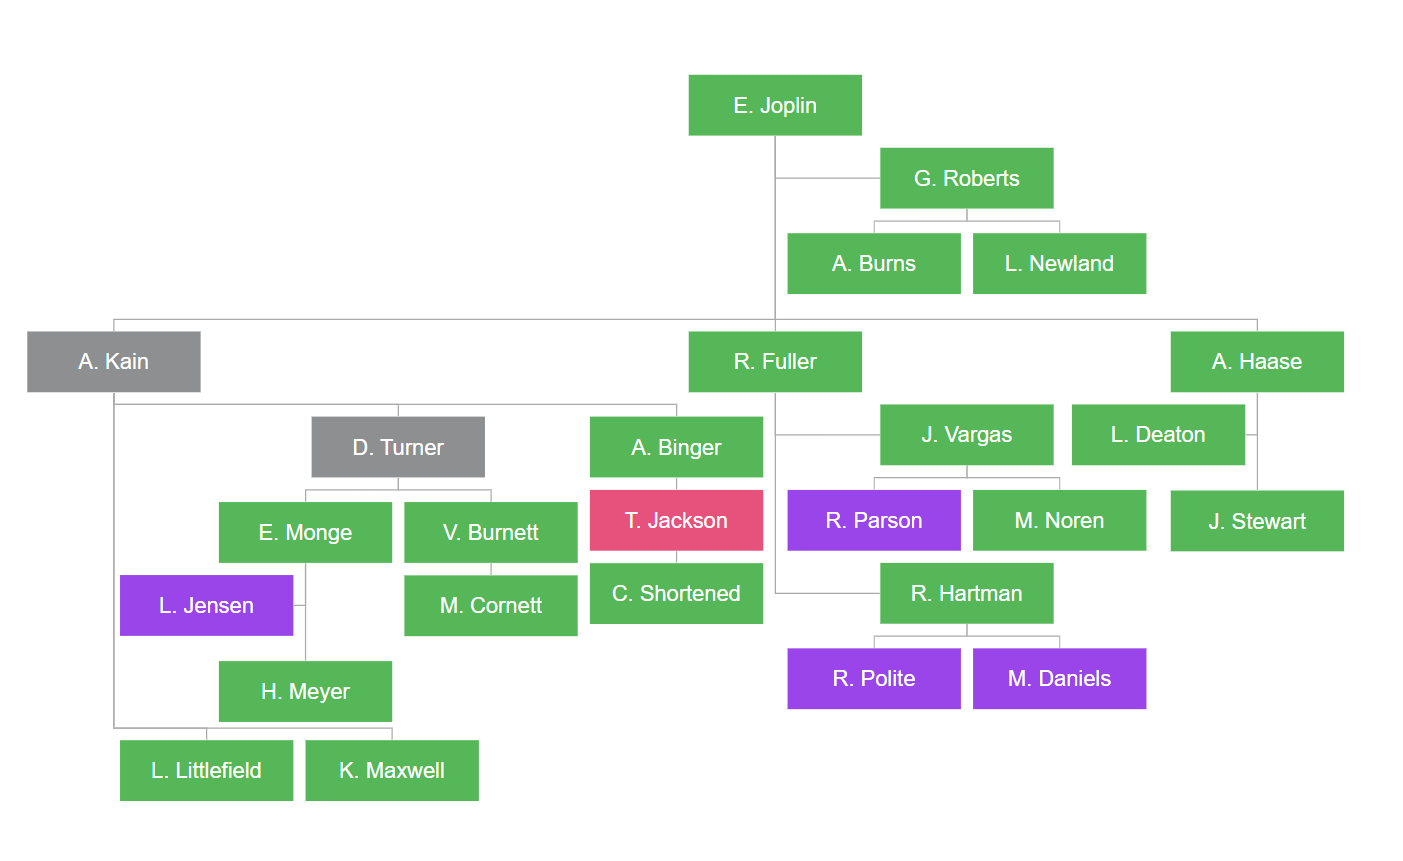
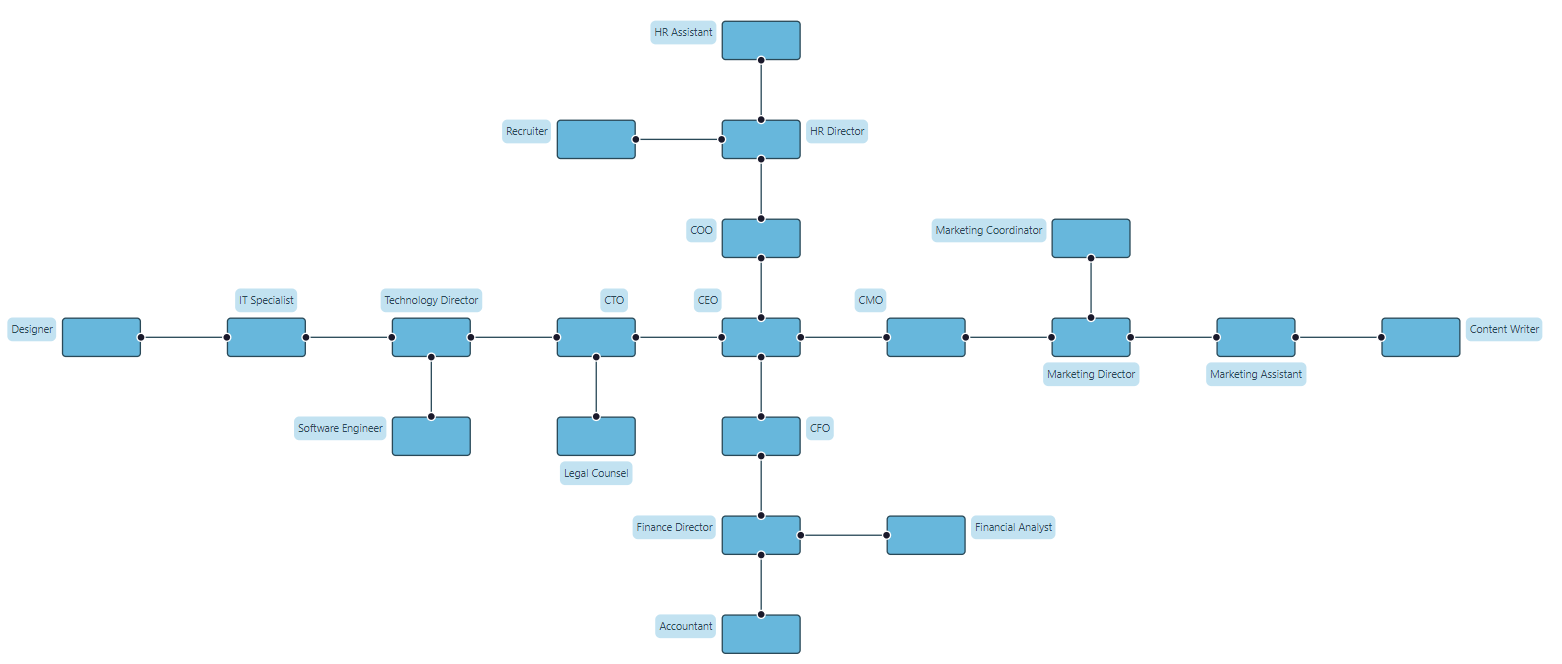
Hierarchic Layout
The hierarchic layout algorithm automatically arranges nodes in a hierarchical structure, ensuring clear visualization and readability. For example, in an organizational chart, hierarchical layout algorithms arrange nodes based on their hierarchical relationships (e.g., manager-subordinate). It offers extensive configuration options such as layout orientation, edge grouping, port candidates, and more.
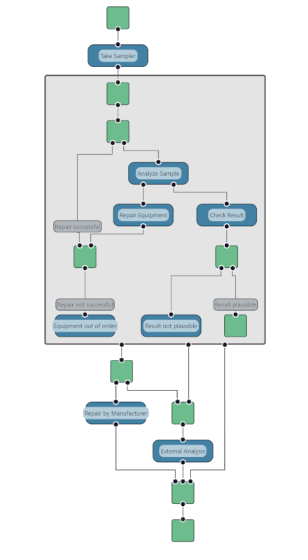
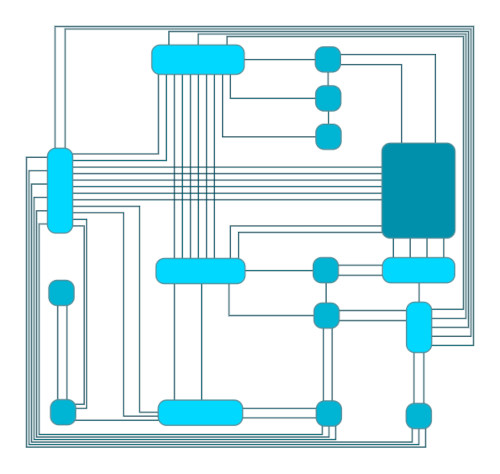
Orthogonal Layout
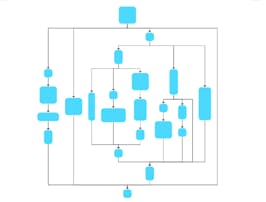
The orthogonal layout algorithm arranges nodes and edges in a grid-like fashion, minimizing edge crossings and maximizing readability. This is particularly useful for circuit diagrams, network diagrams, and other technical illustrations. It empowers users with extensive customization options, enabling the selection of various layout styles, substructure detection, and automatic placement of node and edge labels.
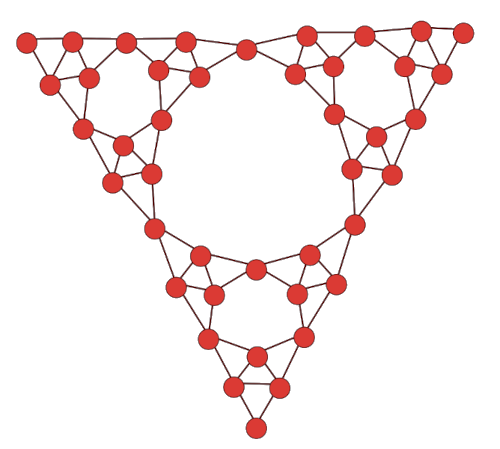
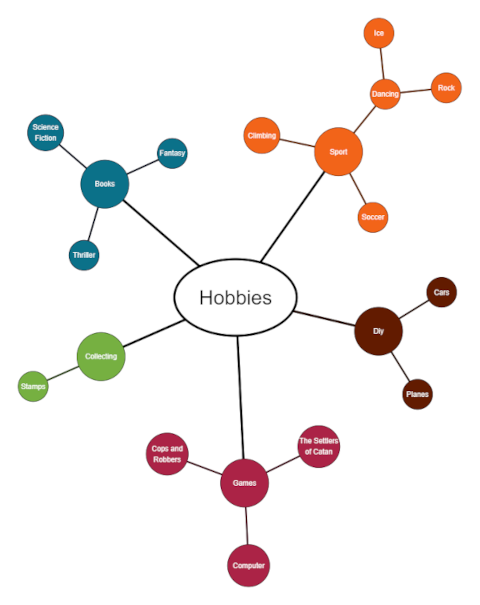
Organic Layout
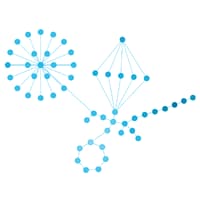
The organic layout algorithm simulates natural forces to arrange nodes in a visually pleasing and organic manner. This results in aesthetically pleasing visualizations that mimic the layout of biological or organic systems, such as neuron networks or chemical structures. The organic layout algorithm offers extensive customization options such as preferred edge lengths, substructure detection and node/edge label placement.
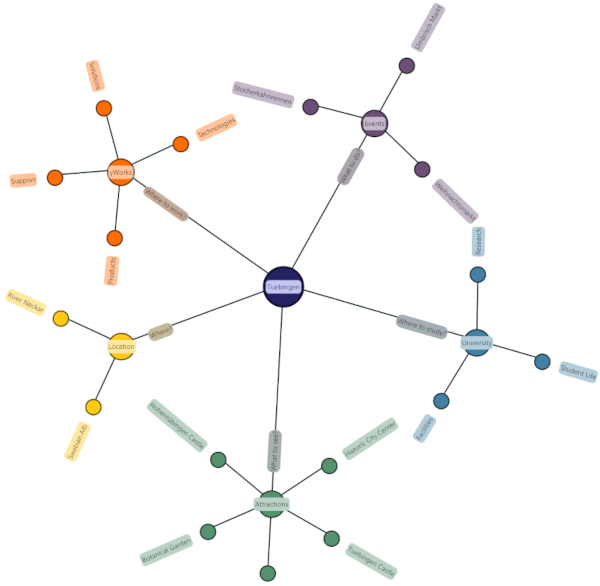
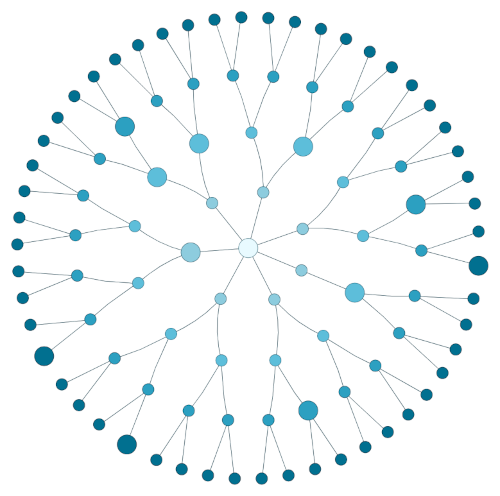
Radial Layout
The radial layout algorithm organizes graphs radially, distributing nodes into concentric circles around a central point using predefined layering strategies, with applications spanning social network visualization, data clustering, and bioinformatics. Several customization options are available including layer spacing, center node policy, and automatic placement of node/edge labels and the option for ray-like positioning for node labels.
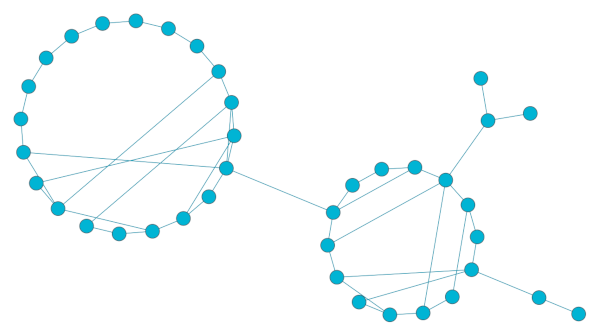
Circular Layout
The circular layout algorithm is tailored to organize nodes in a circular manner, facilitating a distinct visual portrayal of graph relationships. It offers comprehensive customization capabilities, covering diverse layout styles such as separate graph partitions, various edge routing styles, node and edge label placement, including ray-like placement for node labels.
Tree Layout
The tree layout algorithm organizes graphs into tree structures, commonly used in visualizing relational data with applications in various fields. It provides extensive customization options, including custom edge ordering, port assignment, and automatic node/edge label placement.
Balloon Layout
The balloon layout algorithm arranges directed and undirected tree graphs by placing subtrees radially around their root nodes, resembling balloons or stars, especially when subtrees are similar in size. It offers extensive customization options, including children ordering, compactness and node/edge label placement including ray-like placement for node labels.
Edge Router
The edge router algorithm applies polyline routes to graph edges, typically in an orthogonal manner with horizontal and vertical segments. It offers customization applicable to the entire graph or selected edges, without affecting node placement. Additionally, it automatically positions edge labels.
Generic Labeling
The generic labeling algorithm optimally positions nodes and edge labels in a graph to avoid overlap with other elements. It doesn’t alter node positions or edge routes, and supports rotated labels. Node labels can be placed inside or outside nodes, with rotation options, while preferred edge label placement can also be specified. The labeling algorithm can be applied to the entire graph or a specified subset of nodes and edges.
Examples and Source Code
The yFiles Layout Algorithms for React Flow comes with example applications showcasing how to integrate and customize a layout algorithm within a React Flow application. You can find the source code of these applications on the yWorks GitHub repository.
To integrate the yFiles Layout Algorithms for React Flow module in your application, follow these steps:
-
Download the trial version of yFiles for HTML at the yWorks Customer Center.
-
Install the yFiles Layout Algorithms for React Flow module via npm:
npm install @yworks/yfiles-layout-reactflow -
The module has certain peer dependencies that must be installed within your project. Since it is a React module that augments React Flow,
react,react-dom, andreactflowdependencies are needed. -
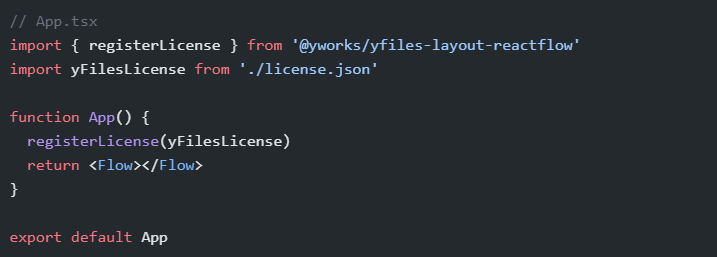
Before using the module, copy the trial license of yFiles for HTML into your project.
-
Utilize the
useLayout-hook in your React Flow application. First invokeregisterLicensein your application. -
For more information on how to use the module, refer to the accompanied documentation.
Experience the full potential of yFiles
If you are tackling complex use cases, seize the opportunity to explore the full potential of yFiles for HTML. Begin by delving into the documentation and trying the evaluation version. Additionally, browse through the online demos for additional insights. Start crafting your own app with yFiles to experience how it can elevate your projects!
You can also take advantage of the App Generator to rapidly prototype your first yFiles application. yWorks' App Generator is a user-friendly tool that quickly creates customized diagramming applications. It simplifies the integration of advanced graph visualization features, enabling developers to build dynamic applications with ease.

Conclusion
Integrating yFiles with React Flow opens up a world of possibilities for building complex and interactive node-based UIs. With advanced layout algorithms, extensive customization options, and seamless integration, yFiles empowers you to create visually stunning and highly functional graph visualizations.
Whether you’re developing network visualization tools, organizational chart viewers, process flow diagram editors, or supply chain management dashboards, yFiles provides the tools and support needed to bring your ideas to life.
While React Flow provides basic layout features and is suitable for simple workflow visualization and rapid prototyping, yFiles offers advanced layout algorithms and extensive customization options for handling complex graph structures and interactive data exploration.
Take the next step and explore the yFiles magic to enjoy the full potential of your graph visualization projects. Dive into the documentation, try out the evaluation version, and start creating influential applications that drive insights and innovation.
Benefits
Let’s recap all the gains you will reap from utilizing yFiles’ extensive capabilities:
- Enhanced Customization
Integrating yFiles with React Flow unlocks advanced customization features, allowing for fine-tuning of graph layouts to suit specific project requirements.
- Access to Advanced Graph Visualization Capabilities
yFiles brings a comprehensive set of graph visualization capabilities, including sophisticated layout algorithms, interactive user interactions, and support for various graph structures, empowering you to create highly interactive and visually appealing graph visualizations within React Flow.
- Rich Feature Set
The integration with yFiles expands React Flow’s feature set with advanced functionalities such as automatic graph layout, edge routing, grouping, and hierarchical structuring, enabling you to tackle complex graph visualization challenges with ease.
- Seamless Integration
The seamless integration between yFiles and React Flow streamlines the development process, allowing you to leverage the strengths of both libraries without significant overhead, resulting in faster development cycles and smoother implementation of graph visualization solutions.
- Improved Performance
By leveraging yFiles' optimized rendering engine and efficient algorithms, the integration with React Flow ensures smooth and responsive graph visualization even with large datasets, enhancing user experience and performance.
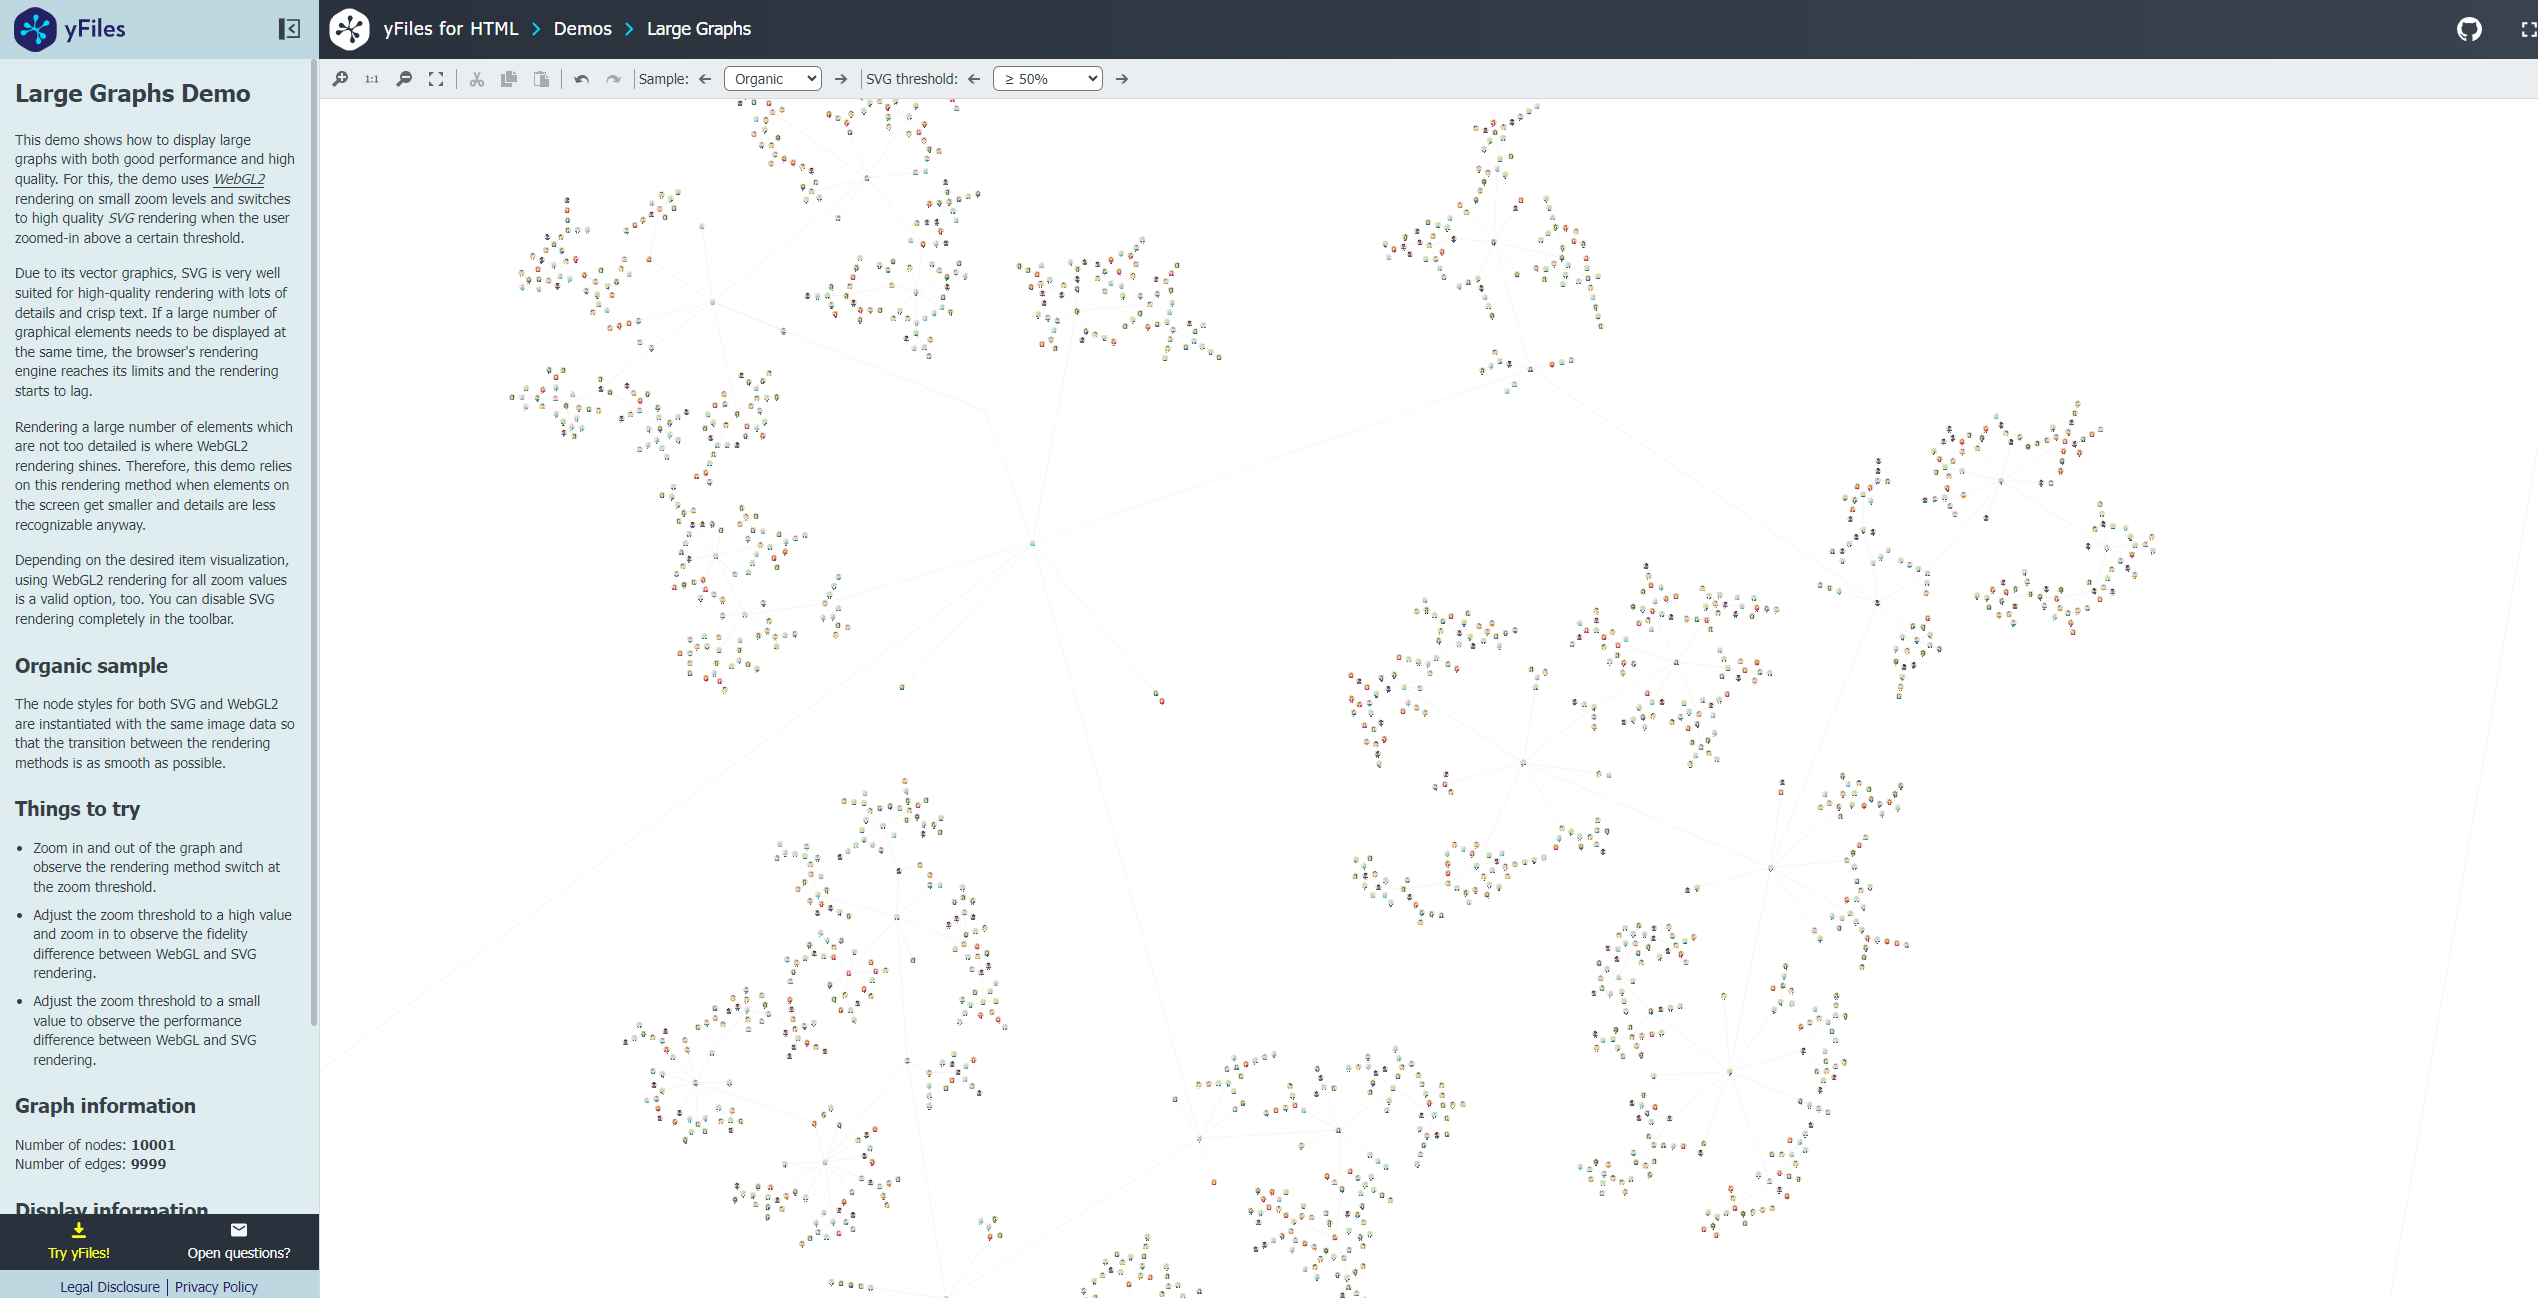
→ Go ahead, try out how yFiles performs with large datasets!
- Cross-Platform Compatibility
Compatible with multiple platforms and languages, yFiles ensures consistency across different environments. Whether web, desktop, or mobile, you can leverage yFiles to create cohesive user experiences.
FAQ
What is yFiles?
yFiles is a leading graph visualization library that offers advanced features, comprehensive capabilities, and seamless integration with various platforms and frameworks. It provides sophisticated layout algorithms, rich styling options, and interactive user interactions for creating visually stunning and highly functional graph visualizations.
What is React Flow?
React Flow is an open-source library designed for building interactive graphs and node-based editors within React applications. It offers basic editing features such as dragging nodes, zooming, panning, selecting multiple nodes, and adding/removing elements.
Why integrate yFiles with React Flow?
Integrating yFiles with React Flow enhances graph visualization capabilities by providing advanced layout algorithms, extensive customization options, and seamless integration. This enables developers to create visually stunning and highly functional node-based UIs tailored to specific application requirements.
What are some benefits of using yFiles for graph visualization?
Some benefits of using yFiles for graph visualization include flexibility, performance, extensive customization options, rich feature set, seamless integration, and support for various graph types. yFiles empowers developers to create visually appealing and interactive graph visualizations for a wide range of applications.
What projects can I implement with yFiles and React Flow integration?
With yFiles and React Flow integration, you can implement various projects such as network visualization tools, organizational chart viewers, process flow diagram editors, supply chain management dashboards, knowledge graph visualization, and more. The combination of advanced features and seamless integration opens up endless possibilities for impactful solutions.
How do I set up a React Flow - yFiles project?
To set up a React Flow - yFiles project, you can follow these steps:
-
Download the trial version of yFiles for HTML at the yWorks Customer Center.
-
Install the yFiles Layout Algorithms for React Flow module via npm:
npm install @yworks/yfiles-layout-reactflow -
The module has certain peer dependencies that must be installed within your project. Since it is a React module that augments React Flow,
react,react-dom, andreactflowdependencies are needed. -
Before using the module, copy the trial license of yFiles for HTML into your project.
-
Utilize the
useLayout-hook in your React Flow application. First invokeregisterLicensein your application. -
For more information on how to use the module, refer to the accompanied documentation.
What are some considerations for integrating yFiles' advanced layout algorithms into React Flow?
Some considerations include evaluating and trialing yFiles, understanding the benefits of integration, installing the NPM module, handling large or complex diagrams, ensuring proper configuration for performance, and exploring available resources for advanced customization.
What are some examples of advanced customization with yFiles?
Advanced customization with yFiles includes options for customizing node appearance, layout algorithms, label placement, port placement, and support for polyline edges. These features allow developers to create visually appealing and highly interactive graph visualizations tailored to specific requirements.
Where can I find resources for learning more about yFiles and React Flow integration?
You can find resources such as documentation and examples on the yFiles website and React Flow documentation.
How can I get started with integrating yFiles and React Flow?
To get started, you can explore the documentation, try out the evaluation version of yFiles, and experiment with sample projects and demos. Additionally, our support team can help you kickstart your integration journey and unlock the full potential of graph visualization projects.