Diagramming for
Business Process Management
with yFiles

Use graph visualization to boost efficiency,
ensure compliance, and increase work quality.

In modern business, as in life, flexibility and individualization are key. To depict and manage your company’s unique processes, developing a customized software solution is highly advantageous. But this requires considerable effort.
Luckily, there’s a great alternative to doing it all yourself: A mature, highly customizable software library of ready-to-use components.

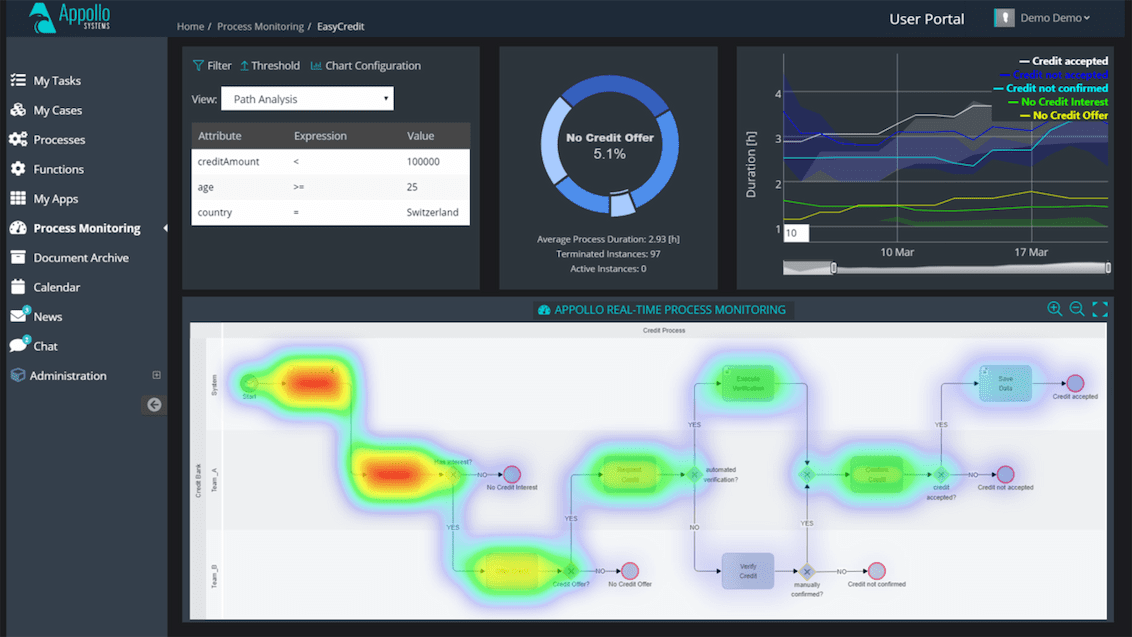
yFiles, our diagramming SDK, lets you create and visualize company processes, then analyze and improve them based on real-time insights. Business process mapping is easy – no clumsy spreadsheets – so you are free to focus on strategic and creative tasks.

Effortlessly create and visualize BPM lifecycle stages with yFiles —from modeling to optimization—empowering strategic decision-making and innovation while ensuring efficiency and clarity.

What to expect on this page

The yFiles diagramming library

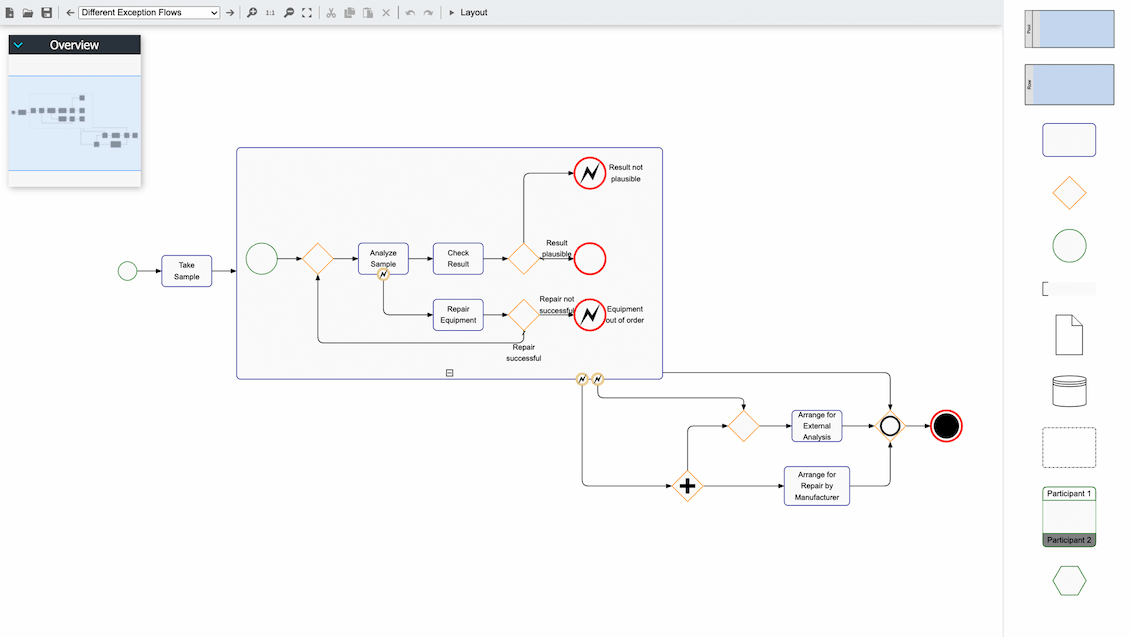
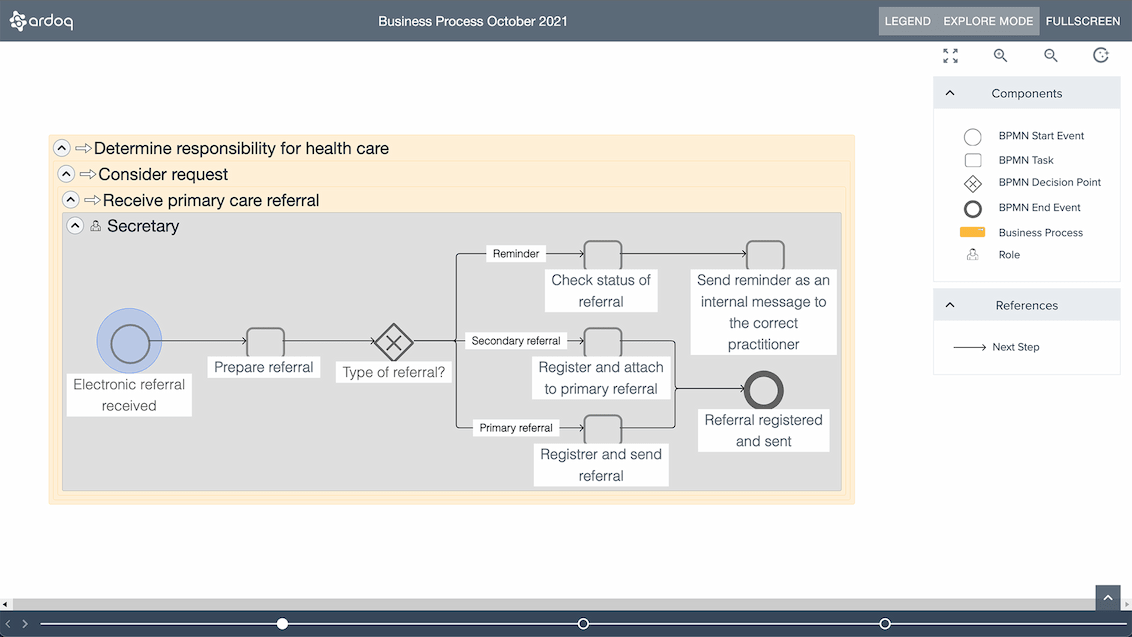
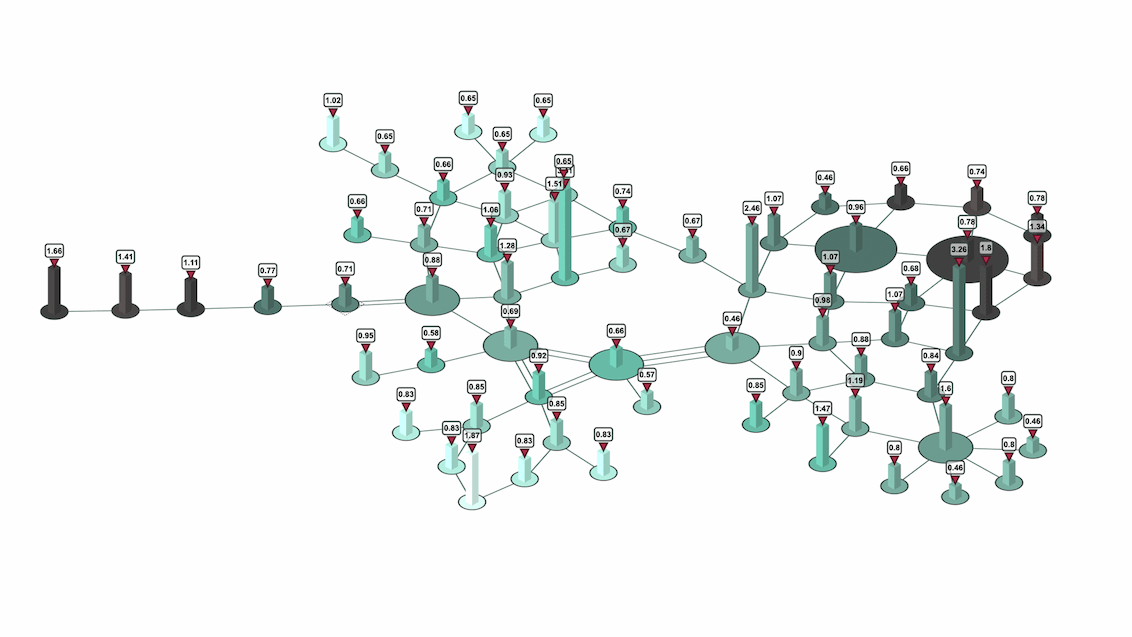
The yFiles SDK is designed explicitly for diagram visualization. Its advanced layout algorithms can comfortably transform your data into readable, informative, and appealing diagrams. Plus, yFiles is much more flexible than a generic graph editor or app: It lets you create tools tailored to your specific requirements. It provides a graph visualization component, graph editor features, and an extensive set of algorithms for automatic data arrangement and graph analysis.

Software developers use yFiles to display, edit, and analyze production processes, decision models, resource utilization, and more. Exporting and importing data is a breeze: yFiles is compatible with every data format and data source and available for every major platform: Web, .NET and Java.

Benefits in a nutshell

The power of yFiles: Automate layouts effortlessly for any use case, enjoy white-label solutions, access extensive source code examples, and receive premium, highly customizable support. Try yFiles for free and unlock advanced diagramming capabilities today.Automatic
layouts
For every use case, yFiles provides a versatile and customizable solution tailored to your specific needs.For every
use case
A white-label represents a product or service that can be fully customized with a company's branding, enabling seamless integration and consistent user experience across different platforms and applications.White
label
Access numerous source code examples that illustrate diverse implementations and applications, ensuring robust development and customization capabilities.Numerous source
code examples
unparalleled support with yFiles' premium service. Gain access to expert guidance and personalized assistance for seamless integration and optimal performance of your diagramming solutions.Premium
support
Tailor every detail of your diagrams to fit your unique needs and preferences, ensuring they align perfectly with your business processes and branding.Highly
customizable

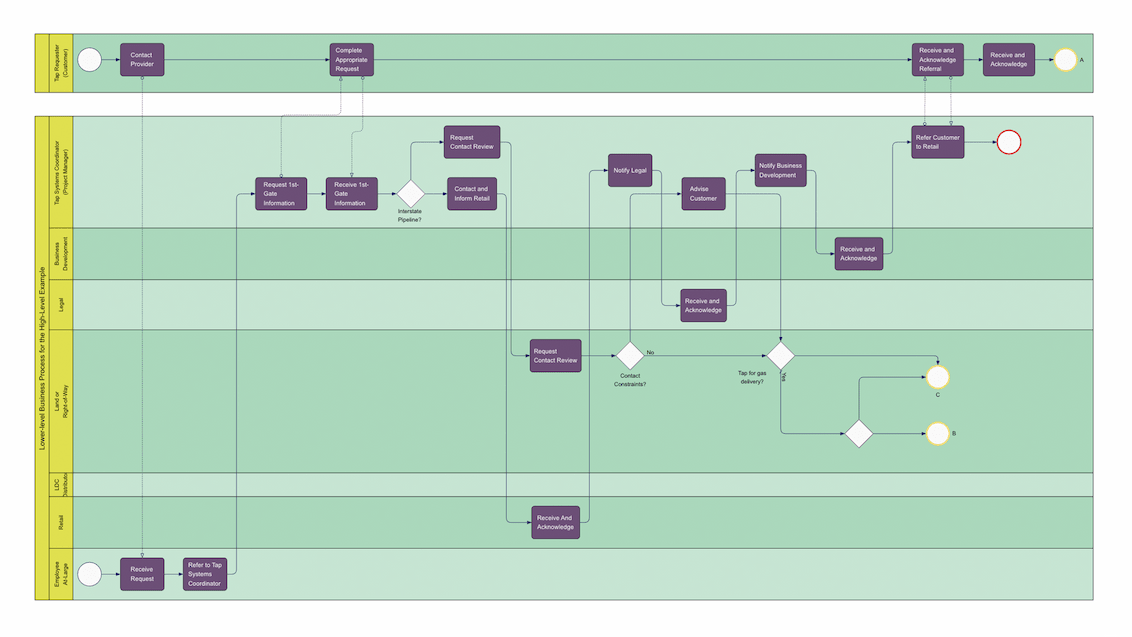
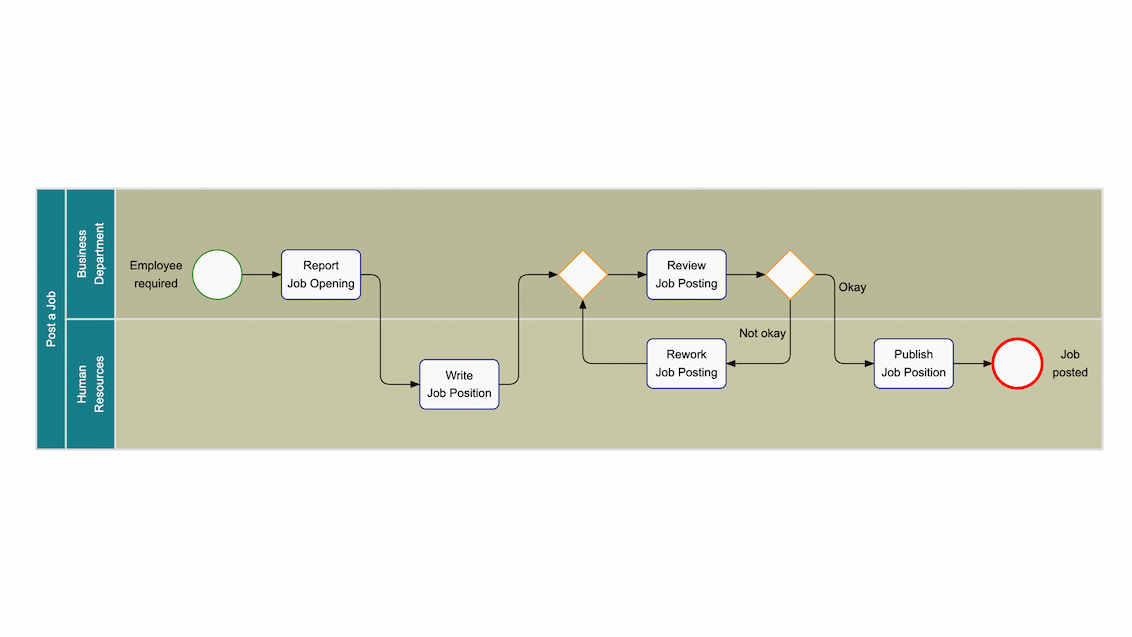
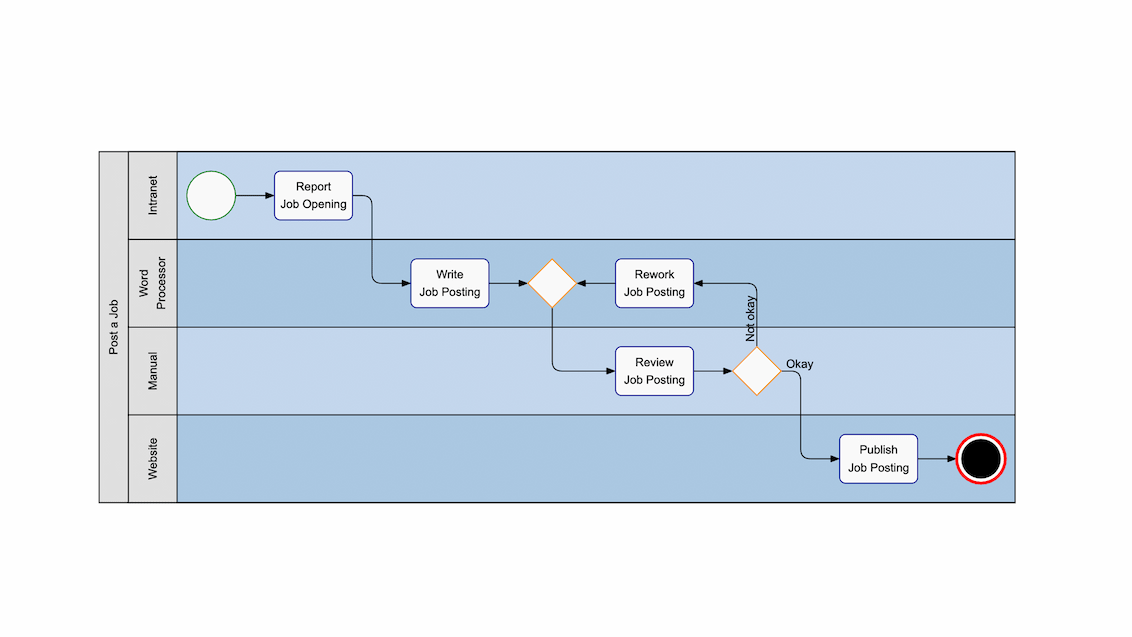
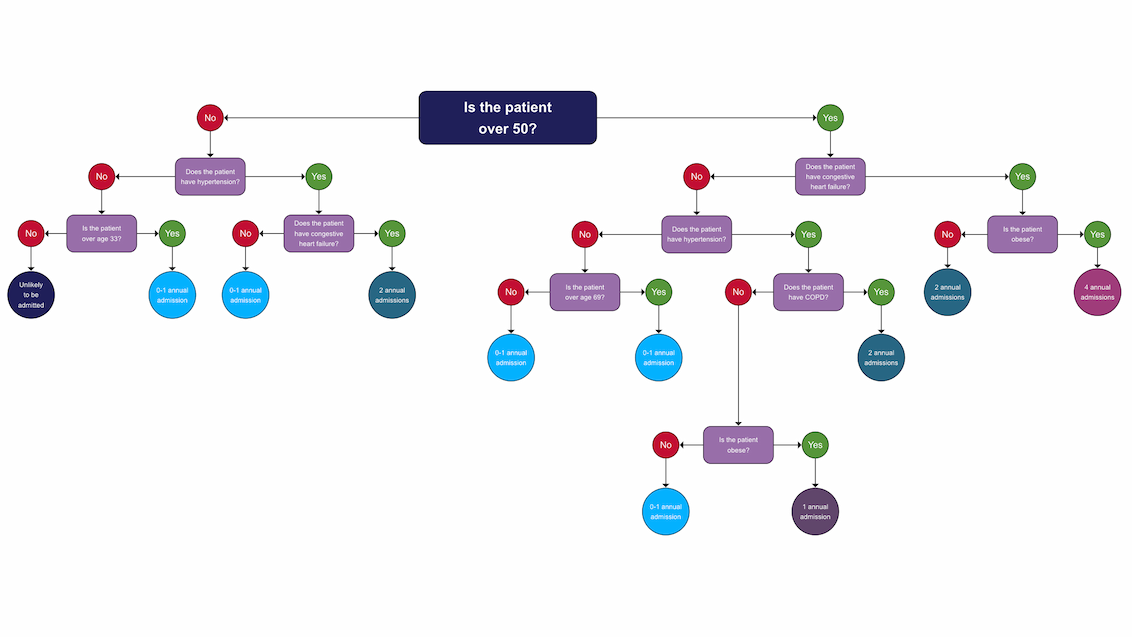
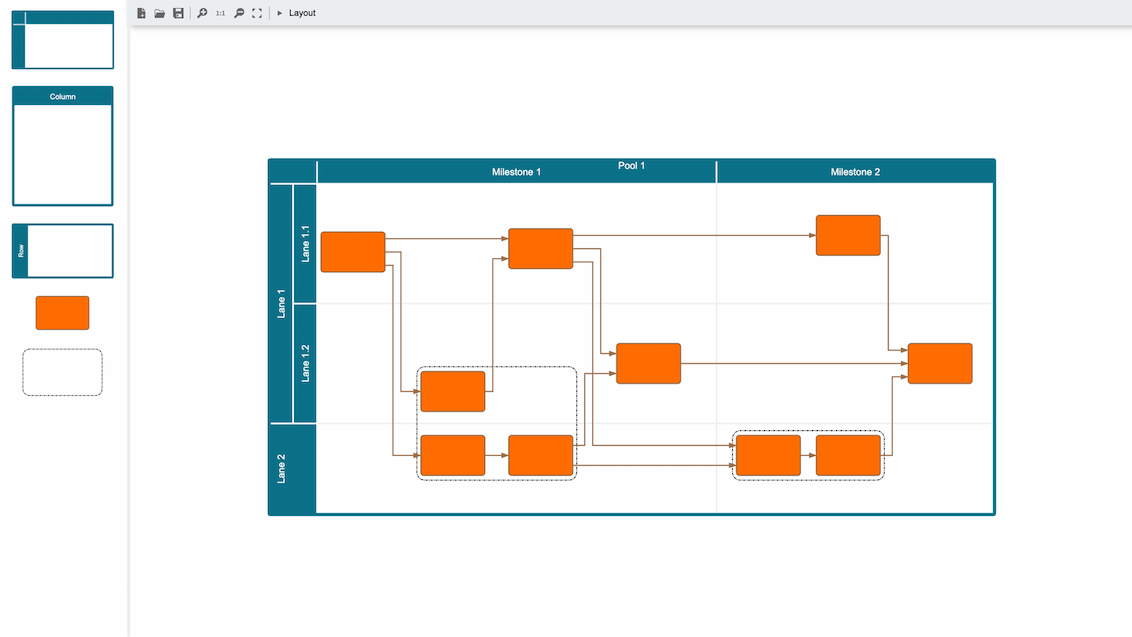
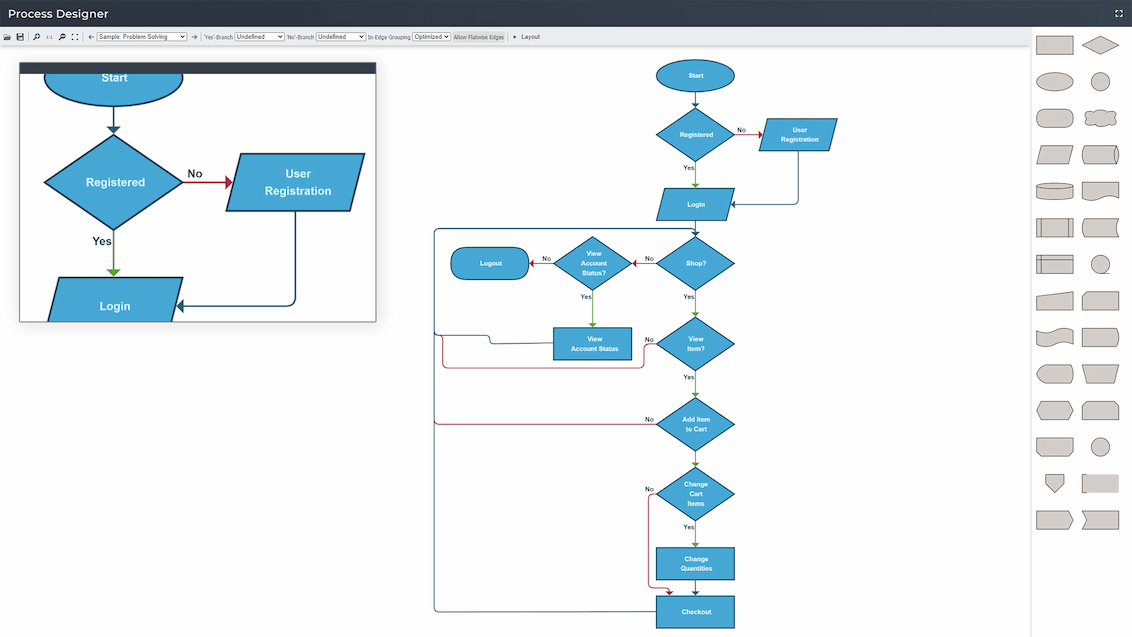
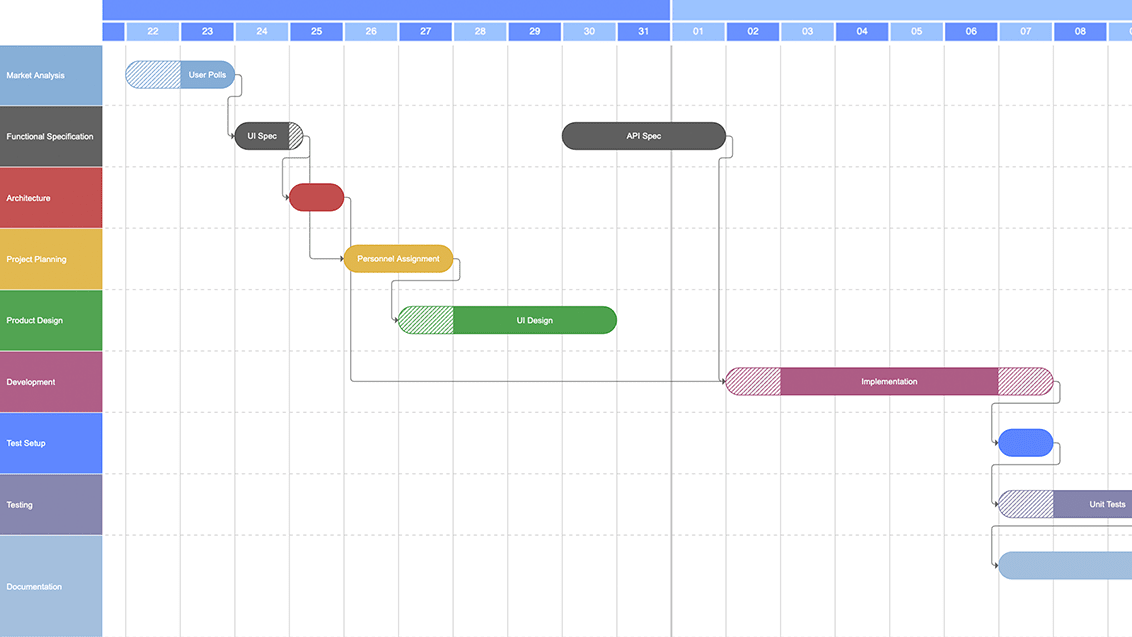
Well-known BPM diagramming models
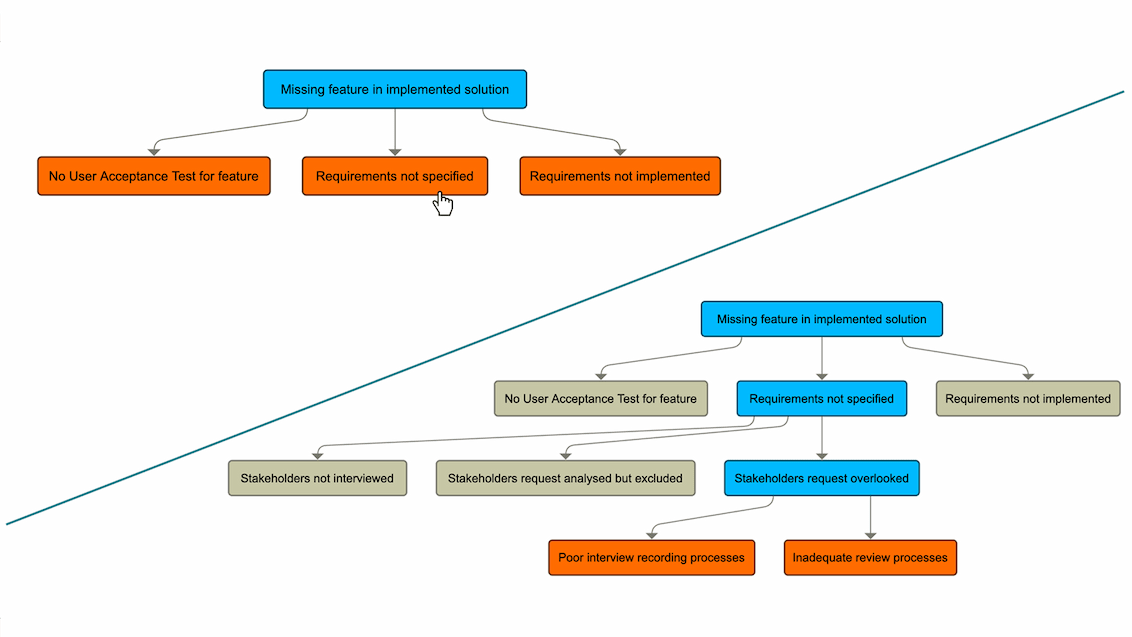
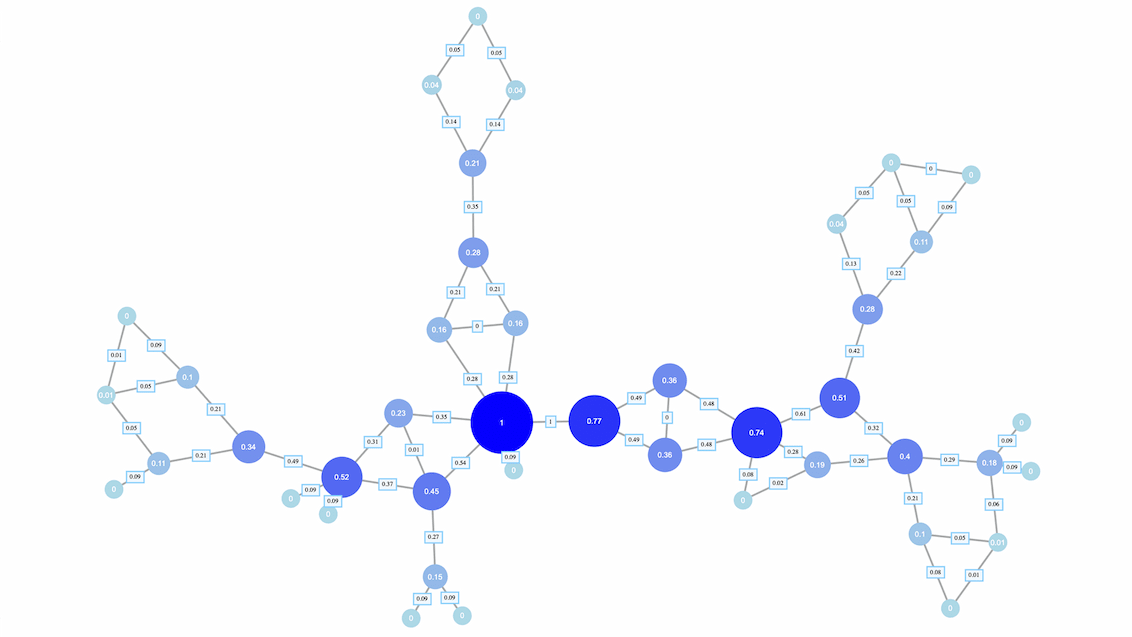
Business Process Model and Notation (BPMN)

With BPMN, both technical and business users can intuitively model complex business processes - so-called collaborations, choreographies, and conversations. BPMN diagrams employ a small number of graphical elements that are easy to understand and remember.

The yFiles diagramming SDK supports the BPMN-DI standard out of the box. You can easily create BPMN tools or components to integrate into your own processes and applications. yFiles represents BPMN without manual work steps, depicts rich nodes, and enables intuitive interactions.

yFiles features efficient, highly customizable algorithms for automatic layouts. The BPMN layout calculates positions for the elements and their connections, creating a clear, clean look. Labels are placed where they are easy to see. With one click, you can create a beautiful BPMN diagram, even from a very confusing list.

This BPMN diagram illustrates a collaboration between a customer and a service-providing company. It features two distinct pools representing each entity, connected by message flows to depict seamless communication and interaction between the two parties.
BPMN diagram that employs two pools: one for the customer and one for the company providing the service. The processes in the pools communicate with each other via message flows.
Explore the Appollo Digital Innovation Platform powered by yFiles, featuring advanced heatmap-based application monitoring and optimization capabilities.
Appollo Digital Innovation Platform – Heatmap-based application monitoring & optimization built with yFiles.
Read the case study. - Source: appollo-systems.com
Experience the robust capabilities of the yFiles BPMN Editor demo—a dynamic tool within the yFiles package. Visualize and interact with BPMN diagrams seamlessly, enhancing process management and optimization with advanced features and intuitive controls.
The interactive BPMN Editor demo is part of the yFiles package.
Visualize your process with yFiles: Build robust, automated BPMN-style diagrams integrated with Ardoq for comprehensive process documentation. Link data for advanced analysis and optimization, ensuring streamlined operations and informed decision-making.
yFiles is used to build an automated diagram representing a process loosely following BPMN. The process documentation captured in Ardoq is linked to other data to analyze and optimize processes. - Source: ardoq.com
Explore a robust BPMN visualization showcasing tasks for a new job posting, elegantly separated into swimlanes by responsible departments.
BPMN visualization showing the tasks of a new job posting separated in swimlanes according to the responsible department.
BPMN visualization showing the tasks of a new job posting separated in swimlanes according to the information system concerned.

Process Mining

The process mining approach is used in all major industries – from banking and insurance, to production and logistics, to transportation and healthcare. This approach seeks to turn event data into insights in order to improve workflows, identify performance issues, or address compliance problems.

A process flow diagram can show the various steps in a processing pipeline, and even how entities move through it. yFiles clearly depicts all processes, using an event log and automatic layout algorithms, so there is no need to manually create diagrams.

The visualization can be customized to focus on aspects of interest – for instance, using a heat map to show capacity limits, outliers or bottlenecks. The yFiles graph analysis algorithms can even identify clusters, shortest paths, cycles, and more.

If the visualization app is linked to real-time data, yFiles lets you monitor or even adapt processes by adjusting the graph. In addition, simulations can be created to test planned changes.

Whether you have a few or tens of thousands of process entities, yFiles is able to render them at the same time in a smooth animation.

Decision Trees

A decision tree is incredibly versatile. It visualizes options and their probable outcomes, thus enabling more informed decisions. It can also be a guide for processes with conditional flow, or a way to trace problems back to their source.
Decision trees can be used in many different areas of an organization, and are an important tool of Business Process Management.
See for yourself: Explore the sample use cases in our slideshow.

yFiles automatically transforms simple graphs into interactive decision trees, so that anyone can click through processes step by step. Company systems can be connected and controlled using a decision tree.
Our layout algorithms clearly display the processes and options, and the integrated analysis algorithms automatically highlight critical paths and best options.
All of this can be customized to your individual requirements.

This decision tree helps to effectively trace problems to their source, enabling corrective actions, identifying weaknesses, and preventing future occurrences.
This decision tree helps to trace problems back to their source in order to correct them, identify weak points and avoid them in the future.
Visualize a decision tree designed for employees of a strong support hotline to guide customers through the problem identification process, ensuring efficient and effective issue resolution.
A decision tree for employees of a support hotline to help customers through the problem identification process.
> Open this graph in yEd Live.
This decision tree illustrates beginning with a clear decision and its available options. Automatically calculated are associated costs, outcome probabilities, and financial results for each path. Optimal choices are highlighted for informed decision-making.
This decision tree starts with the decision to be made and the options that can be taken. The associated costs, outcome probabilities and financial results for each outcome are automatically calculated and the best option ist highlighted.
> Open this graph in yEd Live.
A decision tree visualizes criteria and outcomes to effectively identify patients at high risk for hospital readmission. This graphical representation simplifies complex data into actionable insights, aiding in targeted healthcare interventions.
A decision tree to identify patients at high risk for readmission to the hospital.
> Open this graph in yEd Live.
Explore a decision tree designed to efficiently triage patients experiencing severe pain based on predefined criteria.
A decision tree that helps to triage patients with severe pain according to defined criteria.
> Open this graph in yEd Live.

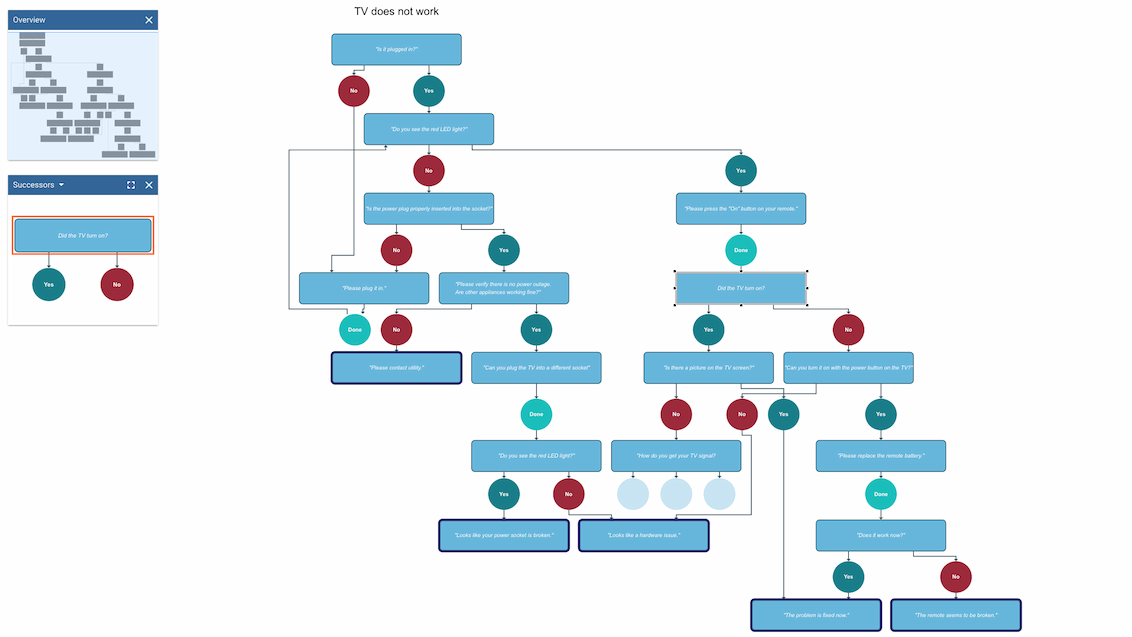
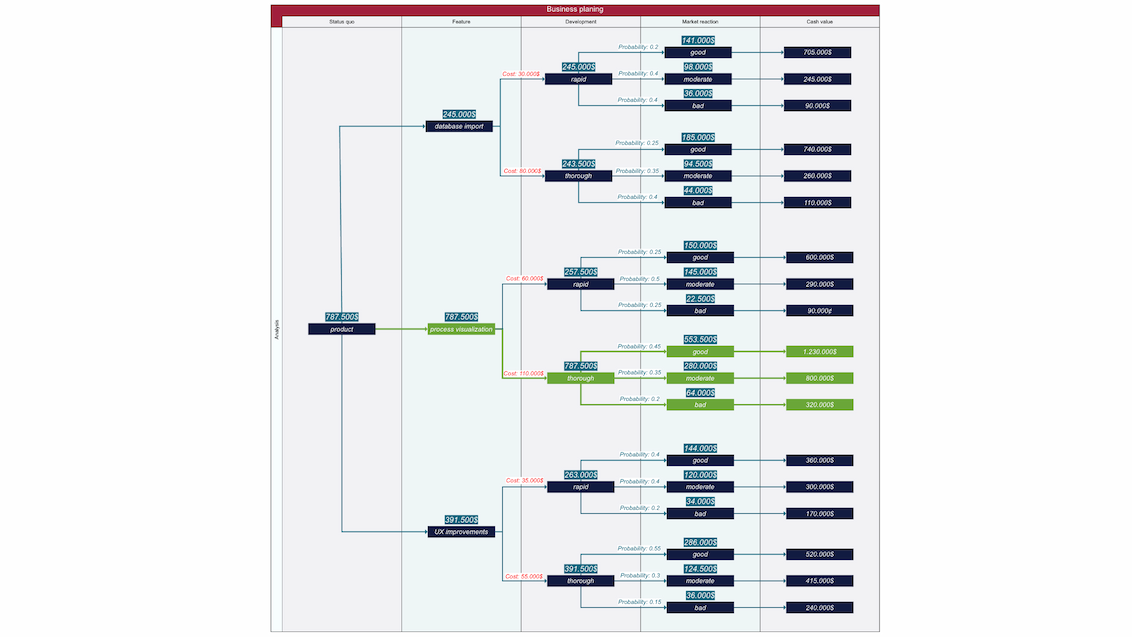
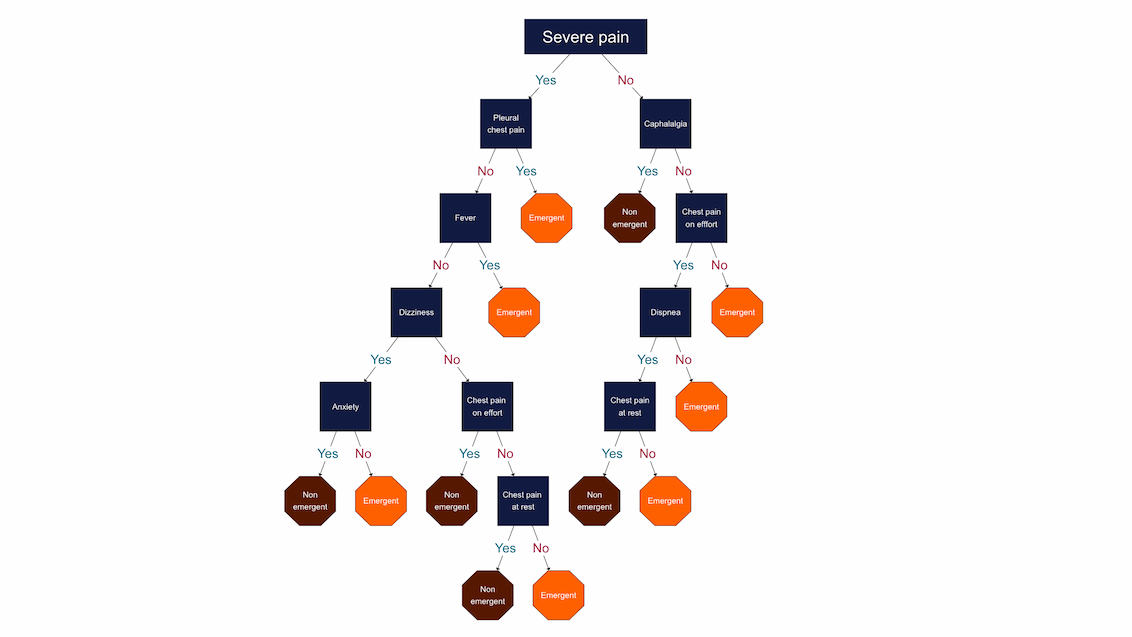
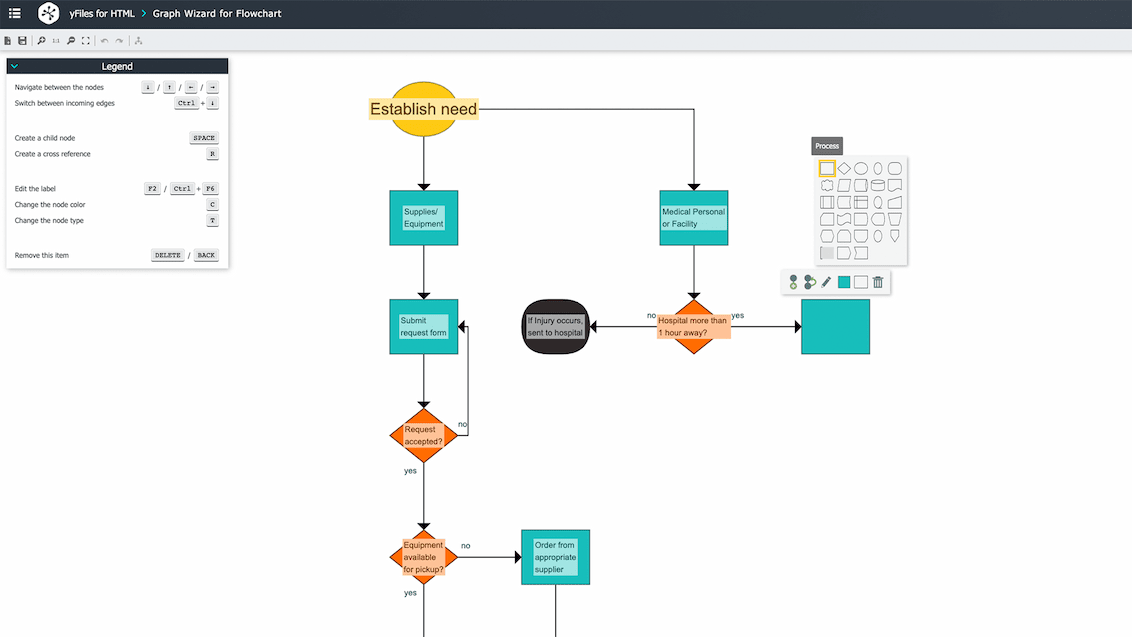
Flowcharts, swimlanes, graph analysis and many more

Of course, there are many other ways to depict, analyze, and improve business processes. Our diagramming SDK supports them all.

yFiles lets you map workflows with flowcharts, make business decisions with the help of decision trees, divide processes into swimlanes, record sequences in a Gantt chart, view material flows in a Sankey diagram, or analyze existing processes automatically.

Below, you’ll find interactive live demos that show some good examples. By the way, the source code for them is included in yFiles – even in the free trial!

The strength of yFiles is that it can be used for any model, method, and scenario. Yes, even the ones we didn’t think of.
Just contact us, and we’ll discuss your use case and how yFiles can help.

The efficiency of this robust flowchart editor is evident, with its intuitive wizard-like interface, enabling rapid visualization and management of workflows with ease.
This Flowchart editor offers a wizard-like interface to visualize workflows in no time.
Advanced graph analysis algorithms to uncover new business insights and opportunities with precision and clarity.
yFiles advanced graph analysis algorithms enable the discovery of new business insights and opportunities.
Augment process visualizations with swimlanes and tables, essential tools that effectively structure information. These elements ensure clarity and organization, making complex processes easier to understand and manage.
Swimlanes and tables help to structure information and are therefore significant for many process visualizations.
Seamless business process visualization with our intuitive drag-and-drop Flowchart editor. Effortlessly create and customize flowcharts to visualize and optimize your business processes with clarity and precision.
A drag and drop Flowchart editor to visualize business processes.
Explore how Timelines and Gantt charts from yFiles empower efficient schedule management and dependency tracking.
Timelines and Gantt charts help to keep track of schedules and dependencies.
yFiles offers advanced graph analysis algorithms. Uncover valuable business insights and opportunities through powerful data analysis and visualization capabilities.
yFiles advanced graph analysis algorithms enable the discovery of new business insights and opportunities.

Did not see your type of diagram?

Ask our Customer Success Team!

We are pretty sure yFiles supports your use case as well!
Just talk to us without obligation!

Email: hello@yworks.com
Phone: +49 7071 9709050
Get in touch
Connect with yWorks' Customer Success Team today! Reach out and discover how yFiles can meet your specific needs with a free trial.

Expertise

Numerous world-renowned companies, research institutes, and universities rely on the versatile possibilities of yFiles.

Top telecom leaders trust yFiles for advanced network visualization and optimization, ensuring superior operational efficiency and service quality.Top tech giants like Microsoft leverage yFiles for advanced data visualization, enhancing process efficiency and decision-making across diverse applicationGoogle leverages yFiles for its versatile data visualization capabilities, supporting various applications.Bosch, a global leader in technology and services, harnesses yFiles for its robust data visualization needs.Samsung also leverages yFiles for advanced data visualization capabilities.

Engineering Design
  • Honda R&D Europe GmbH
  • Mitsubishi Research Institute Inc.
  • Hitachi ULSI Systems Co. Ltd.
  • Enterprise Business
  • BusinessCoDe GmbH
  • Corizon
  • Dirig Software Inc.
  • Information Technology
  • Dell Inc.
  • Hewlett Packard
  • Siemens
  • Life Sciences
  • Procter & Gamble
  • Biovista
  • Sankyo Co., Ltd.
  • Networking & Telecommunications
  • Deutsche Telekom AG
  • British Telecommunications plc
  • Netcracker Technology
  • Financial Services
  • ANZ National Bank Limited
  • Edge IPK
  • Sterci SA
  • Risk Management & Security
  • Netmap Analytics
  • Symantec Corporation
  • e-Security Inc.
  • Software Engineering
  • JetBrains
  • Headway Software
  • No Magic Inc.
  • Healthcare
  • Rapport Network CIC
  • Academic Research
  • Massachusetts Institute of Technology
  • Technische Universität München
  • Fraunhofer IPA
  • Case studies

    Test and experience yFiles
    free of charge!
    Free support, to help you get started easily
    Fully functional version of yFiles
    Source code examples for rapid prototyping

    Start your journey here
    – with the diagramming experts

    Our team is happy to advise you – no strings attached. Let's talk about your project and find the perfect solution for your needs!

    E-mail: hello@yworks.com

    The data you enter will only be used to contact you regarding your request.
    Learn more in our privacy policy.