Neo4j is great for storing and processing large amounts of connected data. For example, in web analytics, where click-paths and custom events get logged, it is easy to get that data into Neo4j. Once the data is in the graph database, complex queries may be executed that help both site administrators and site owners get a good understanding of how their users and visitors use the website or ecommerce store.
Sure, the results are used to improve the predictions of recommendation engines. Gut with that knowledge, shop architects can also then optimize the structure of their sites and further optimize customer experiences.
However, one aspect that is often overlooked is how the visualization of graphs helps in understanding the query results and the automatic decisions of recommendation engines, as well as in planning for optimizations of customer journeys.
The Neo4j browser is an invaluable tool for experimenting with Cypher queries and refactoring the schema of your database contents. The developer tool also comes with a visualization component that displays query results in a graphical manner.
The simple, low-level interface is great for developers, but less technically inclined end-users prefer less-generic, highly-customized solutions that suit the exact requirements of their specific use-cases.
There are several aspects that need to be considered to get the most out of data visualization and the best end-user experience:
Rich Visualization
Being able to visualize connected items and their properties in diagrams helps a lot in understanding the data and processes. For the best user-experience rich element visualizations should be used.
Many generic solutions provide a master/detail view of the graph, where mainly the structure of the visualization is presented in one part of the screen. The details behind each of the elements are seen in a separate, mostly textual detail window beside the main visualization.
This quickly becomes difficult to use once the diagram is explored in more detail. Users have to manually select each of the elements one by one to find more information about the element. Exporting such a diagram for reports becomes almost impossible, because the detail information is missing from the visualization or is only available for a single element.
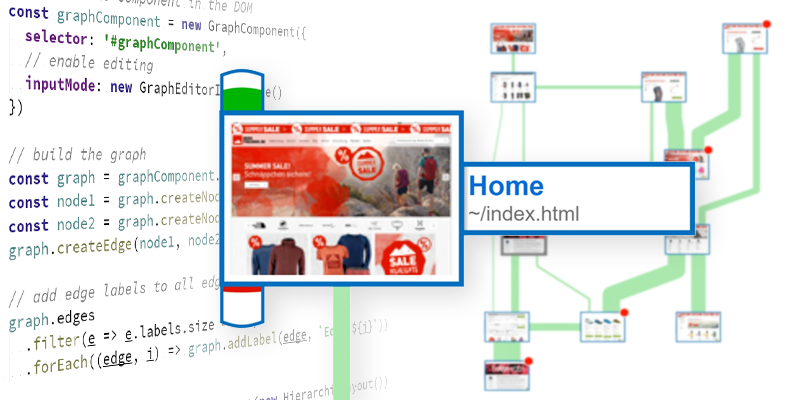
With rich item visualizations, more information can be put into the diagram and included in the visualization for every element on the screen or later in the report.
For example, in a customer journey diagram, not only the name or ID of the page could be shown in the visualization, but also numeric data like “time spent on page,” “drop-off-rate,” “average page value” and “number of visitors.”
These values can be added to the visualization of each element. They don’t need to be represented as naked numbers either, but data can be implemented via color-coding, gauges, level-meters, varying sizes and so on.
Of course, auxiliary textual data is displayed just as well as one or more badges that indicate a certain state of the page or event (“high-performer,” “needs-attention,” “data-anomaly”). These techniques result in drastic improvements in the user experience.
Just like in Neo4j, where different node labels depict a different type of entity in the database, the visualization should make it easy for the user to tell the difference between the different kinds of elements. Not all elements need to follow the same visualization scheme. Instead, the visualization should make it easy for the user to recognize which types of elements are visualized.
Sometimes there is a problem with having many details shown inside the visualization: If the number of elements in the diagram or on the screen gets large – if the user needs to zoom out of the diagram to understand the bigger picture – that additional information can become distracting and make the graph impossible to decipher.
In this case, sophisticated visualization solutions can use a technique called “level of detail rendering.” Depending on the number of elements on the screen, or the zoom level, element visualizations of varying detail can be employed.
Once the user zooms into the diagram, more information becomes visible. If the visualization permits, switching between those levels can be animated, resulting in smooth transitions between the various levels of detail.
Arranging Elements Meaningfully
Another aspect to diagram visualization, that’s just as important as how to render the elements on the screen, is where to place those elements. For many applications, the location of the elements in the diagram can encode additional information for the user right into the visualization. Simple solutions only try to reduce the distance between elements that are interconnected by relations.
More advanced placement algorithms can encode additional information into the layout of the diagram. That information could be importance or a total ordering of elements. More important elements could be rendered on top of the drawing. Or, if there is a flow of data or goods, a common main direction of the connections in the diagram helps a lot in understanding the flow through the data.
But there are more subtle things than flow and order. Alignment and different connection routing styles help just the same – not all relationships must be visualized by an arrow pointing from one element to another. Especially for hierarchically nested structures and relationships, using container visualizations or partitions in the background often are the better choice and lead to less cluttered, more enjoyable diagrams.
Sometimes there isn’t a single aspect or layout that suits the application domain, and sometimes the diagrams’ contents change over time.
For these scenarios, it’s important to have versatile layout algorithms, as well as smooth transitions between the various visualizations. The latter helps the users keep their mental maps of the diagram data. Watching the animations is a pleasure, too.
Interaction and Animation
Finally, interactivity is king when it comes to complex visualizations. If you can give the user the option to interact with the visualization, they will not only enjoy navigating and exploring the database; they will be able to do this a lot more efficiently, too.
This is not just about being able to pan the drawing area. Even for the simple use-case of exploration, things like mouse-hovers, highlights, tool-tips and context menus, contextual filters, guided view port animations, etc. can improve the user-experience dramatically.
A Perfect Match: Neo4j and yFiles
Neo4j is the right tool to store and query your data, and the built-in browser is great for developers.
For end-user facing applications, more elaborate visualization solutions should be used. For connected data, the graph visualization library yFiles is a perfect match, since it provides all the possibilities described above.
Here’s how yFiles is employed in the above scenarios:
- With yFiles, you don’t need to just render the raw data in the database. With software-defined mappings you can show more useful abstractions of the data stored in Neo4j.
- Create perfect item visualizations, specific to the data that will be displayed on the screen. Level of detail rendering and custom reactive displays of the data result in easy-to-understand-and-follow diagrams and visualizations.
- With the right layout, the structure of the data and their dependencies and relationships can be highlighted. Clever edge-routing and labeling algorithms ensure that no information is hidden behind other items. This removes the need for the user to manually untangle the diagram. The yFiles library comes with the most complete set of diverse automatic layout algorithms for you to play with and choose from.
- Interactions and built-in animations help the user understand and navigate the diagram more easily and increase the user-experience.
- You can add user interactions and the ability to edit both the structure and the properties of the diagram. Let interactions trigger updates in the Neo4j database or in external systems.
- Embed the visualizations into new or existing end-user applications as a white-label solution. Create standalone applications or integrate the functionality into larger dashboards and tools.
It is important to understand that yFiles is much more than an off-the-shelf application with only limited customization options. yFiles is a powerful tool for developers to create applications that meet even the most advanced requirements.
Explore the demos and download yFiles today and enjoy the endless possibilities you get when combining it with the power of graph databases like Neo4j.
Happy diagramming!