Recently we have started working on the visualization of SBGN process description maps. SBGN stands for Systems Biology Graphical Notation and is an effort to provide a standardized graphical notation for molecular and system-biology applications that describe biological pathways/networks. Pathways are modeled as abstract graphs and, thus, we can apply our yFiles diagramming library for their visualization. Visualization facilitates the communication of complex information and, thus, is especially useful for such applications with their huge amount of structured data.
SBGN defines three different visual languages and the Process Description (PD) language is one of them. It is used for the visualization of the temporal courses of biochemical interactions and originates from a graphical notation system proposed by Kitano in 2005. It is, for example used in the CellDesigner tool, a modeling tool for biochemical networks. There are several large databases for pathways that use such a visual representation like the Reactome and Panther database.
While some of the databases already contain pathways with layout information (i.e. coordinates of the elements), the majority of them doesn’t. Furthermore, most of the diagrams with layout information were drawn manually. While such manually drawn diagrams are often of good quality, the creation of such diagrams is very time consuming. The demand of sophisticated automatic layout algorithms, the huge amount of available data as well as the increasing importance of system-biology in the last decades makes this field an interesting topic for us.
Drawing Pathways in yEd
We have integrated a new palette section into our free graph editor yEd that provides specific elements/glyphs required to draw SBGN process description maps. After manually creating a pathway, users can utilize the various cutting-edge layout algorithms provided by yEd to automatically create appealing layout results.
The most suitable algorithms for pathways are the force-directed approach (called “Organic” in yEd), the hierarchical layout approach (called “Hierarchical” in yEd) as well as the orthogonal layout approach (called “Classic Orthogonal” in yEd). The force-directed approach distributes nodes in a natural way and uses straight-line edge routes. The hierarchical layout approach (also known as layered or Sugiyama-style layout approach) places the nodes in different layers such that the edges point in a common, user-specified layout direction and, thus, emphasize the natural flow of information. Compared to force-directed approaches, the hierarchical layout approach uses polyline/orthogonal edge routes and never produces overlaps between elements. The orthogonal layout algorithm is based on the "topology-shape-metrics" approach and usually produces drawings with few bends and crossings using orthogonal edge routes. It is especially suitable for smaller pathways with low density (i.e., edge/node ratio).
Besides providing sophisticated layout algorithms, yEd also assists users in making further manual adjustments to their diagrams. For this it offers several tools like snap lines, grid snapping and routing of a subset of edges.
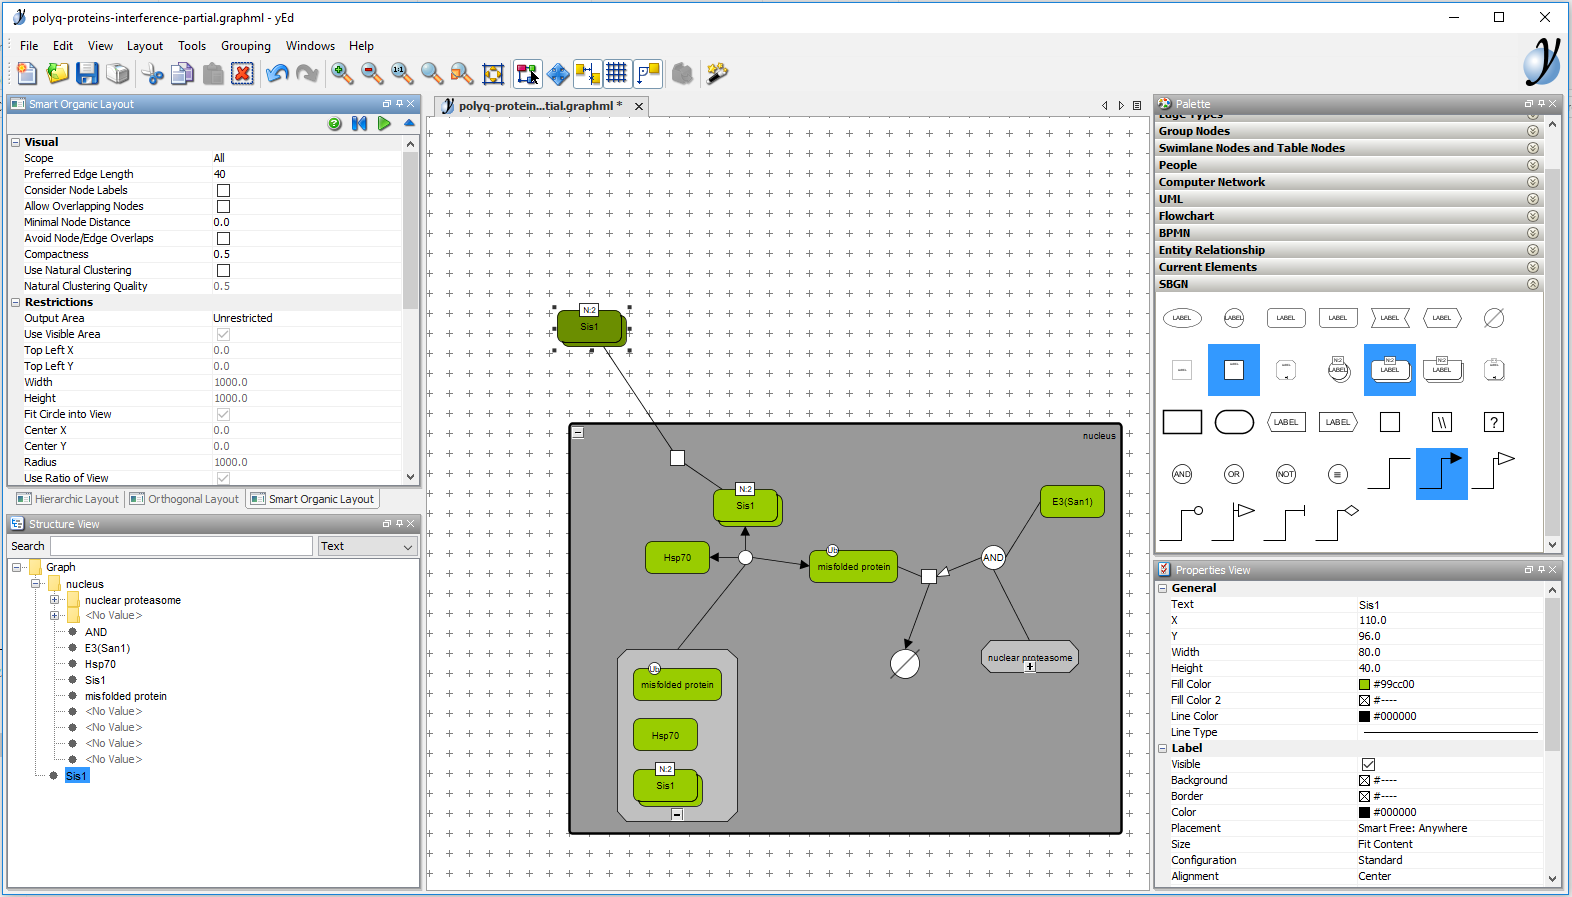
Creating a pathway with yEd. The middle part shows the editor window and the upper right part the SBGN palette containing all the glyphs required to draw process description maps.
Applying a Custom Layout Algorithm to Pathways
While the mentioned state-of-the-art layout algorithms of yEd already produce suitable results, we have also implemented a customized algorithm that is based on the orthogonal layout algorithm and, in addition, uses a packing algorithm for groups that only contain separated (disconnected) nodes. This is required to produce more suitable results for SBGN complex nodes that represent biochemical entities which are recursively composed of other entities and do not contain any edges. With our yFiles library, the library on which yEd is based on, we were able to realize the required modifications within a short time period. Below there are some examples that were automatically laid-out by our modified layout algorithm and show that it is able to produce very nice results for such smaller diagrams. There are also some more specific requirements that are currently not supported by this algorithm, like, e.g., process nodes where the production and consumption arcs should connect to opposite sides as well as the accentuation of important cycles of pathways. Both topics could be approached in future enhancements.
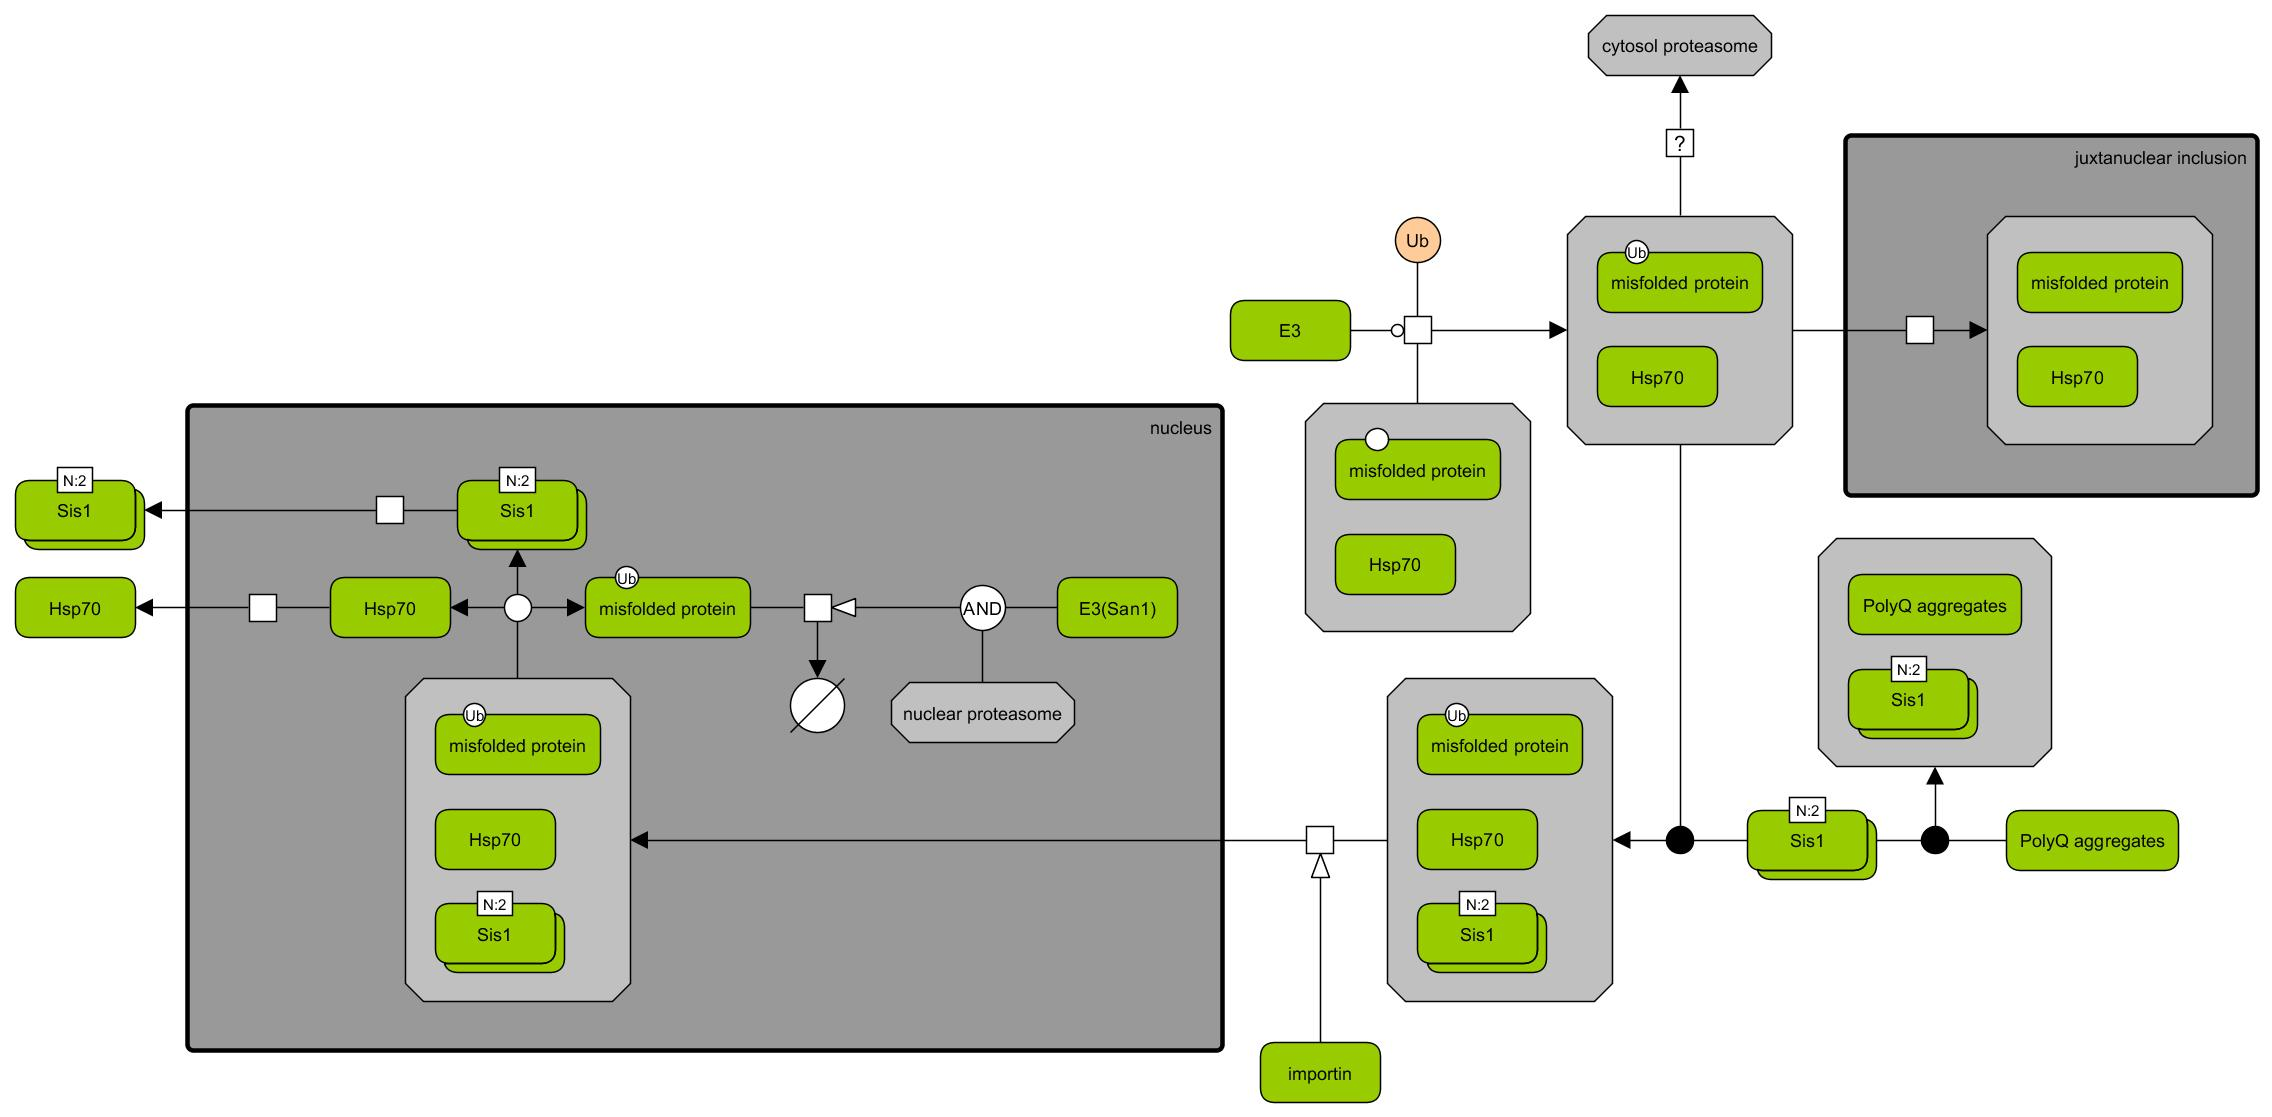
Polyglutamine (polyQ) proteins interference pathway
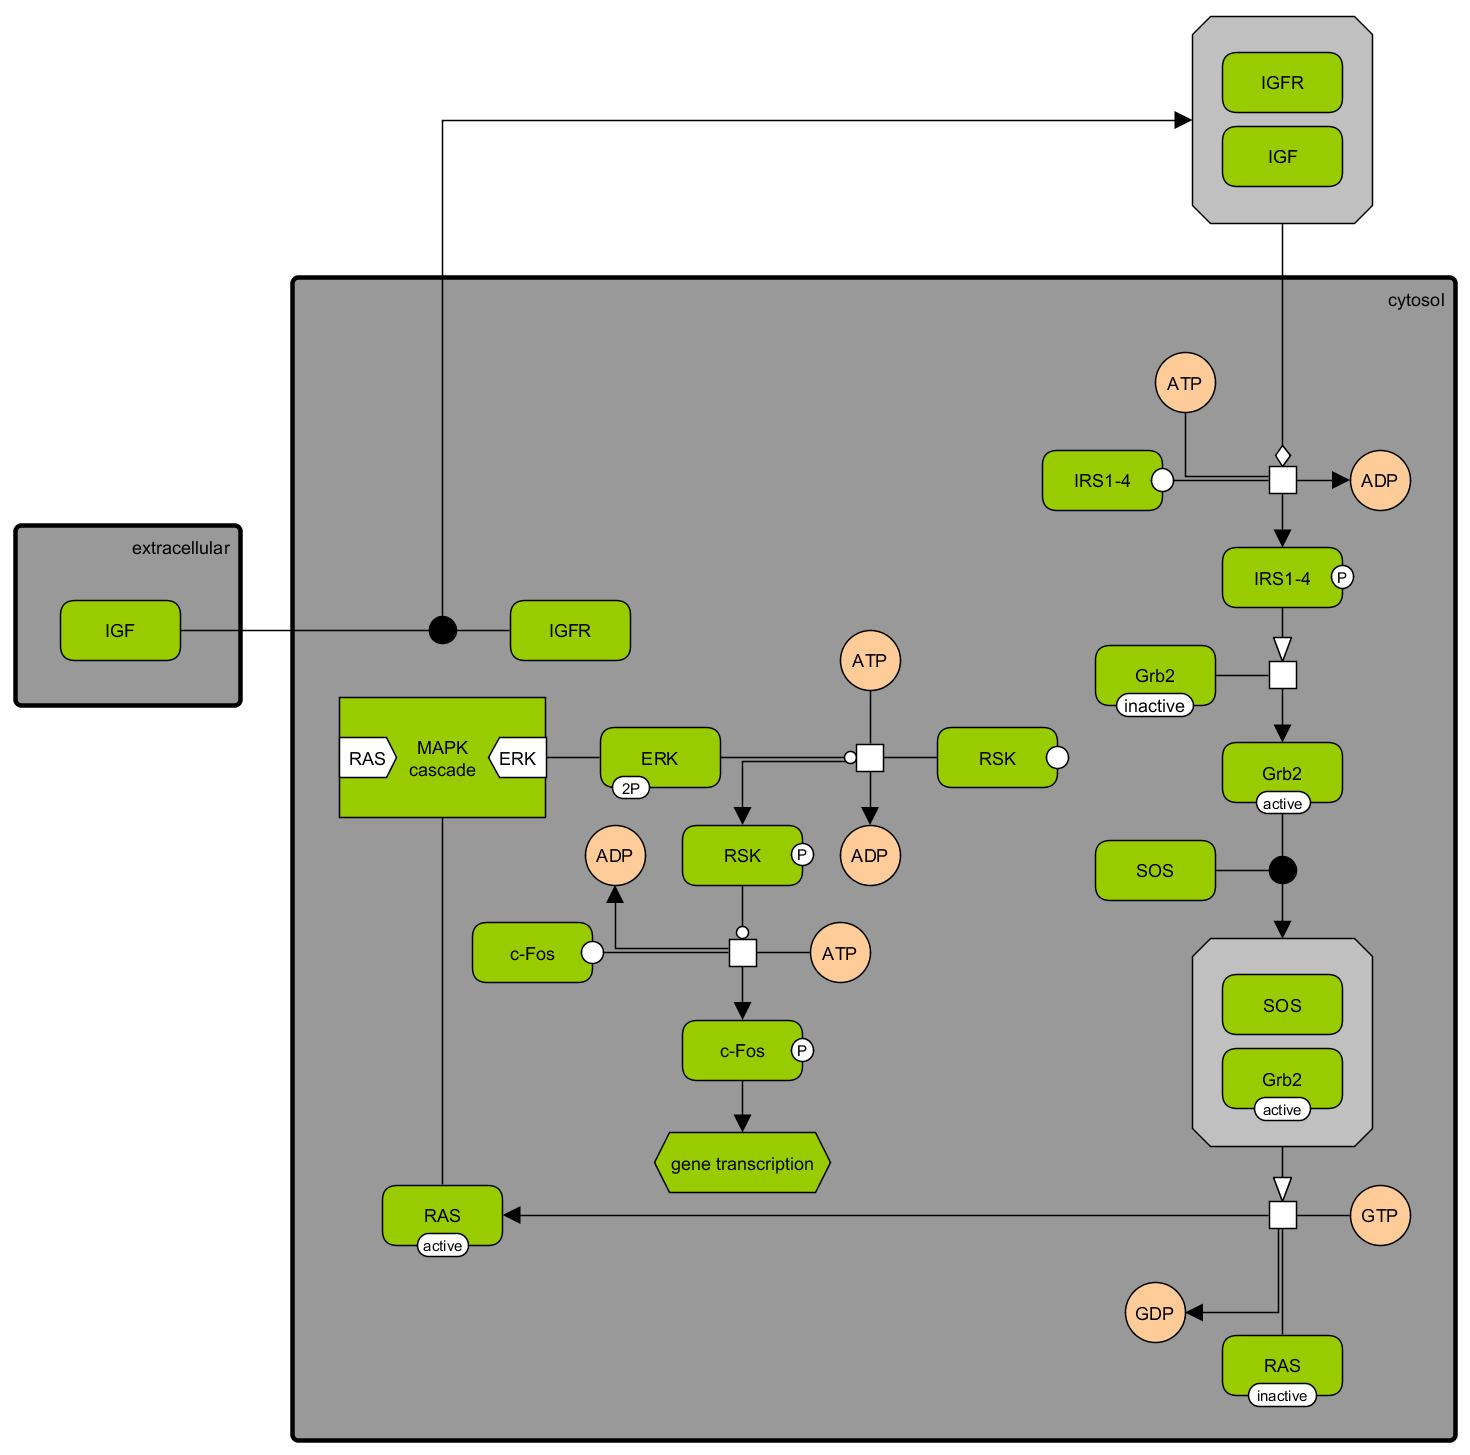
Insulin-like growth factor signaling pathway