
Diagramming for
Supply Chain Management

Visualize and optimize supply chains - with graphs!
Traditionally associated with manufacturing processes, supply chain management is equally important for the provision of any good or service, whether physical, face-to-face, or purely digital.
SCM is today better thought of as “managing the chain of supplies” – and that chain can include any
value adding resource, from raw materials to human skills and from factory machinery to social media
marketing.
Tasks such as demand forecasting, distribution network optimization, and efficient warehouse management are integral aspects of SCM.
In general, SCM is dedicated to the systemic, strategic coordination of the functions and processes
within the value adding chain, aiming to optimize the performance of both the individual components
and the supply chain as a whole.
The complexity of modern supply chains significantly increases the stress of adequately handling SCM activities such as logistics,
inventory optimization, or procurement strategies.
Our diagramming SDK, yFiles, lets you map and visualize complex supply
chains, in order to then analyze and optimize them based on real-time insights. Replacing clumsy spreadsheets
with flexible, interactive diagrams provides a comprehensive and dynamic view of even the most convoluted supply chains.


Supply Chain Management - The key to every company's success
Managing a supply chain requires visualizing and analyzing all of the components, resources and processes in a network.
Comprehensively diagramming a supply network enables teams to identify inefficiencies and optimize the overall supply chain.
Supply chain or supply network?
Even the most basic supply chains are getting longer and more complex – often with dozens of links, branches, and dependencies. In fact, it’s often more appropriate to speak of a “supply network” designating the many
complicated and multifaceted layers of any given supply chain.
The more complex these interlocking processes
get, the more critical it is to visualize the data accurately and comprehensively. With so many moving parts, it’s vital for managers and
analysts to be able to pinpoint areas where delays, bottlenecks, or other issues arise.
By employing interactive graphs that are capable of process mining
and visualization, management of even the most complex supply networks can become very intuitive and more efficient.
Building visualization tools from scratch is costly and time-consuming. Luckily, there is already a mature, highly customizable library of ready-to-use components available: yFiles.
yFiles simplifies supply chain mapping, making data silos and clumsy spreadsheets a thing of the past!
Did you know?
Our diagramming SDK can import data from any source – including Excel, JSON files, relational databases, graph databases, and everything you can access programmatically.
 In today’s lean production market, it’s essential that companies with large production facilities have excellent SCM, especially for complex processes. Indeed, even production of simple products can be crippled by one weak link in the chain. Automating and the ability to analyze, identify and correct inefficiencies is the key to success.Sebastian Müller, CTO yWorks
What to expect on this page
The yFiles diagramming SDK
The yFiles SDK is designed explicitly for diagram visualization. Its advanced layout algorithms can comfortably transform your data into readable, informative, and appealing diagrams. In contrast to a generic graph editor or app, yFiles lets you create tools tailored to your specific requirements. It provides a graph visualization component, graph editor features, and an extensive set of algorithms for automatic data arrangement and graph analysis.
Software developers use yFiles to display, edit, and analyze production processes, decision models, resource utilization, and much more. Exporting and importing data is a breeze: yFiles is compatible with every data format and data source and available for every major platform: Web, .NET and Java. And because yFiles can visualize data from different sources, data does not have to be first consolidated into one database.

SCM with yFiles
The yFiles diagramming library offers numerous diagram layouts and algorithms for each major stage of supply chain management: planning, simulation, analysis, and optimization.
yWorks customers currently use yFiles to support a wide variety of SCM tasks, including compliance monitoring, reporting, fraud detection, and lean production via interactive global maps. Regardless of the complexity of the visualization, all company data remains on premises.
Benefits in a nutshell
layouts
use case
label
code examples
support
customizable
Supply chain planning
Using network flows, Sankey diagrams, and gantt charts, yFiles can visually model all flows in a supply chain. This works for lean production, just in time and just in sequence production where the goal is minimizing time, labor, and materials.
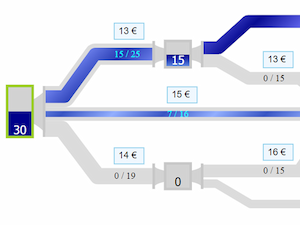
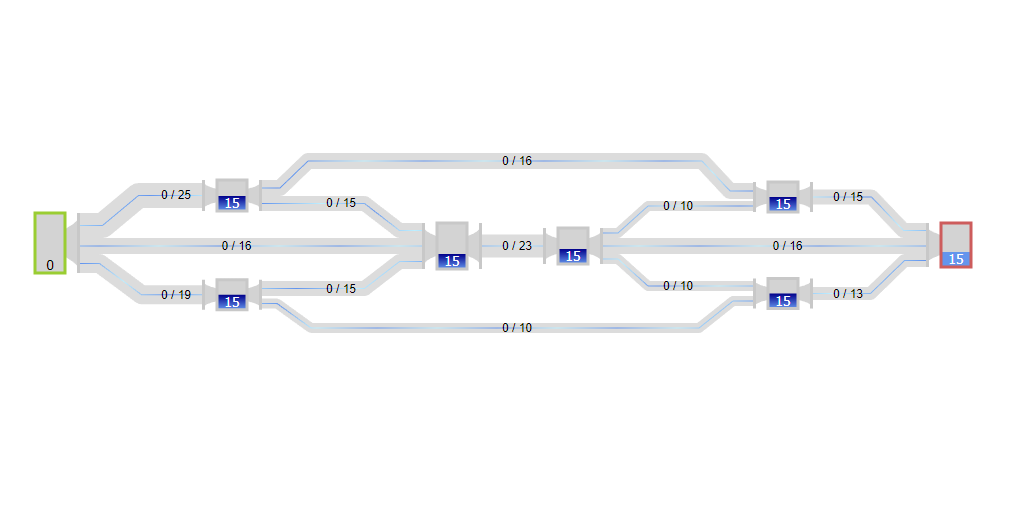
Network flow algorithms can help ensure that resources flow from one location to another within a network as efficiently as possible. This visualization through time and space in the navigating graph (see the network flow demo) shows the capacity of each path, which can be indicated by its thickness in the graph. The nodes, which represent hubs, can help pinpoint potential bottlenecks. Depending on the case, the manipulation of the nodes can also be used to manage and control the supply chain.
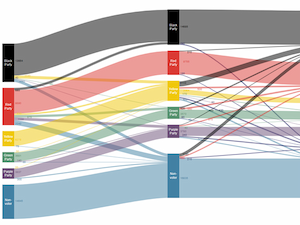
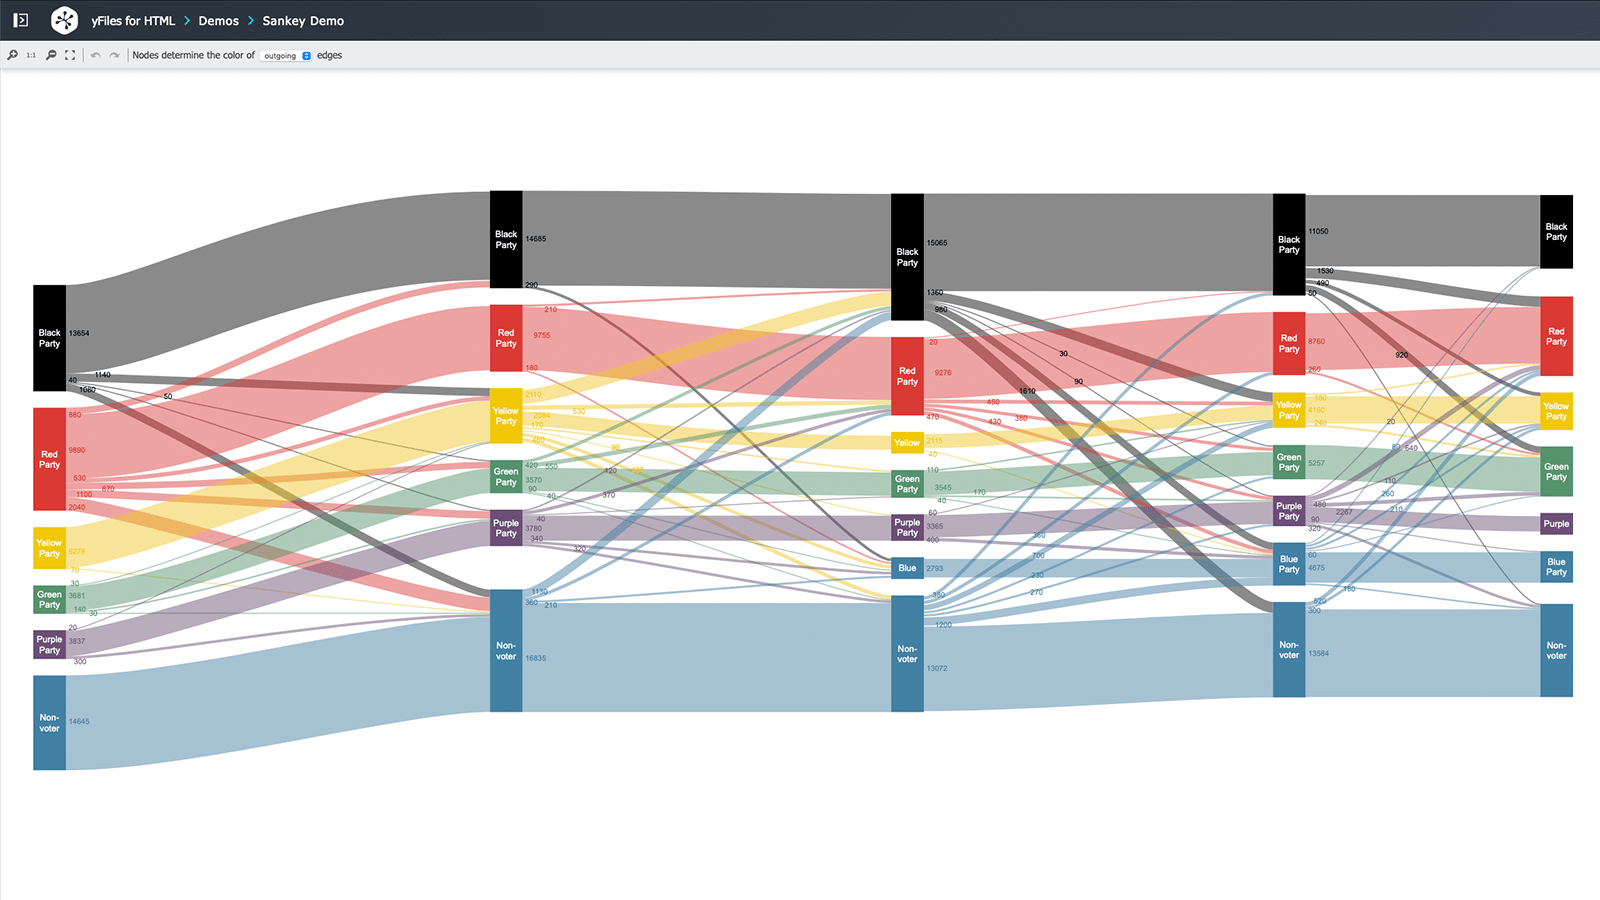
Sankey diagrams are used for visualizing flow information, with the thickness of the edges proportional to the flow quantity. Here, ingoing and outgoing data points are visualized over time, facilitating the identification of problems in the flow. For example, in a lean production environment, managers can use Sankey diagrams to ensure that parts and resources are available precisely when and where they’re needed. The more complex the production flow gets, the more helpful visualization becomes in pinpointing potential problems.
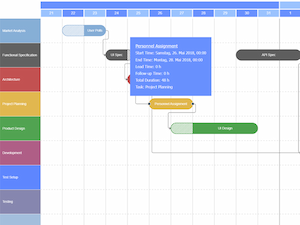
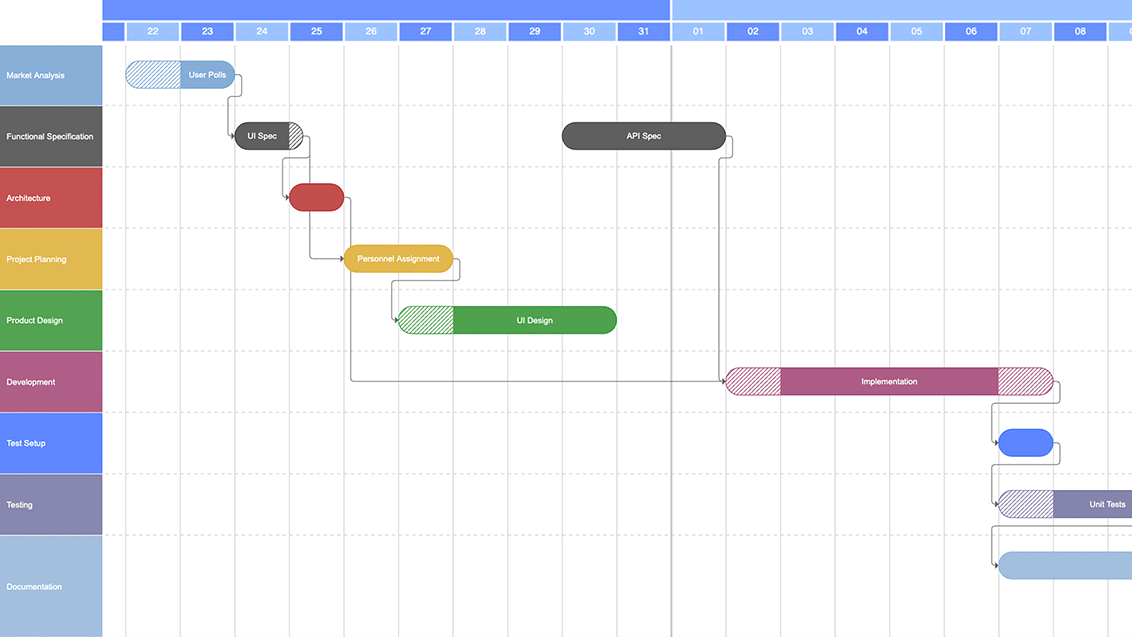
Gantt charts can visualize an activity that has a start and end date, and optionally a lead time and follow-up time. Also, an activity can depend on other activities, which is very helpful in
representing SCM dependencies, and how to resolve them. Gantt charts and the Sankey diagrams can link
input/output volume to timestamps and geodata in the production process. This can assist in ensuring
quality and compliance for a complete bill of materials (BOM), where a comprehensive inventory of materials
and goods used in production is required.
In short, yFiles offers a range of powerful visualization techniques tailored for supply chain management.
Through features like network flows, you can model the movement of resources within your supply chain network,
optimizing paths and minimizing bottlenecks. Sankey diagrams provide a clear visualization of flow information,
allowing for the identification of inefficiencies and areas for improvement. Additionally, Gantt charts offer
a comprehensive view of activities with start and end dates, enabling effective scheduling and coordination of
tasks across the supply chain.
Supply chain simulation
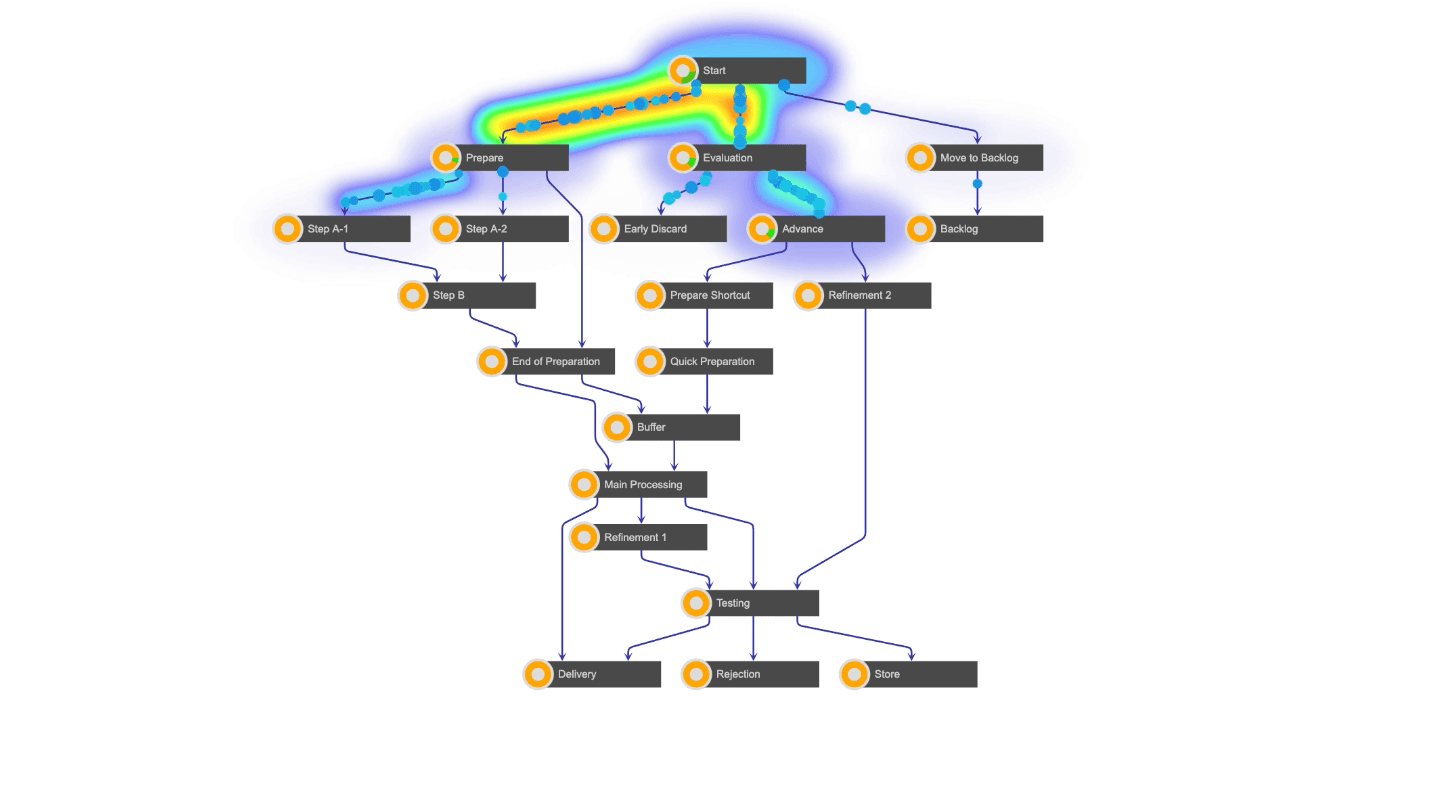
As supply chains grow in complexity, simulation becomes an increasingly valuable tool. By simulating various network and flow scenarios, teams can test and compare alternatives prior to investing in production facilities. Equally, individual variables or nodes in an existing network can be isolated in a simulation to determine the effects on the rest of the supply chain. The process mining and interactive maps features can be used to simulate upstream and downstream supply chain process issues. For example, when filtering for one node, the heat map in the process mining tool shows which elements are nearing capacity as a result. Interactive maps can also visualize relations in space as well as time – for example, when aggregating geodata about the location or origin of products.
Supply Chain Act
Germany’s Act on Corporate Due Diligence in Supply Chains (adopted 2021) requires companies to demonstrate that fundamental environmental and human rights standards are observed for the entire supply chain, from the sourcing of raw materials to the sale of the finished product or service. (For example, by documenting that the mining of a raw material is safe for the environment and for workers’ health and safety.) Visualizing the end-to-end supply chain will be indispensable for understanding and proving compliance with the Act. Similar supply chain laws are likely to be adopted in the EU and elsewhere.

Supply chain analysis
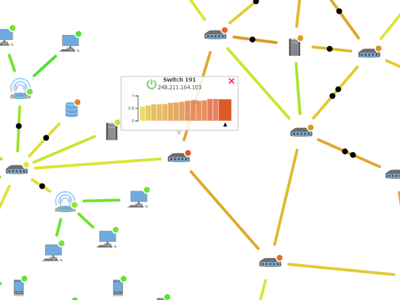
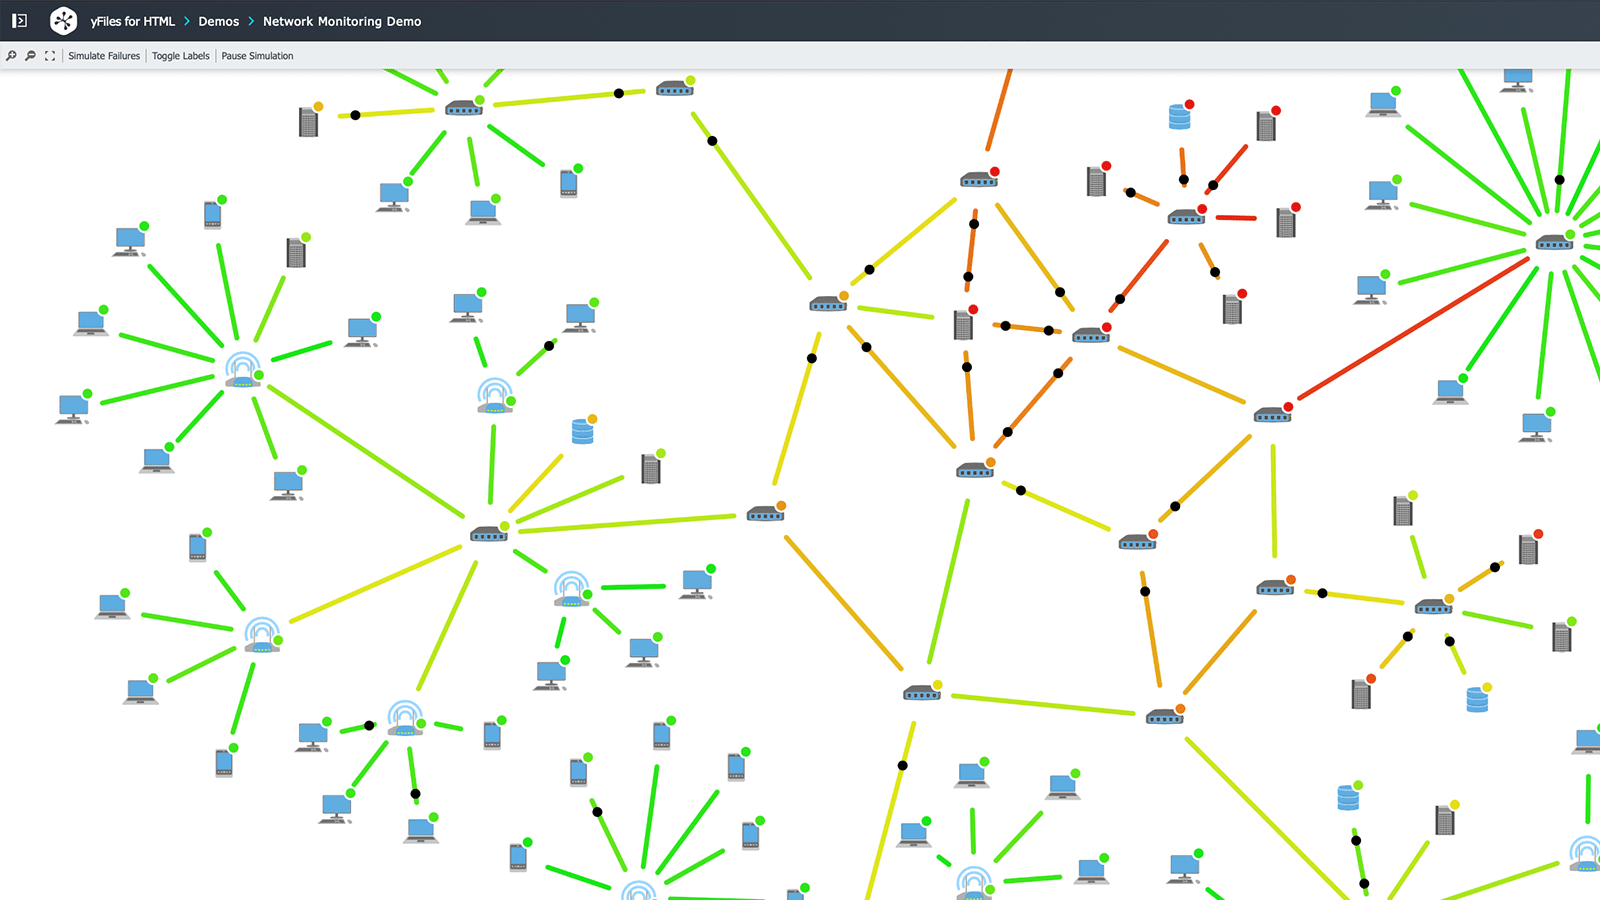
Analysis of the entire supply chain and network is perhaps the most impactful element of SCM. By breaking down the chain into phases and stages, from the acquisition of raw materials all the way through to delivery of a product to customers, it’s possible to find inefficiencies and improve the overall business outcomes. In the network monitoring graph, you can watch traffic flowing through the network and even influence the network by deactivating nodes. This ability to influence the data flow and see what happens when a node fails, is helpful in identifying points of weakness and failure. It’s also possible to connect a graph with real-time processes to manage SCM in real time, not just to perform analysis.
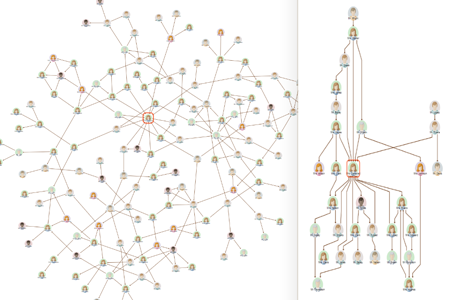
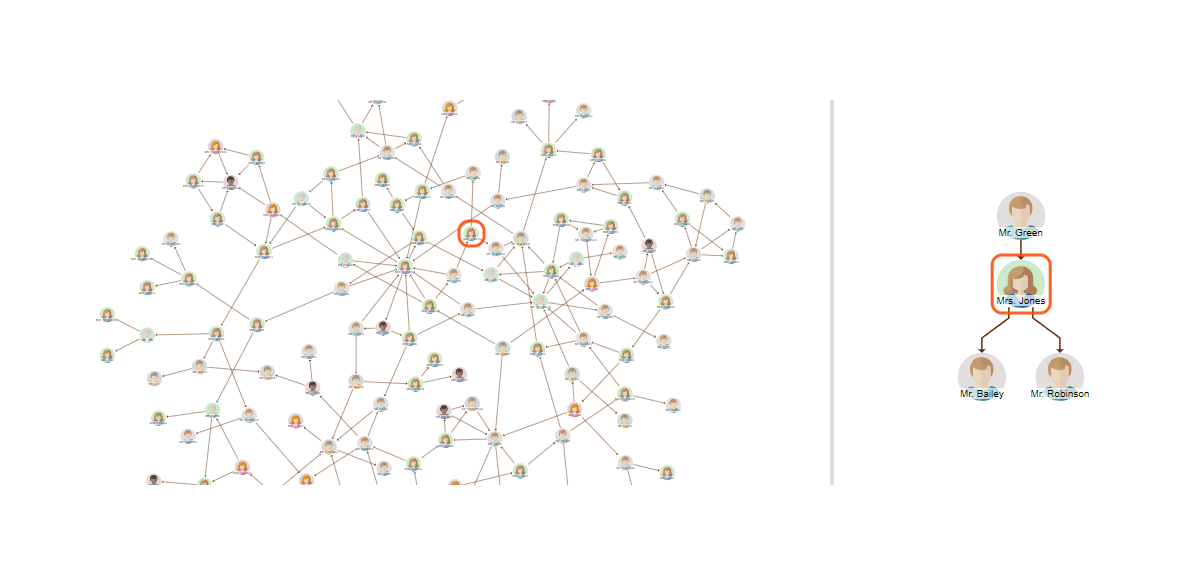
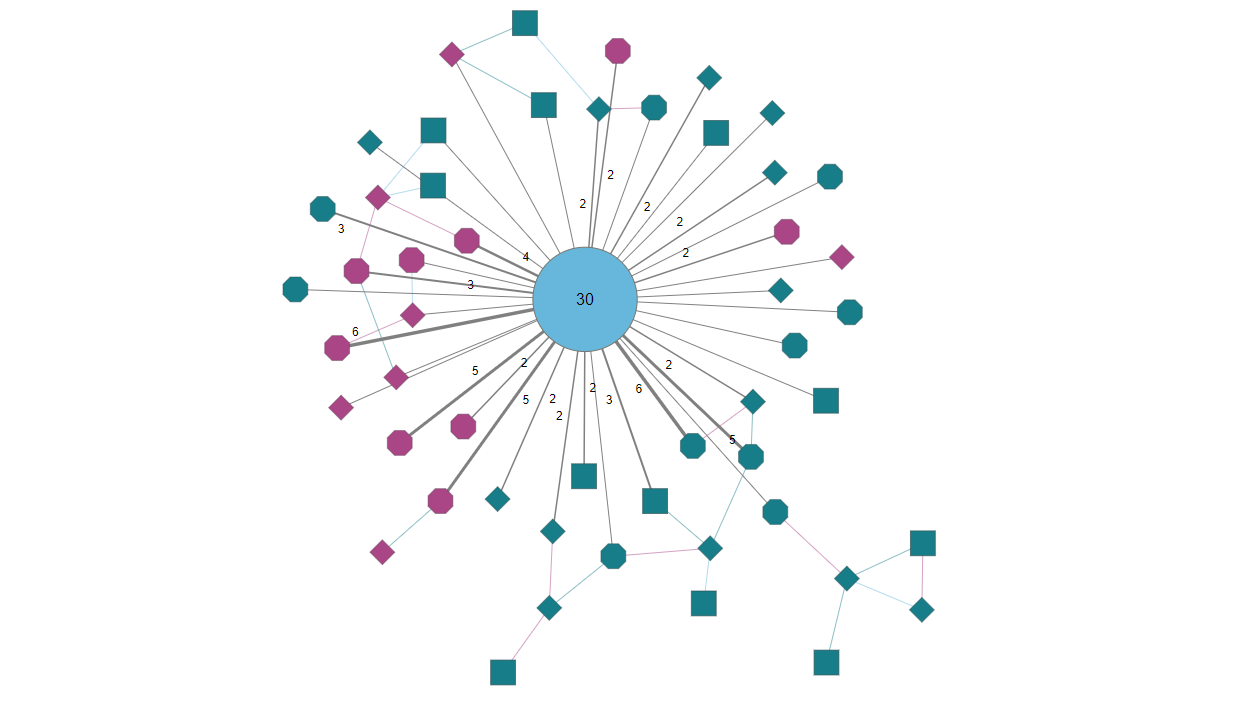
The neighborhood view graph can be used to show root cause analysis (predecessors) and dependency analysis (successors) of various phases and actors in a supply chain. This feature can be used for troubleshooting, e.g., product recall (based on units such as a production batch) or understanding and even predicting areas of inefficiency.
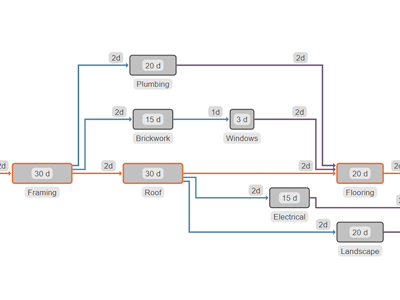
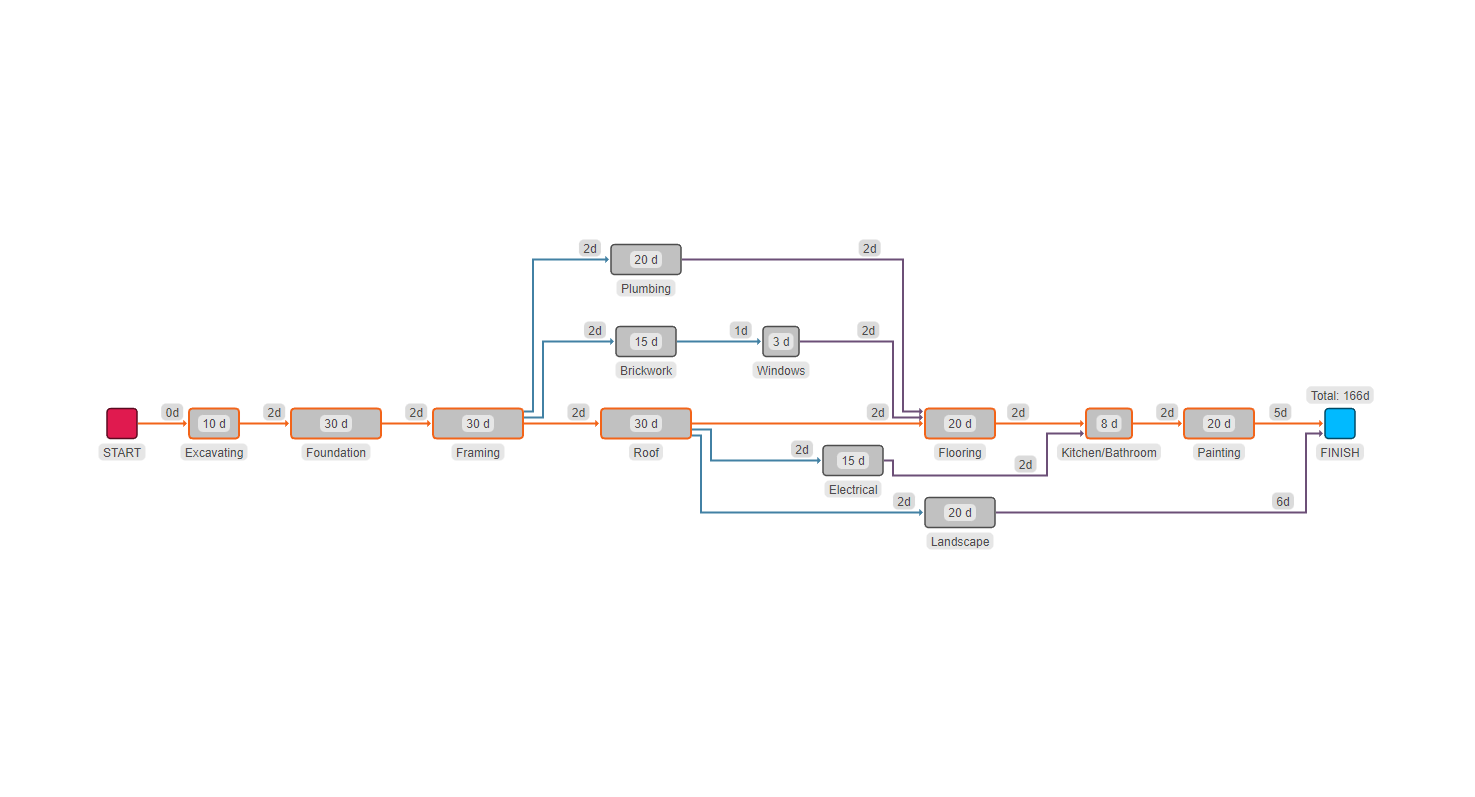
Critical path analysis is used in project and supply chain management to identify the individual tasks – and the time required for those tasks – that must be completed if a project or production process is to be successful. The critical path analysis demo shows how yFiles allows you to visualize all of the components and relations in a complex process and to map respective critical paths.
Supply chain optimization
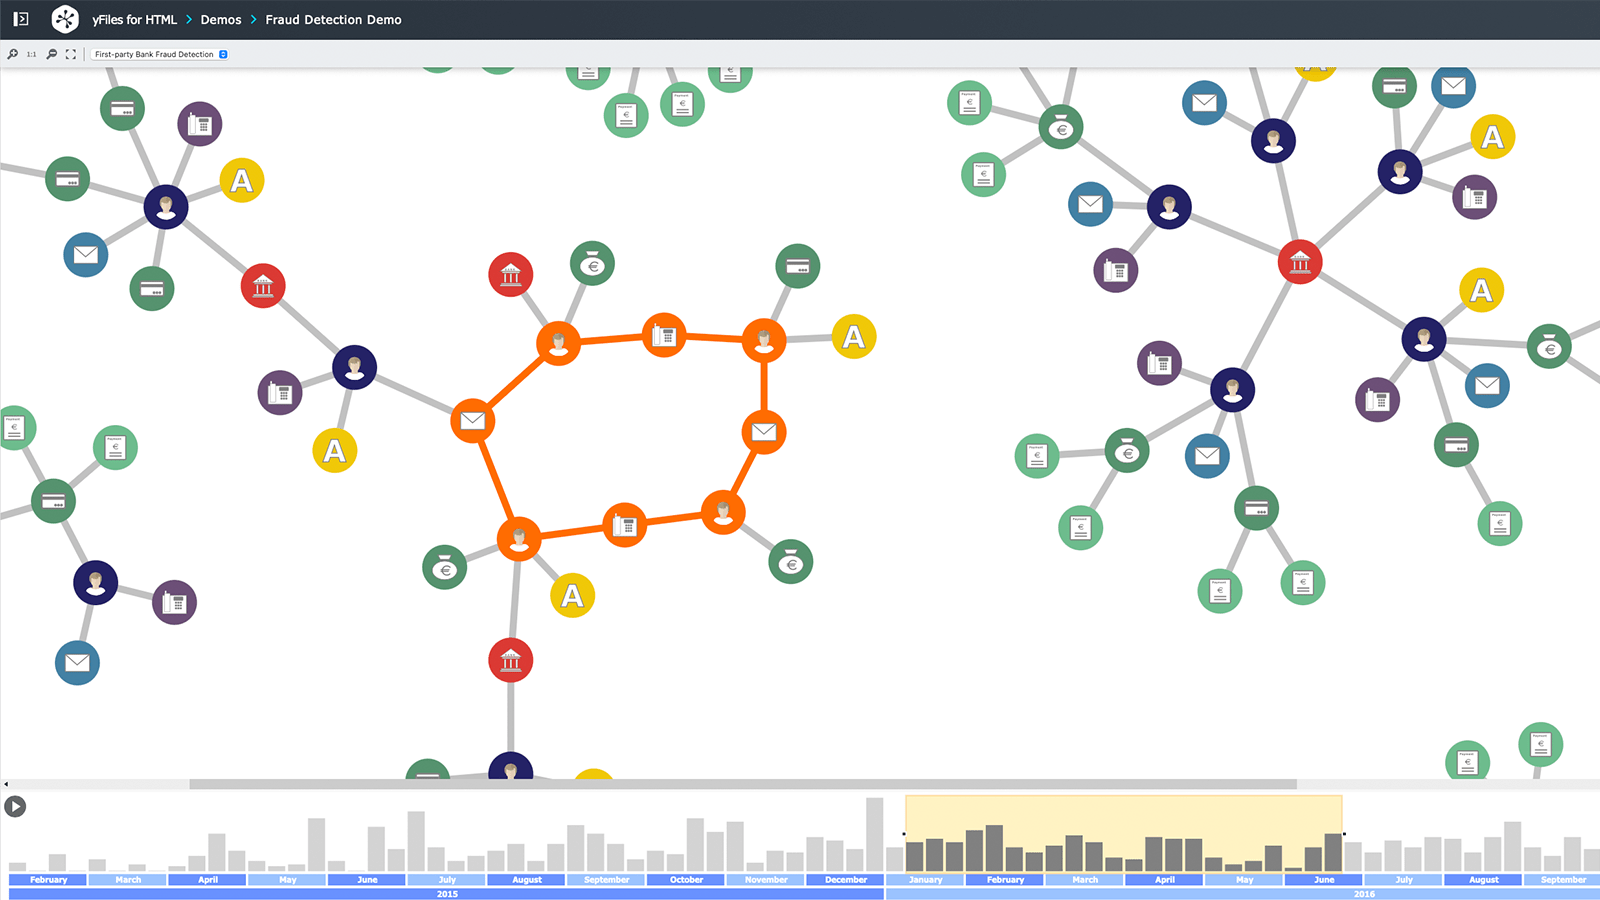
The Fraud Detection Demo has three powerful components that can be applied to visualizing and optimizing SCM. The main visualization graph allows you to see related data points as nodes and rings which could be suppliers in a procurement process. (In the demo, the rings designate fraudsters in a financial services scenario.) Second, there is a timeline component, which shows when an event or incident was created or occurred. The final view combines the details of each ring with its timeline. You can show or hide specific time periods using the sliding time window. This selective data visualization is useful for analyzing details in a process that has a time component. For example, in an SCM scenario, you can visualize dependencies among the flow of parts and the sequence of parts suppliers in a production chain over time.
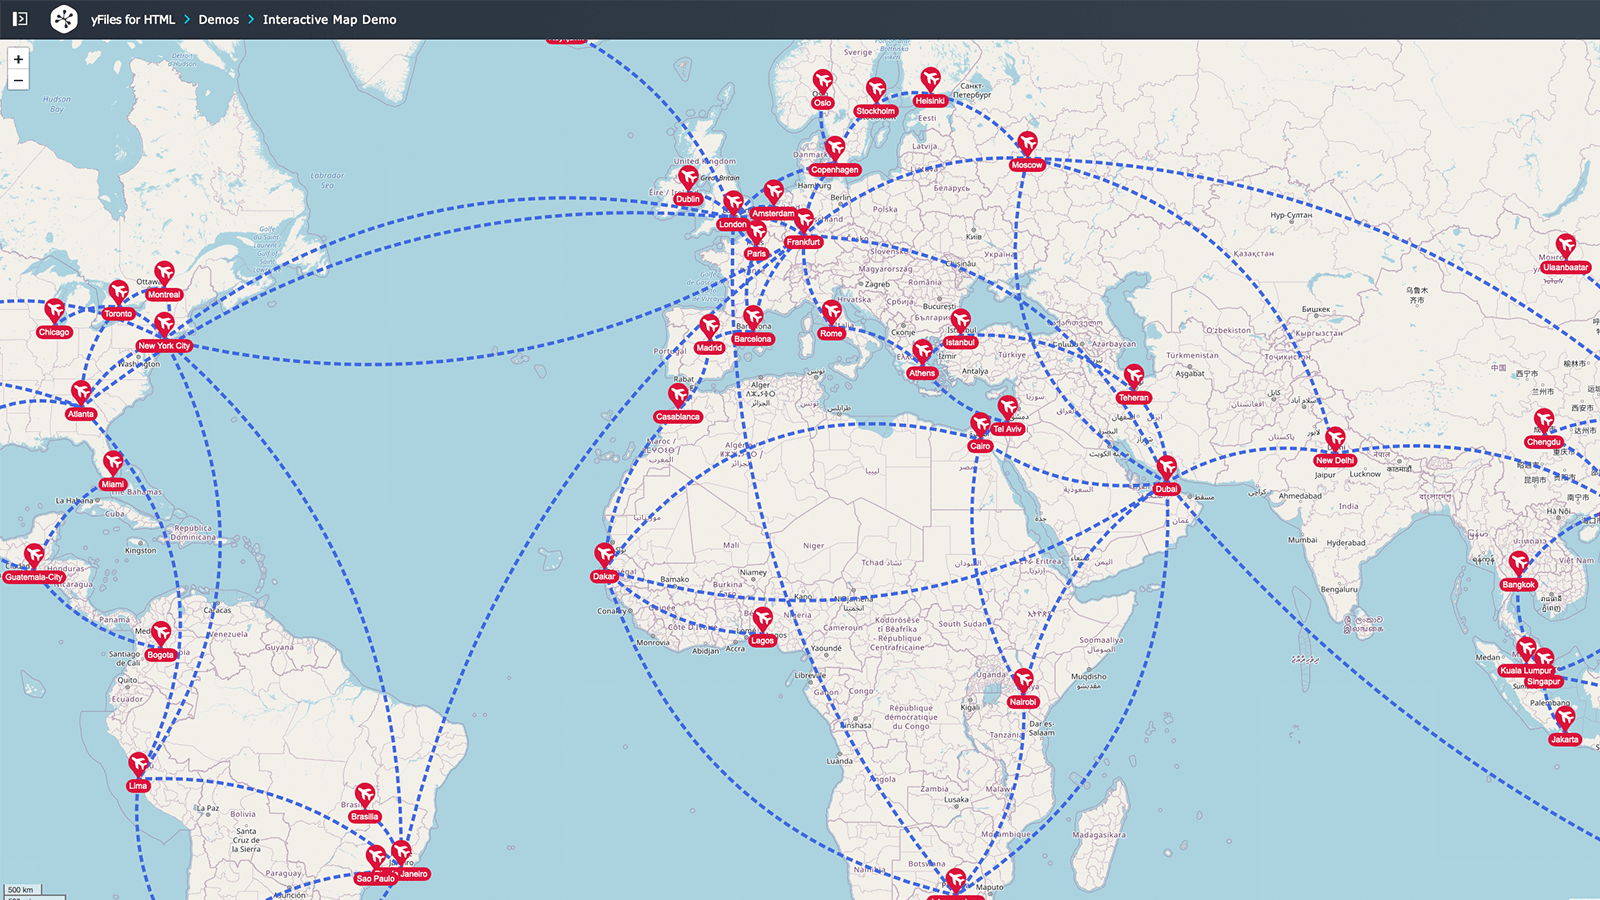
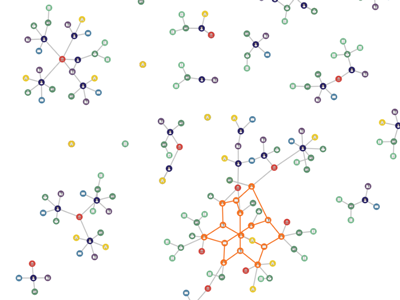
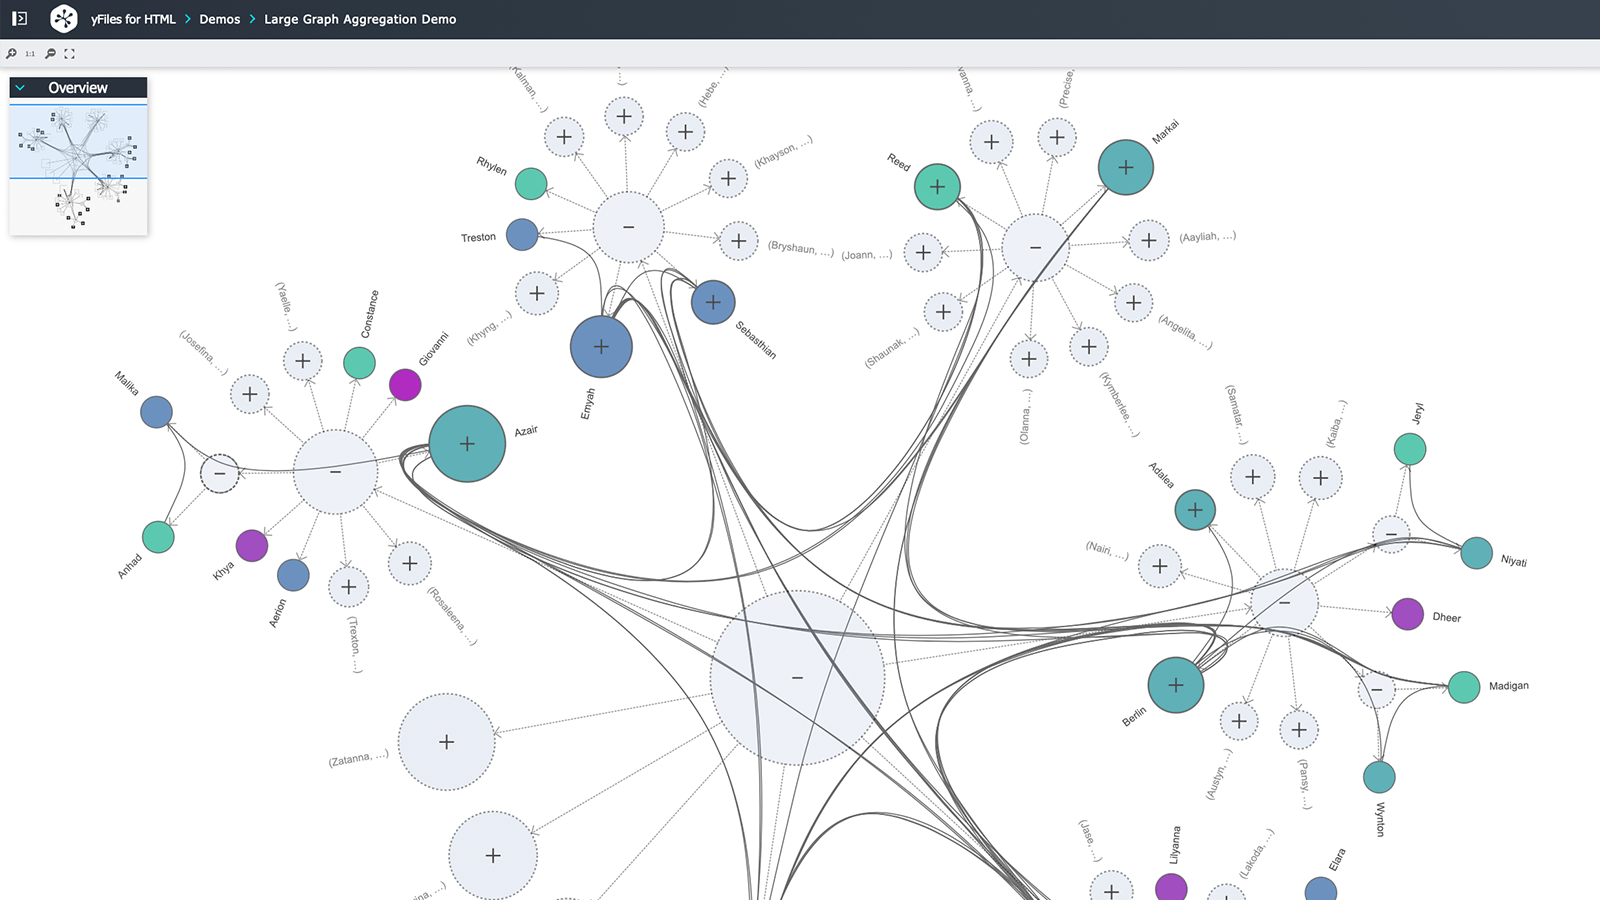
In the Large Graph Aggregation Demo, it’s possible to take huge amounts of data from complex supply chains and aggregate the data, e.g., by source country of products, or by continent or city. Thus, you can visualize on a map (using the interactive map tool) and zoom down to visualize specific nodes of a supply chain. Depending on the variables you are interested in analyzing, you can filter by narrow criteria to understand your supply chain data better. You can also modify the parameters of various processes to represent objects in detail and find what’s important to the process, such as pinpointing a machine capacity issue or a lack of raw materials.
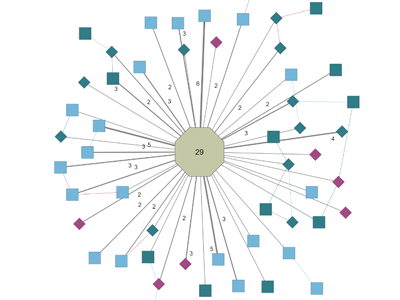
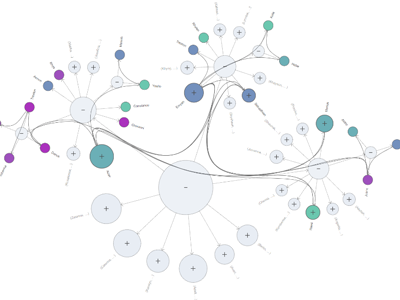
The Interactive Aggregation Demo shows how to analyze a graph by aggregating nodes. As supply chains are often huge networks with related and unrelated nodes, with the mechanics of aggregation in this type of visualization (expand and collapse) it is easier to focus on individual areas of the supply chain. Areas that are not so relevant at the moment of observation can be "hidden" without disappearing completely.
And you can do even more with yFiles
Many approaches can be used to design, monitor, and continuously improve processes. yFiles supports all of them – from depicting very large datasets and using visualizations like BPMN diagrams, flowcharts, network diagrams, and data flow diagrams to planning the movement of goods within your company. yFiles also provides many opportunities for analyzing data and generating insights.
Explore the interactive live demos that show the SDK’s strengths in supply chain management. The source code of the demos is included in yFiles – even in the free trial!
By the way, yFiles has a special talent: It adapts to any model, method, and scenario. Yes, even the ones we haven’t thought of yet. Just get in touch! Together, we’ll see how yFiles can meet your diagramming needs.
Do you have a data visualization challenge?
Ask our Customer Success Team!
We are pretty sure yFiles can support your use case, too.
Just talk to us – no strings attached!

you might want to explore


Start your journey here– with the diagramming experts

Our team is happy to advise you – no strings attached. Let's talk about your project and find the perfect solution for your needs!
E-mail: hello@yworks.com
Your message has been sent.
Your request could not be sent. Please reload the page and try again.
If the problem persists, please report the error to webmaster@yworks.com.
Learn more in our privacy policy.