
yFiles documentation
Everything in one place
Each member of the yFiles product family includes comprehensive documentation that bundles together three essential resources: the Developer’s Guide, the API documentation, and the Knowledge Base. A centralized search lets you immediately find the answer to your questions.
The documentation is part of the yFiles product package, and there’s also an online version available.
Developer’s Guide
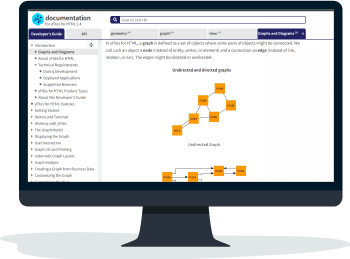
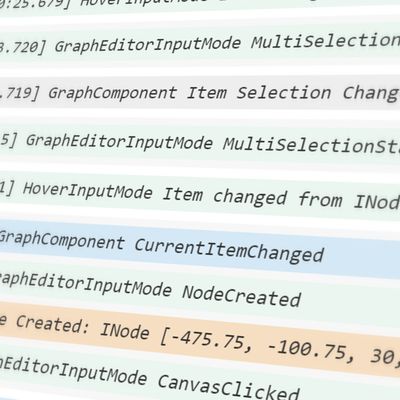
The Developer’s Guide describes the library’s concepts and explains how the classes and interfaces provide functionality.
You’ll also learn about the graph layout algorithms and their
options and settings.
API documentation
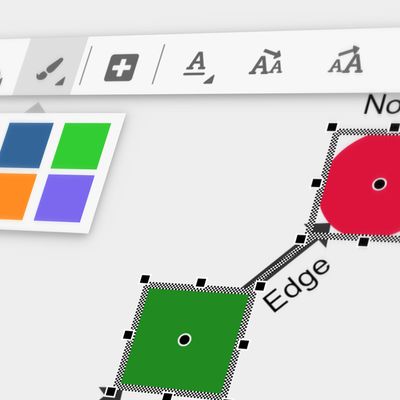
The detailed API documentation for the classes and interfaces of the diagramming library provides clear help for working with yFiles. It is available as HTML pages, and can also be directly integrated into many IDEs.
Knowledge Base
The yWorks Knowledge Base contains short, product-specific technical articles written by our core engineers answering frequently asked questions.
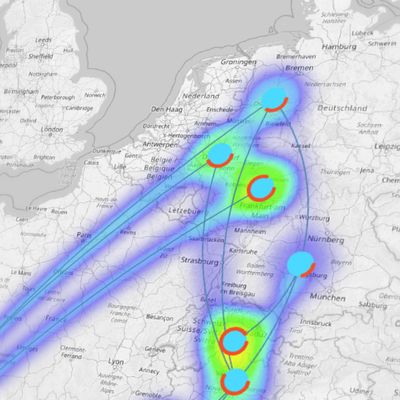
WEB
PLATFORM
For more information about yFiles on the web platform, check out our variant specific details.
VSDX Export
Open documentationJAVA
PLATFORM
For more information about yFiles on the Java platform, check out our variant specific details.
yFiles for JavaFX
Open documentationyFiles for Java (Swing) 3.x
Open documentationyFiles for Java (Swing) 2.x
Open documentationFurther documentation for yFiles for Java (Swing) 2.x and its extensions is available here.
.NET
PLATFORM
For more information about yFiles on the .NET platform, check out our variant specific details.
yFiles.NET (WinForms)
Open documentationyFiles WPF
Open documentationFLEX, AJAX,
SILVERLIGHT
Software changes over time, and so does yFiles. We develop the diagramming SDK for new technologies as these become established. And although we support outdated yFiles versions for a very long time, we have to say goodbye at some point.
Outdated technologiesLooking for even more helpful resources?
Check out our support hub to find video tutorials, source code demos and more.
Support hubDiagramming in Confluence
Graphity for Confluence
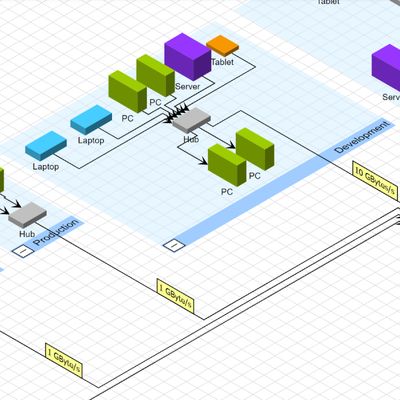
Graphity® for Confluence is a powerful diagramming plugin for Atlassian Confluence.
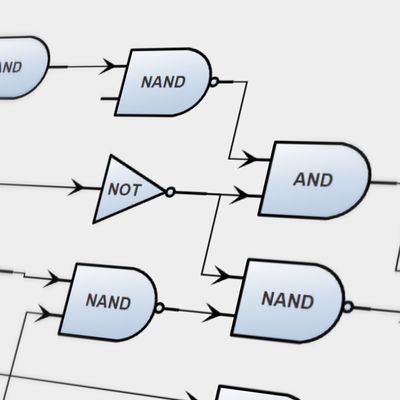
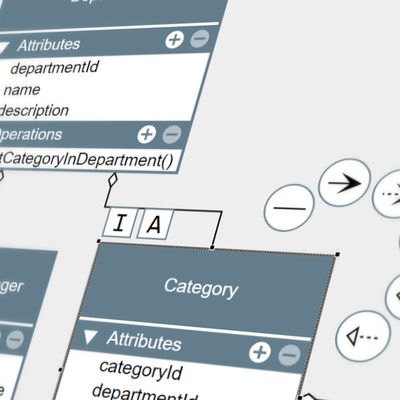
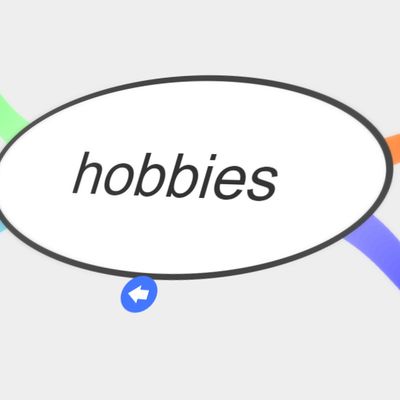
It allows you to quickly generate, edit, and store high-quality renderings of flowcharts, network graphs, UML class diagrams, and other diagrams directly inside Confluence — without external tools or storage needed.
graphity.com


you might want to explore


Why, how, what? —Just ask the diagramming experts!

Our team is happy to advise you – no strings attached. Let's talk about your project and find the perfect solution for your needs!
E-mail: hello@yworks.com
Your message has been sent.
Your request could not be sent. Please reload the page and try again.
If the problem persists, please report the error to webmaster@yworks.com.
Learn more in our privacy policy.