Hero image for Drawing Business Process Diagrams

Drawing Business Process Diagrams

Visualize and design Business Process Diagrams (BPMN) in your application

Business process diagrams help to visualize and design business processes in an organization. They enable managers to understand, control, and optimize business processes. A useful diagram makes it easy to identify which tasks are essential to a larger business goal and streamline them to improve efficiency.

BPMN Diagram

Tools for modeling, simulating, or executing business processes are commercially available on the market. While these are suitable for general purposes, some use cases may require a custom solution. Developers who intend to create such a custom solution can save a lot of money, time, and workforce by using a software library that provides ready-to-use components for this task. yFiles is a commercial programming library that facilitates the creation of custom graph editors. yFiles is available for many different platforms.

BPMN Elements

The Business Process Model and Notation (BPMN) is a standard for business process modeling. It provides a graphical notation for specifying business processes in business process diagrams. The goal of BPMN is to provide a notation to both technical and business users to intuitively model and understand complex business processes. Therefore, BPMN diagrams consist of a limited number of graphical elements that are easy to understand.

BPMN divides the graphic elements into four categories:

Flow Objects

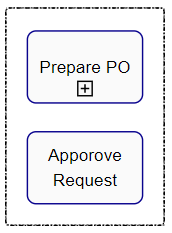
Flow objects are the main elements of business process diagrams and consist of three basic elements: events, activities, and gateways.
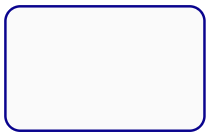
Activities

An activity describes a task that needs to be done in a business process. It is displayed as a rectangle with rounded corners.
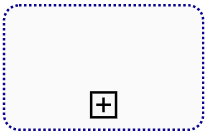
demo bpmn activity task
demo bpmn activity subprocess
demo bpmn activity event subprocess
demo bpmn activity transaction
demo bpmn activity call activity

Gateways

A gateway represents a decision point or a point at which various control flows merge. It is drawn as a square standing on the top.
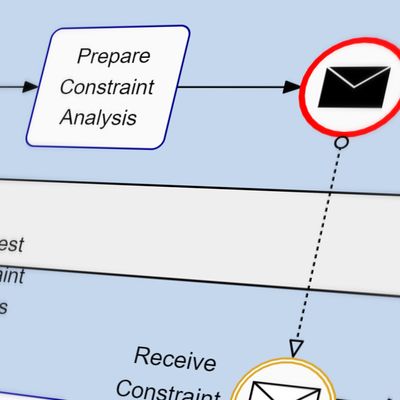
demo bpmn gateway exclusive
demo bpmn gateway exclusive marker
demo bpmn gateway inclusive
demo bpmn gateway parallel
demo bpmn gateway complex
demo bpmn gateway event based
demo bpmn gateway exclusive event based
demo bpmn gateway parallel event based

Events

An event is something that can happen in a business process. Examples are the arrival of a message, the arrival of a specific date, or the occurrence of an exceptional situation.

demo bpmn event plain
demo bpmn event message
demo bpmn event multiple
demo bpmn event parallel multiple
demo bpmn event terminate
demo bpmn event time
demo bpmn event escalation
demo bpmn event conditional
demo bpmn event link
demo bpmn event error
demo bpmn event cancel
demo bpmn event compension
demo bpmn event signal

Connecting Objects

Sequence flows connect activities, gateways, and events. They specify the execution order of activities.

demo bpmn connecting sequence flow
demo bpmn connecting default flow
demo bpmn connecting conditional flow

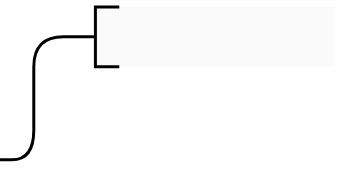
A message flow indicates that two lanes or pools or two of their elements exchange messages.

demo bpmn connecting message flow

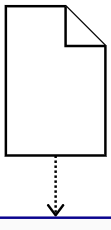
An association connects an Artifact or text to a Flow Object and is represented with a dotted line.
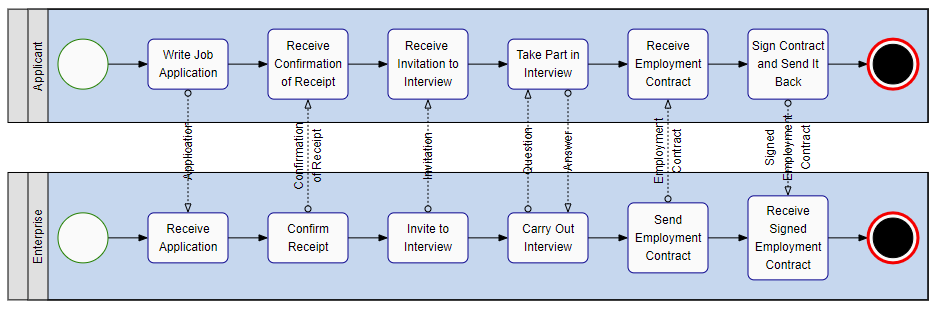
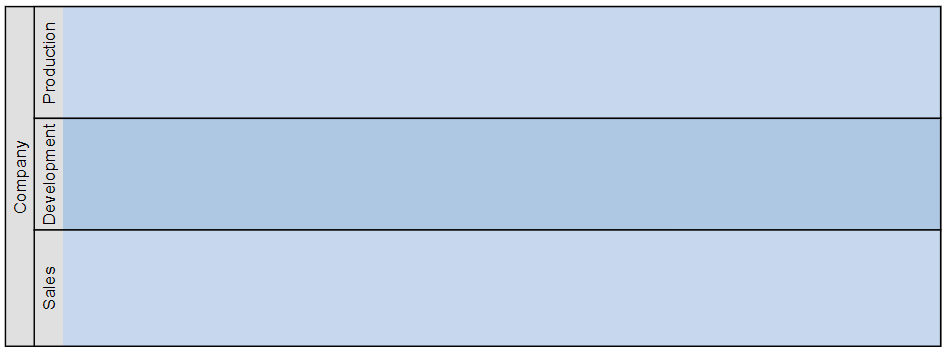
demo bpmn connecting association
demo bpmn connecting association directed
demo bpmn connecting association bidirected

Pools and Swimlanes

A pool represents the main process participants, typically different organizations each. A lane subdivides a pool and extends the full length of the pool. It represents a participant in a workflow that is a user or a system.

demo bpmn pools

Artifacts

Artifacts add additional information to the diagram to make it more legible and easier to understand. An annotation is a comment that can be associated with an element of a business process. A data object represents data that is required or produced in an activity. A group visually summarize elements of a business process.

demo bpmn artifact data object
demo bpmn artifact annotation
demo bpmn artifact group

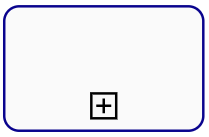
The symbols are not only visual elements, but they can also have behavior. For example, an activity node with a dynamic sub-state can group other items that are hidden in the closed state. Collapsing elements hide specific details to reduce the complexity of large diagrams and to achieve a clear presentation.

Implementing the full range of BPMN symbols is very time-consuming. yFiles provides the complete palette ready to use. Since all symbols are available as source code, it is quite easy to adapt their appearance as well as their behavior to the look and feel of any business process application.

Editing Diagrams

The BPMN Editor Sample Application demonstrates all aspects of a BPMN editor, including interactive editing, BPMN node visualizations, and a specialized BPMN layout algorithm.

A BPMN editor should support navigation features like zooming, panning, and scrolling. These features help the users to keep track of large diagrams but also lets them inspect specific details of diagrams.

The most basic graph editor features are, of course, the creation and deletion of elements. For example, elements can be created by dragging from a palette and dropping onto the canvas. Creating connections between elements is merely a simple drag gesture from one element to another. Furthermore, text can easily be added to elements, as well.

Besides the gestures to create elements, there are countless others to modify the diagram, such as dragging the mouse to change the size or position of elements. Or context menus that only display menu entries concerning the currently selected elements.

yFiles provides support for all of these tasks. More, all aspects from higher-level gestures down to specific details are highly customizable.

For mobile devices, an extended input for touch devices is essential. The example application Touch Interaction shows many customizations for touch input, which makes it even possible to edit diagrams on smartphones.

Aligning Elements

Aligning elements means placing the elements so that the diagram looks nice and highlights some specific characteristics of the model. In the case of a business diagram, the timing of events or tasks is often essential for planning the entire process. For example, it is crucial to recognize the critical path. The critical path is the sequence of tasks that limits the minimum amount of time required to complete the overall process.

yFiles helps the users align their diagrams with powerful features:

Grid

A grid consists of equally spaced lines in the horizontal and vertical direction. The lines make it easier for the user to align BPMN elements on the canvas. yFiles displays the grid as points or lines. Besides, the grid magnetically attracts the mouse as it moves or resizes elements. This feature makes it very easy to align elements on the grid.

Snaplines

Snapping shows visual guides during gestures near other elements to ease alignment. Ensuring that an element has the same height as other elements in the diagram is just as easy as aligning an element in the exact center of two others or creating orthogonal connections.

Automatic Layouts

yFiles features efficient and highly customizable algorithms for automatic layouts. The BPMN layout calculates positions for the BPMN elements and paths of their connections, creating a look that is typical for BPMN diagrams. Also, the algorithm places the labels to locations where they are easy to see. With one click, the user can create a beautiful BPMN diagram from a very confusing presentation.

Storing and Sharing Diagrams

An essential feature of any diagram editor is loading and saving diagrams from disk, cloud storage, or any other location, which makes it possible to continue working with the diagram at a later time or to make it available to other persons. The built-in serialization uses GraphML, an XML based format, to read or write the diagram considering each aspect of item placement and styling. However, yFiles allows to store and create business process diagrams from the format and location that fits the use case best. This allows the editor to use formats to exchange data with other business processing tools.

Example and Source Code

yFiles comes with an extensive BPMN Editor Sample Application. This application features interactive editing, BPMN node visualizations, and a specialized BPMN layout algorithm.

The source code of the BPMN Editor Sample Application is part of all yFiles packages and available on GitHub:

Implement Your Own BPMN Application

Test the yFiles diagramming library with a fully-functional trial package. To implement your own BPMN application, start with the BPMN Editor Sample Application that is part of the yFiles package. It’s not only a showcase application but also provides best-practice source code that you can re-use in your own project. yFiles makes it easy to customize all aspects of this application, for example, restrict user interaction or load the BPMN diagrams from your own data source. Features like the BPMN node visualizations and the specialized automatic layout are separate components that work in any yFiles-based project.

  1. Download the trial version of yFiles for your target platform at the yWorks Customer Center.

  2. Navigate to the source directory of the BPMN Editor Sample Application.

  3. Explore the sample application’s features and

    1. adjust its source code to match your requirements or

    2. copy the source code of the features you like to your own project.

Why yFiles?

Most complete solution

Since 2000, yWorks is dedicated to the creation of professional graph and diagramming software libraries. yWorks enables clients to realize even the most sophisticated visualization requirements to help them gain insights into their connected data. The yFiles family of software programming libraries is the most advanced and complete solution available on the market, supporting the broadest range of platforms, integrations, input methods, data sources, backends, IDEs, and programming languages.

Perfect match for all use-cases

yFiles not only lets you create your own customized applications but integrates well with your existing solutions and dashboards on the desktop, on mobile, and on the web. Developers can use concise, rich, complete APIs to create fresh, new applications and user experiences that match your corporate identity and exactly fit your specific use-cases. Browse and choose from hundreds of source code demos and integrations to get ideas and get started in no time.

Honest, simple licensing

yFiles enables white-label integrations into your applications, with royalty-free and perpetual licensing. There are no third party code dependencies.

Industry-leading automatic layouts

yFiles has got you covered with a complete set of fully configurable, extensible automatic layout algorithms, that not merely render the elements on the screen but help users understand their data and the relationships just by looking at the diagrams.

Unmatched customizability

Decades of work went into the creation of the most flexible, extensible, and easy to use diagramming APIs that are available on the market. Everything may be customized with yFiles: data acquisition and import, graph creation, display, interaction, animation, layout, export, printing, and third party service connectivity.

Algorithms included

With yFiles, you can analyze your graphs, connected data, and networks both on the fly and interactively with a complete set of efficient graph algorithm implementations. Calculate centrality measures, perform automatic clustering, calculate flows, run reachability algorithms, find paths, cycles, and dependencies. For the best user experience, use the results to drive the visualization, interactivity, and layout.

Unequaled developer productivity

Developers quickly create sophisticated diagramming applications with yFiles. The extensive API has been carefully designed and thoroughly documented. There are developers’ guides, source code tutorials, getting started videos, and fully documented source code demo applications, that help to realize even the most advanced features. Inline API documentation lookup for all major IDEs with hundreds of code snippets and linked related topics make writing robust code a breeze. Integration samples for many major third party systems help in getting productive, quickly.

Not just a static viewer

With yFiles, you can do more than just analyze and view your data. Create interactive, deeply integrated apps that don’t just let you consume data sources, but also enable users to create, modify, and work with both existing and changing data. Integrate with third party services to automatically trigger actions and apply updates. With yFiles, there are no limits: you decide what your app can do.

High-performance implementations

While it is recommended not to overwhelm the end-user with overly complex graph visualizations, of course, all aspects of the library have been prepared to work with large amounts of data. Developers can create both high-quality diagram visualizations and rich user-interactions, as well as configure algorithms and visualizations to perform great for even the largest graphs and networks.

Generic data acquisition

You don’t need to let your users create the diagrams from scratch or use a particular file format. yFiles enables you to import graphs from any data source which is accessible via an API. Programmatically build the in-memory model using an intuitive, powerful API. Update the diagram live in response to external events and changes.

World-class support

Get the best support for your development teams. Directly connect with more than a dozen core yFiles library developers to get answers to your questions. If you don’t have the time to do the implementation or your team is not large enough to do the implementation, let yWorks help you with consultancy and project work to get your team and apps up running, quickly.

Proven solution

Customers from all industries all over the world have been using yFiles for almost twenty years for both internal and customer-facing applications and tools. See the references for a non-conclusive list.

Frequently Asked Questions

What is yFiles?

yFiles is a software library that supports visualizing, editing, and analyzing graphs and graph-like diagrams. It is not a ready-to-use application or graph editor. Instead, it provides a component for graph visualization, graph editor features, and an extensive set of algorithms for automatic data arrangement and graph analysis. Software developers can use yFiles to display, edit, and analyze diagrams in their own applications. yFiles is available for many platforms.

Which platforms does yFiles support?

Right now, yFiles supports HTML / JavaScript, Java (Swing), JavaFX, .NET (WinForms), and WPF.

What kind of applications can I create with yFiles?

Developers can use concise, rich, complete APIs to create fresh, new applications, and user-experiences that match your corporate identity and exactly fit your specific use-cases. yFiles enables white-label integrations into your applications, with royalty-free and perpetual licensing. Any application that works with or displays relational data in the form of graphs, diagrams, and networks can be built with the help of yFiles.

What devices can I target with yFiles?

yFiles not only lets you create your own customized applications but integrates well with your existing solutions and dashboards on the desktop, mobile, and the web. There are versions of yFiles available for all major platforms and frameworks.

How extensive is the graph API of yFiles?

yFiles offers the most extensive graph layout, visualization, and analysis APIs available commercially. In total, there are around ten thousand public API members (classes, properties, methods, interfaces, enumerations). yFiles uses a clean, consistent, mostly object-oriented architecture that enables users to customize and (re-) use the available functionality to a great extent. API components can be (re-)combined, extended, configured, reused, and modified to a very high degree. It is not mandatory to know the complete API, of course. Most applications only require a minimal subset of the full functionality, and the advanced functionality and APIs may only be required for implementing unique requirements.

As a developer, what can I expect from yFiles?

yFiles helps developers quickly create sophisticated diagramming applications. The extensive API has been carefully designed and thoroughly documented. There are developers’ guides, source code tutorials, and fully documented complete source code demo applications that help to realize even the most advanced features. Inline API documentation lookup for all major IDEs with hundreds of code snippets and linked related topics help in writing robust code, efficiently. Integration samples for many major third party systems help in getting productive, quickly.

Is yFiles Free?

No. yFiles is a commercial software library. If you decide to use yFiles in your application, you’ll have to pay a one-time fee. You also have the option to subscribe annually for technical support and updates.

How does the licensing work for yFiles?

yFiles enables white-label integrations into your applications, with royalty-free and perpetual licensing. There are no third party code dependencies. Licensing basically works on a per developer basis. Please refer to the pricing information and software license agreements of the respective product for more details.

What kind of support can I get for yFiles?

The yFiles libraries come with fully documented demo applications, detailed API documentation, and extensive developers’ guides. Apart from that, yWorks also offers professional support services for your development teams. They can connect directly with more than a dozen core yFiles library developers to get answers to their programming questions. Optionally, if you don’t have the time or necessary team, yWorks can help you with consultancy and project work to get you and your apps up running quickly.

How is the release cycle for yFiles?

There is no public roadmap for yFiles. yFiles usually gets a new major feature release about every 10 to 15 months, with bugfixes or minor maintenance releases in between as required. Typically there are between one and five bugfix releases for each major release, and previous releases get important bugfixes, too. yWorks tries very hard to keep the libraries and APIs backward compatible so that customers can update to the newest version of yFiles regularly with little to no effort and still benefit from performance improvements and new features.

Can I edit my graphs with yFiles?

With yFiles, you can do more than just analyze and view your data. You can have interactive, deeply integrated apps that don’t just let you consume data sources but also enable users to create from scratch, modify, and work with both existing and changing data. Integrate with third party services to automatically trigger actions and apply updates in real-time and publish changes to third party systems while the user works with the graph. It’s up to you to decide what your app can do.

What kind of layouts does yFiles support?

yFiles comes with the most extensive set of fully configurable, extensible automatic layout algorithms, that not merely render the elements on the screen but help users understand their data and the relationships just by looking at the diagrams. yFiles includes hierarchic, organic (force-directed), orthogonal, tree-like, radial, balloon-like, and special purpose layouts. yFiles also supports incremental, partial, and interactive layouts, as well as various edge routing and automatic label placement algorithms.

Are the layout algorithms configurable?

Layout algorithms support various settings and constraints and are fully customizable in code. They support different node sizes, nested groups, bundled edges, orthogonally and octilinearly routed edges, consider and automatically place node, edge, and port labels. Nodes may be partitioned and clustered, and different layout styles can be mixed in the same diagram.

What kind of graph analysis does yFiles support?

yFiles lets you analyze your graphs, connected data, and networks both on the fly and interactively with a complete set of efficient graph algorithm implementations. Choose from a range of different centrality measure implementations, automatic clustering algorithms, network flow algorithms, reachability and connectivity algorithms, pathfinding variants, cycle, and dependency analysis algorithms. For the best user experience, use the results to drive the visualization, interactivity, and layout.

What parts of yFiles can be customized?

yFiles has the most flexible, extensible, and easy to use diagramming APIs that are available commercially. Every aspect of the functionality is customizable with options ranging from high-level configuration settings, down to low-level implementation overrides: data acquisition, import, graph creation, display, interaction, animation, layout, export, printing, and third party service connectivity.

How can I get my data into yFiles?

End-users don’t need to create the diagrams from sketch or use a specific file format. yFiles lets you import graphs from any data source that is accessible via an API. Developers can populate the in-memory model using an intuitive, powerful API, directly connecting to their preferred data sources. Diagrams can be updated live in response to external events and changes.

How can I get my diagrams data back from yFiles?

The in-memory graph model lets you export all the information to any system and file format. There are built-in export options to various file and image formats, but as a developer, you can create your own glue code to connect to arbitrary data storage systems and third party services.

Is the diagram size limited?

Theoretically, the only limiting factor for the number of graph elements is the size of the computer’s memory. In practice, performance is also a limiting factor. For the vast majority of use-cases, yFiles delivers best-in-class performance out-of-the-box. For very large visualizations and data-sets, there are options available that let developers tune between features, running-time, and quality of the results. yFiles can deal with graphs of any size and is only bound by the memory available and the runtime complexity of the algorithms. Large graphs may require adjusting the default settings and performance depends on more than just the number of elements in the diagram, but also the structure of the graph, the algorithm and configuration, as well as platform and hardware capabilities.

Who is using yFiles, already?

Customers from almost all industries all over the planet have been using yFiles for nearly twenty years, to create both internal and customer-facing applications and tools. Clients include both single developers and the largest corporations and organizations in all of academia, public and governmental services, and of course, the commercial space. See the references for a non-conclusive list. Naturally, there are the big well-known software corporations among yWorks’ customers (unfortunately only some of them allow yWorks to list them on the references page), but there’s also a great lot of companies that are not traditionally known for software, but who still have their own IT departments create software for their intranet or customer-facing applications. And last but not least, smaller companies without IT departments that let third party implementors create useful diagramming applications with the help of yFiles for them. yFiles at its core is a generic diagramming component that is use-case agnostic and can be used to create graph and diagramming-centric applications for any business domain that requires working with or displaying connected data.

How long did it take to implement yFiles?

yFiles started as a university project at the University of Tübingen in the late 1990s. Since 2000, yWorks has taken over all development and has been working continuously with a core layout-team of two to eight developers on improving the layout algorithms. The layout algorithms alone, as of 2021, took more than seventy development years to implement. A team of more than 25 developers has been working on the implementation for the visualization and interaction and the support for the various platforms yFiles supports, totaling in more than a hundred years of development for the visualization. Porting yFiles to a new platform in the past took between three and about 15 development years. Most platform variations were implemented in between six and ten calendar months.

How long has yFiles been around?

yFiles started as a university project at the University of Tübingen in the late 1990s. The company yWorks was founded as a spin-off of the university in 2000 when the first commercial customers wanted a license for yFiles. Since then, it has been developing and improving the library. It all started as a Java library, and over time, yWorks improved and even rewrote large parts of the library to add new features and support new platforms.

Who is the company behind yFiles?

yWorks is the company behind yFiles. It was founded as a spin-off of the University of Tübingen in the year 2000 specifically for licensing and supporting yFiles commercially. The German company is a privately-held, headquartered in Tübingen. More than 30 employees are working at yWorks, over 20 of which are developers, working on yFiles and the tooling around the libraries. The library developers also provide support and implementation services to yFiles customers. So as a developer, you will get first-class, highest level support directly from the team that implements the libraries.

What does yWorks specialize in?

Since 2000, yWorks is dedicated to the creation of professional graph and diagramming software libraries. The software yWorks creates, enables customers to realize even the most sophisticated visualization requirements to help them gain insights into their connected data. Their main product is the software programming library family yFiles, which is the most sophisticated and complete solution available for diagramming applications on the market, supporting the broadest range of platforms, integrations, input methods, data sources, backends, IDEs, and programming languages. yWorks has set a track-record in providing the most extensive layout and diagramming solutions for developers on all major platforms. In addition to creating, maintaining and supporting the libraries, yWorks also provides professional consultancy services in the area of visualization and diagramming. In addition to that, yWorks also provides a set of smaller software tools, both free and commercial, end-user facing and for software developers, closed-source and open-source.

Does yWorks own all the intellectual property for yFiles?

yFiles does not depend on any third party library, except of course at runtime, where it depends on the runtime of the platform. yWorks owns the IP for all implementations in the core yFiles library. Some demos show the integration and make use of third party software, but they are not required for other cases.

Which papers and algorithms does yFiles implement?

The list of algorithms implemented by yFiles is long. For the common graph algorithms, we use the traditional implementations with the standard optimizations. For many of the layout algorithms, ideas for the implementation base on publicly available papers. Some algorithms (specifically the orthogonal layout and the balloon layout) we created and helped with the creation of the algorithms and (co-)published the papers for the algorithms. Most layout algorithms have been vastly modified, tuned, and enhanced, though, and don’t follow the original implementation ideas, anymore. yWorks added useful features to these implementations to make the algorithms work in less theoretical environments. We removed previously existing constraints of the original implementations and added new ideas to make the algorithms useful for real-world usage. For most of these changes and improvements, no papers have been published.

Can I get the papers for the layout algorithms used in yFiles?

For some of the algorithms, you will find papers that describe the core idea of the layout algorithms. For most algorithms, yWorks massively enhanced and modified the algorithms to support more advanced features that are frequently required in real-world diagrams. For these modifications, we did not publish any papers. As a commercial yFiles customer, you can obtain a license to the source code of yFiles where you can read, learn about, and modify the algorithms in documented source code form, according to the license terms.

Hide Description
Open in yEd LiveDownload