Hero image for Exploring Relations in a Diagram

Exploring Relations in a Diagram

Emphasize an item and its neighborhood in either the original diagram using highlights, or a separate diagram component

When looking at a diagram of graphs or networks, it is often interesting to see which nodes (the objects, also vertices) are in close relation to each other. These nodes are usually connected by edges (the lines or links).

Small and spare graphs often have only short edges with no or only a few crossings. This makes it easy to spot all nodes connected to one specific node (also called the direct neighborhood of the node). However, for larger and denser, graphs long edges with several crossings make it difficult to visually follow the edges and identify the neighborhood of a node. For this use case, the neighborhood should either be highlightedhighlighted or displayed in a separate filtered viewfiltered view.

Highlighting the Neighborhood

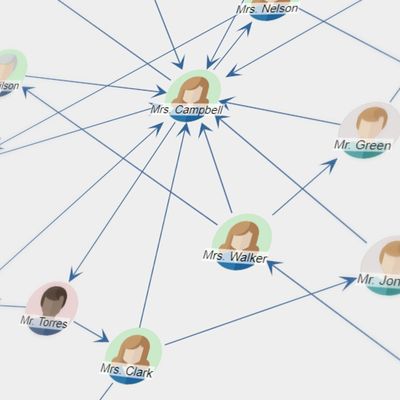
As long as all neighbors are visible on the screen, it is sufficient to highlight all neighbors of a hovered or clicked node:

Highlighted neighborhood of a node

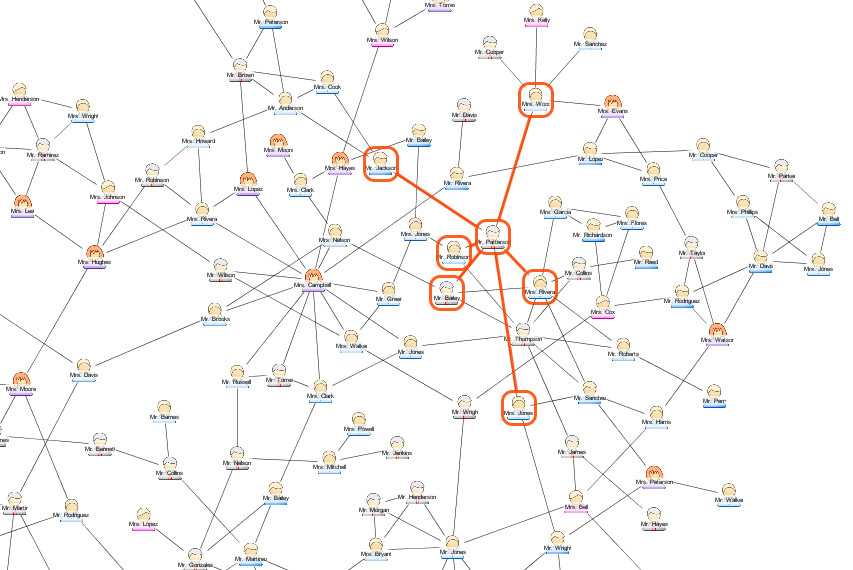
Unfortunately, this straightforward approach also has some disadvantages:

  • It doesn’t work for nodes outside of the screen.

  • The neighborhood nodes may still be quite far away from each other, which makes it hard to consider them together.

  • The other nodes and edges distract the eye.

  • The relations between the neighborhood nodes are difficult to grasp.

Adding a Filtered Neighborhood View

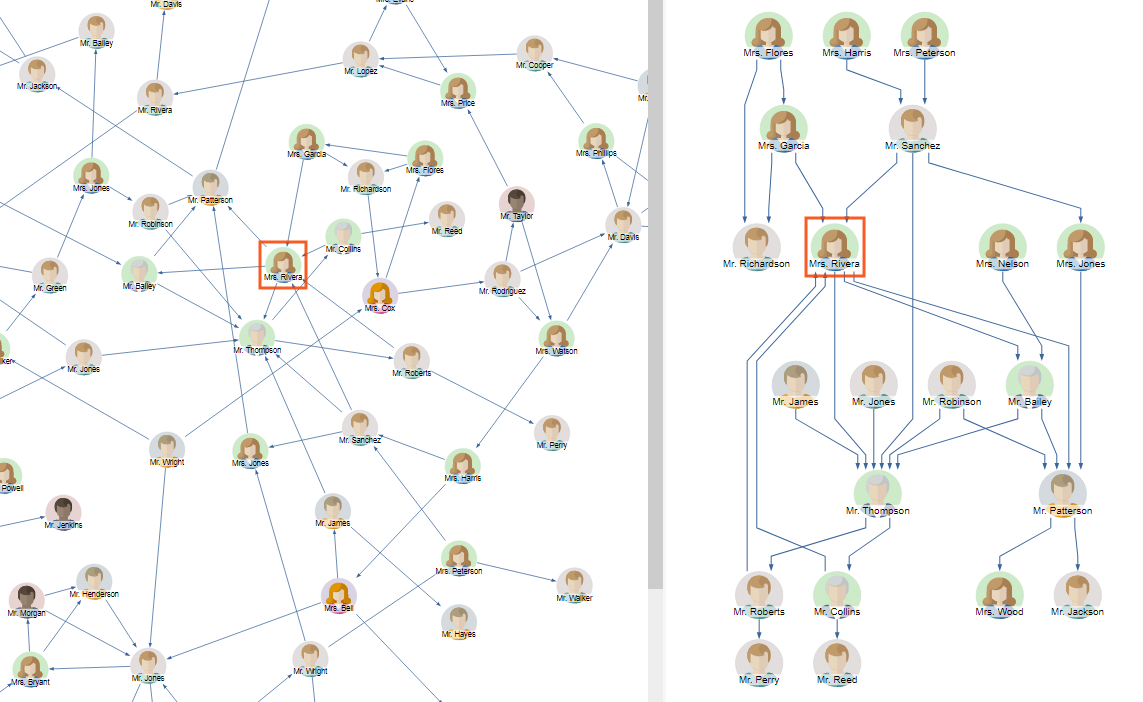
A solution solving the problems mentioned above is to use a separate filtered view containing only the node and its neighborhood. Such a view also allows for rearranging these nodes to pack them closer together and show their interrelations:

Separate Neighborhood View

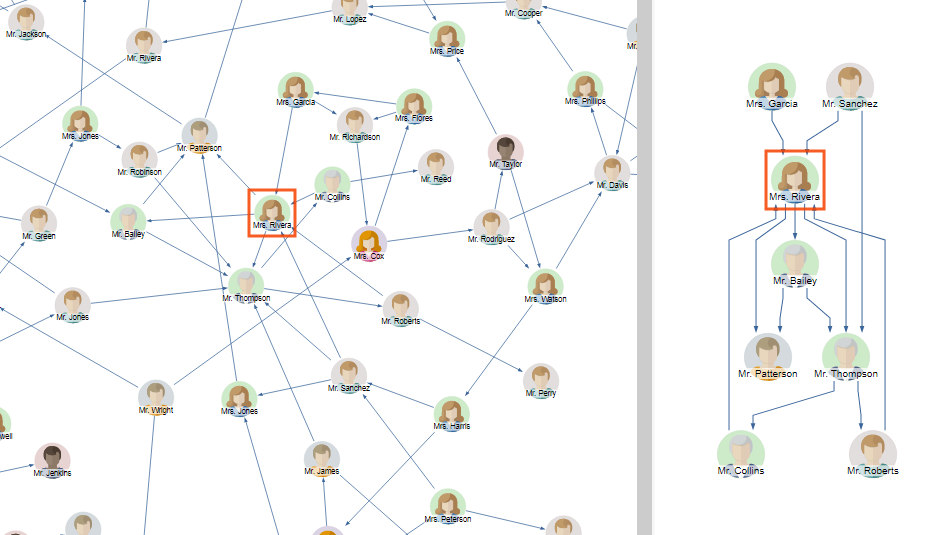
As this separate view is quite compact, it can even be used to include the neighbors of the neighbors (also called the neighborhood of depth 2) or even more distant relatives.

View of Neighborhood with depth 2

Example and Source Code

With yFiles, neighborhood views can be realized on all supported platforms. yFiles for HTML comes with a Neighborhood View Sample Application. This example provides some sample graphs and a neighborhood view for the clicked node. The depth of the neighborhood can easily be changed. It can also be restricted to only consider incoming or outgoing edges when collecting the neighborhood nodes.

The source code of the Neighborhood View Sample Application is available on GitHub and part of the yFiles for HTML package.

Add a Neighborhood View to Your Own Application

Test the yFiles neighborhood view with a fully-functional trial package of yFiles for HTML.

To add a neighborhood view to your own application, start with the Neighborhood View Sample Application that is part of the yFiles for HTML package. It’s not only a showcase application but also provides the source code of a neighborhood view component that you can re-use in your own project. This component is designed to work in any yFiles-based project without modifications, but you can also easily customize it to match your requirements.

  1. Download the trial version of yFiles for HTML at the yWorks Customer Center.

  2. Navigate to the source directory of the Neighborhood View Sample Application and copy its neighborhood view component to your project.

  3. See the source code of the main application file for setup instructions.

  4. Optionally, adjust the component to your requirements.

Why yFiles for HTML?

Most complete solution

Since 2000, yWorks is dedicated to the creation of professional graph and diagramming software libraries. yWorks enables clients to realize even the most sophisticated visualization requirements to help them gain insights into their connected data. The yFiles family of software programming libraries is the most advanced and complete solution available on the market, supporting the broadest range of platforms, integrations, input methods, data sources, backends, IDEs, and programming languages.

Perfect match for all use-cases

yFiles not only lets you create your own customized applications but integrates well with your existing solutions and dashboards on the desktop, on mobile, and on the web. Developers can use concise, rich, complete APIs to create fresh, new applications and user experiences that match your corporate identity and exactly fit your specific use-cases. Browse and choose from hundreds of source code demos and integrations to get ideas and get started in no time.

Honest, simple licensing

yFiles enables white-label integrations into your applications, with royalty-free and perpetual licensing. There are no third party code dependencies.

Industry-leading automatic layouts

yFiles has got you covered with a complete set of fully configurable, extensible automatic layout algorithms, that not merely render the elements on the screen but help users understand their data and the relationships just by looking at the diagrams.

Unmatched customizability

Decades of work went into the creation of the most flexible, extensible, and easy to use diagramming APIs that are available on the market. Everything may be customized with yFiles: data acquisition and import, graph creation, display, interaction, animation, layout, export, printing, and third party service connectivity.

Algorithms included

With yFiles, you can analyze your graphs, connected data, and networks both on the fly and interactively with a complete set of efficient graph algorithm implementations. Calculate centrality measures, perform automatic clustering, calculate flows, run reachability algorithms, find paths, cycles, and dependencies. For the best user experience, use the results to drive the visualization, interactivity, and layout.

Unequaled developer productivity

Developers quickly create sophisticated diagramming applications with yFiles. The extensive API has been carefully designed and thoroughly documented. There are developers’ guides, source code tutorials, getting started videos, and fully documented source code demo applications, that help to realize even the most advanced features. Inline API documentation lookup for all major IDEs with hundreds of code snippets and linked related topics make writing robust code a breeze. Integration samples for many major third party systems help in getting productive, quickly.

Not just a static viewer

With yFiles, you can do more than just analyze and view your data. Create interactive, deeply integrated apps that don’t just let you consume data sources, but also enable users to create, modify, and work with both existing and changing data. Integrate with third party services to automatically trigger actions and apply updates. With yFiles, there are no limits: you decide what your app can do.

High-performance implementations

While it is recommended not to overwhelm the end-user with overly complex graph visualizations, of course, all aspects of the library have been prepared to work with large amounts of data. Developers can create both high-quality diagram visualizations and rich user-interactions, as well as configure algorithms and visualizations to perform great for even the largest graphs and networks.

Generic data acquisition

You don’t need to let your users create the diagrams from scratch or use a particular file format. yFiles enables you to import graphs from any data source which is accessible via an API. Programmatically build the in-memory model using an intuitive, powerful API. Update the diagram live in response to external events and changes.

World-class support

Get the best support for your development teams. Directly connect with more than a dozen core yFiles library developers to get answers to your questions. If you don’t have the time to do the implementation or your team is not large enough to do the implementation, let yWorks help you with consultancy and project work to get your team and apps up running, quickly.

Proven solution

Customers from all industries all over the world have been using yFiles for almost twenty years for both internal and customer-facing applications and tools. See the references for a non-conclusive list.

100% client-side solution

yFiles for HTML does not require an active server component. It can be combined with any server technology. yFiles for HTML solely consists of a set of JavaScript files, an optional CSS file, and only requires an HTML page to host the visualization. yFiles for HTML-powered applications will not put a lot of load onto the server, and with caching enabled, they will be a one-time download and can run without an active internet connection, even directly from the file system, or as a PWA.

Runs in Node.js

If no visualization is required, yFiles for HTML-powered applications can run in a Node.js process and calculate layouts or run graph algorithms.

Latest drawing technologies

yFiles for HTML uses SVG, WebGL 1&2, and HTML5 Canvas to draw graphs and diagrams. The three technologies may be combined and used at the same time to get the best of all technologies, creating the ultimate user experience. Use the power of WebGL to render very large graphs together with the fidelity and ease of development of SVG in conjunction with CSS styling, animations, and transitions to draw beautiful diagrams.

Use your preferred programming language

yFiles for HTML is implemented as a pure JavaScript library that requires ECMAScript 5 at minimum at runtime. The API supports newer features of ECMAScript 2015+, though, and developers may use the library with the most current JavaScript features. For TypeScript development and GWT development, a complete set of type definitions is available, too.

Frequently Asked Questions

What is yFiles?

yFiles is a software library that supports visualizing, editing, and analyzing graphs and graph-like diagrams. It is not a ready-to-use application or graph editor. Instead, it provides a component for graph visualization, graph editor features, and an extensive set of algorithms for automatic data arrangement and graph analysis. Software developers can use yFiles to display, edit, and analyze diagrams in their own applications. yFiles is available for many platforms.

Which platforms does yFiles support?

Right now, yFiles supports HTML / JavaScript, Java (Swing), JavaFX, .NET (WinForms), and WPF.

What kind of applications can I create with yFiles?

Developers can use concise, rich, complete APIs to create fresh, new applications, and user-experiences that match your corporate identity and exactly fit your specific use-cases. yFiles enables white-label integrations into your applications, with royalty-free and perpetual licensing. Any application that works with or displays relational data in the form of graphs, diagrams, and networks can be built with the help of yFiles.

What devices can I target with yFiles?

yFiles not only lets you create your own customized applications but integrates well with your existing solutions and dashboards on the desktop, mobile, and the web. There are versions of yFiles available for all major platforms and frameworks.

How extensive is the graph API of yFiles?

yFiles offers the most extensive graph layout, visualization, and analysis APIs available commercially. In total, there are around ten thousand public API members (classes, properties, methods, interfaces, enumerations). yFiles uses a clean, consistent, mostly object-oriented architecture that enables users to customize and (re-) use the available functionality to a great extent. API components can be (re-)combined, extended, configured, reused, and modified to a very high degree. It is not mandatory to know the complete API, of course. Most applications only require a minimal subset of the full functionality, and the advanced functionality and APIs may only be required for implementing unique requirements.

As a developer, what can I expect from yFiles?

yFiles helps developers quickly create sophisticated diagramming applications. The extensive API has been carefully designed and thoroughly documented. There are developers’ guides, source code tutorials, and fully documented complete source code demo applications that help to realize even the most advanced features. Inline API documentation lookup for all major IDEs with hundreds of code snippets and linked related topics help in writing robust code, efficiently. Integration samples for many major third party systems help in getting productive, quickly.

Is yFiles Free?

No. yFiles is a commercial software library. If you decide to use yFiles in your application, you’ll have to pay a one-time fee. You also have the option to subscribe annually for technical support and updates.

How does the licensing work for yFiles?

yFiles enables white-label integrations into your applications, with royalty-free and perpetual licensing. There are no third party code dependencies. Licensing basically works on a per developer basis. Please refer to the pricing information and software license agreements of the respective product for more details.

What kind of support can I get for yFiles?

The yFiles libraries come with fully documented demo applications, detailed API documentation, and extensive developers’ guides. Apart from that, yWorks also offers professional support services for your development teams. They can connect directly with more than a dozen core yFiles library developers to get answers to their programming questions. Optionally, if you don’t have the time or necessary team, yWorks can help you with consultancy and project work to get you and your apps up running quickly.

How is the release cycle for yFiles?

There is no public roadmap for yFiles. yFiles usually gets a new major feature release about every 10 to 15 months, with bugfixes or minor maintenance releases in between as required. Typically there are between one and five bugfix releases for each major release, and previous releases get important bugfixes, too. yWorks tries very hard to keep the libraries and APIs backward compatible so that customers can update to the newest version of yFiles regularly with little to no effort and still benefit from performance improvements and new features.

Can I edit my graphs with yFiles?

With yFiles, you can do more than just analyze and view your data. You can have interactive, deeply integrated apps that don’t just let you consume data sources but also enable users to create from scratch, modify, and work with both existing and changing data. Integrate with third party services to automatically trigger actions and apply updates in real-time and publish changes to third party systems while the user works with the graph. It’s up to you to decide what your app can do.

What kind of layouts does yFiles support?

yFiles comes with the most extensive set of fully configurable, extensible automatic layout algorithms, that not merely render the elements on the screen but help users understand their data and the relationships just by looking at the diagrams. yFiles includes hierarchic, organic (force-directed), orthogonal, tree-like, radial, balloon-like, and special purpose layouts. yFiles also supports incremental, partial, and interactive layouts, as well as various edge routing and automatic label placement algorithms.

Are the layout algorithms configurable?

Layout algorithms support various settings and constraints and are fully customizable in code. They support different node sizes, nested groups, bundled edges, orthogonally and octilinearly routed edges, consider and automatically place node, edge, and port labels. Nodes may be partitioned and clustered, and different layout styles can be mixed in the same diagram.

What kind of graph analysis does yFiles support?

yFiles lets you analyze your graphs, connected data, and networks both on the fly and interactively with a complete set of efficient graph algorithm implementations. Choose from a range of different centrality measure implementations, automatic clustering algorithms, network flow algorithms, reachability and connectivity algorithms, pathfinding variants, cycle, and dependency analysis algorithms. For the best user experience, use the results to drive the visualization, interactivity, and layout.

What parts of yFiles can be customized?

yFiles has the most flexible, extensible, and easy to use diagramming APIs that are available commercially. Every aspect of the functionality is customizable with options ranging from high-level configuration settings, down to low-level implementation overrides: data acquisition, import, graph creation, display, interaction, animation, layout, export, printing, and third party service connectivity.

How can I get my data into yFiles?

End-users don’t need to create the diagrams from sketch or use a specific file format. yFiles lets you import graphs from any data source that is accessible via an API. Developers can populate the in-memory model using an intuitive, powerful API, directly connecting to their preferred data sources. Diagrams can be updated live in response to external events and changes.

How can I get my diagrams data back from yFiles?

The in-memory graph model lets you export all the information to any system and file format. There are built-in export options to various file and image formats, but as a developer, you can create your own glue code to connect to arbitrary data storage systems and third party services.

Is the diagram size limited?

Theoretically, the only limiting factor for the number of graph elements is the size of the computer’s memory. In practice, performance is also a limiting factor. For the vast majority of use-cases, yFiles delivers best-in-class performance out-of-the-box. For very large visualizations and data-sets, there are options available that let developers tune between features, running-time, and quality of the results. yFiles can deal with graphs of any size and is only bound by the memory available and the runtime complexity of the algorithms. Large graphs may require adjusting the default settings and performance depends on more than just the number of elements in the diagram, but also the structure of the graph, the algorithm and configuration, as well as platform and hardware capabilities.

Who is using yFiles, already?

Customers from almost all industries all over the planet have been using yFiles for nearly twenty years, to create both internal and customer-facing applications and tools. Clients include both single developers and the largest corporations and organizations in all of academia, public and governmental services, and of course, the commercial space. See the references for a non-conclusive list. Naturally, there are the big well-known software corporations among yWorks’ customers (unfortunately only some of them allow yWorks to list them on the references page), but there’s also a great lot of companies that are not traditionally known for software, but who still have their own IT departments create software for their intranet or customer-facing applications. And last but not least, smaller companies without IT departments that let third party implementors create useful diagramming applications with the help of yFiles for them. yFiles at its core is a generic diagramming component that is use-case agnostic and can be used to create graph and diagramming-centric applications for any business domain that requires working with or displaying connected data.

How long did it take to implement yFiles?

yFiles started as a university project at the University of Tübingen in the late 1990s. Since 2000, yWorks has taken over all development and has been working continuously with a core layout-team of two to eight developers on improving the layout algorithms. The layout algorithms alone, as of 2021, took more than seventy development years to implement. A team of more than 25 developers has been working on the implementation for the visualization and interaction and the support for the various platforms yFiles supports, totaling in more than a hundred years of development for the visualization. Porting yFiles to a new platform in the past took between three and about 15 development years. Most platform variations were implemented in between six and ten calendar months.

How long has yFiles been around?

yFiles started as a university project at the University of Tübingen in the late 1990s. The company yWorks was founded as a spin-off of the university in 2000 when the first commercial customers wanted a license for yFiles. Since then, it has been developing and improving the library. It all started as a Java library, and over time, yWorks improved and even rewrote large parts of the library to add new features and support new platforms.

Who is the company behind yFiles?

yWorks is the company behind yFiles. It was founded as a spin-off of the University of Tübingen in the year 2000 specifically for licensing and supporting yFiles commercially. The German company is a privately-held, headquartered in Tübingen. More than 30 employees are working at yWorks, over 20 of which are developers, working on yFiles and the tooling around the libraries. The library developers also provide support and implementation services to yFiles customers. So as a developer, you will get first-class, highest level support directly from the team that implements the libraries.

What does yWorks specialize in?

Since 2000, yWorks is dedicated to the creation of professional graph and diagramming software libraries. The software yWorks creates, enables customers to realize even the most sophisticated visualization requirements to help them gain insights into their connected data. Their main product is the software programming library family yFiles, which is the most sophisticated and complete solution available for diagramming applications on the market, supporting the broadest range of platforms, integrations, input methods, data sources, backends, IDEs, and programming languages. yWorks has set a track-record in providing the most extensive layout and diagramming solutions for developers on all major platforms. In addition to creating, maintaining and supporting the libraries, yWorks also provides professional consultancy services in the area of visualization and diagramming. In addition to that, yWorks also provides a set of smaller software tools, both free and commercial, end-user facing and for software developers, closed-source and open-source.

Does yWorks own all the intellectual property for yFiles?

yFiles does not depend on any third party library, except of course at runtime, where it depends on the runtime of the platform. yWorks owns the IP for all implementations in the core yFiles library. Some demos show the integration and make use of third party software, but they are not required for other cases.

Which papers and algorithms does yFiles implement?

The list of algorithms implemented by yFiles is long. For the common graph algorithms, we use the traditional implementations with the standard optimizations. For many of the layout algorithms, ideas for the implementation base on publicly available papers. Some algorithms (specifically the orthogonal layout and the balloon layout) we created and helped with the creation of the algorithms and (co-)published the papers for the algorithms. Most layout algorithms have been vastly modified, tuned, and enhanced, though, and don’t follow the original implementation ideas, anymore. yWorks added useful features to these implementations to make the algorithms work in less theoretical environments. We removed previously existing constraints of the original implementations and added new ideas to make the algorithms useful for real-world usage. For most of these changes and improvements, no papers have been published.

Can I get the papers for the layout algorithms used in yFiles?

For some of the algorithms, you will find papers that describe the core idea of the layout algorithms. For most algorithms, yWorks massively enhanced and modified the algorithms to support more advanced features that are frequently required in real-world diagrams. For these modifications, we did not publish any papers. As a commercial yFiles customer, you can obtain a license to the source code of yFiles where you can read, learn about, and modify the algorithms in documented source code form, according to the license terms.

Is a server required to host a graph drawing application?

yFiles for HTML does not require an active server component. As such, any server technology that can serve static HTML pages and JavaScript will do. yFiles solely consists of a set of JavaScript files, a CSS file, and an HTML page to host the visualization app. With caching enabled and properly configured, yFiles for HTML-powered apps can be a one-time download and can run without an active internet connection, even directly from the file-system.

Can I run yFiles for HTML graph drawing apps on the desktop?

With technologies like NW.js, Electron, Visual Studio Code, and Webkit, yFiles for HTML runs in native applications on the desktop and other devices. The visualization engine requires an HTML-5 compliant browser engine with a working DOM implementation and JavaScript support with at least ECMAScript 5. yFiles for HTML can run in a Node.js process and calculate layouts and run graph algorithms without a viewer component.

Can yFiles for HTML powered graph apps run on the server?

The visualization engine requires an HTML-5 compliant browser engine with a working DOM implementation and JavaScript support with at least ECMAScript 5. Technologies like Puppeteer and Webkit provide these features on a headless server. If no visualization is required, yFiles for HTML can run in a Node.js process and calculate layouts and run graph algorithms without a visible view.

What rendering technology does yFiles for HTML use for drawing graphs?

yFiles for HTML uses SVG, WebGL 1, WebGL 2, and HTML5 Canvas to draw graphs and diagrams. SVG, together with CSS styling, animations, and transitions creates beautiful, high-fidelity diagram visualizations. WebGL can provide the performance to render even the largest graphs. Combine all technologies and use them at the same time in the same diagram to get the best possible user experience.

Does yFiles support rendering graphs using WebGL?

WebGL is a modern, low-level rendering technology employed in modern browsers. yFiles supports using WebGL 1 and WebGL 2 for rendering large-scale, simple graph visualizations. yFiles comes with optimized built-in default visualizations that use WebGL, but developers may use the full WebGL API to render contents into a yFiles diagram. yFiles supports rendering SVG, Canvas, and WebGL in the same diagram. For medium-sized graphs, using SVG often is the preferred choice due to simplicity, versatility, and performance. With the WebGL2 rendering backend the size of the graphs is mostly limited by the performance of the graphics card adapter, only. Millions of elements can be rendered smoothly at the same time on the screen in an animated fashion, even with lower-end dedicated graphics card adapters.

Does yFiles use HTML5 Canvas for rendering graphs?

Canvas is a low-level rendering technology employed by most of today’s browsers. yFiles supports using Canvas for rendering large-scale, simple graph visualizations, and for rendering bitmap effects in the visualization. yFiles’ default styles usually use SVG or WebGL, but developers may use the full Canvas API to render contents into a yFiles diagram. yFiles supports renderings with all three technologies at the same time in the same diagram. For medium-sized graphs, using SVG often is the preferred choice due to simplicity, versatility, and performance.

Is yFiles using SVG for rendering graphs?

For medium-sized graphs, using SVG often is the preferred choice due to simplicity, versatility, and performance. But yFiles supports renderings with SVG, HTML5 Canvas, and WebGL at the same time in the same diagram. SVG creates high-fidelity vector graphics that work great for medium-sized diagrams and support CSS styling, animations, and transitions, as well as perfect text rendering on all supported browsers.

Can I create my diagramming app using TypeScript?

The API of yFiles for HTML has been designed carefully to work perfectly in a TypeScript environment. A complete TypeScript type definition file makes use of advanced TypeScript features such as nullability, interfaces, enumerations, generics, subclassing, union types, overloads, asynchronous programming, and more. yFiles for HTML is also available as an npm module, which makes the inclusion of the library in any modern project a breeze.

Can I use CSS for styling and animating my graphs?

One of the three main rendering technologies used by yFiles is SVG. SVG works on the DOM level and can be conveniently styled and animated using CSS3 transitions and animations. Native CSS transitions and animations don’t block the main thread and work smoothly even on slower devices on modern browsers. As such, they can outperform Canvas- and WebGL-based solutions.

Is yFiles available as a node module on npm?

yFiles does not have any third party dependencies and at its core only consists of several JavaScript files and a CSS file. The package contains a package.json file that can be used with the npm pack command to create a npm package of yFiles. Licensees may put this npm package into private npm registries or file repositories for convenient installation using npm or yarn. yFiles for HTML is not currently available for the public on npmjs.org.

Is the source code available for yFiles for HTML?

The sources for yFiles for HTML come in a minified, optimized form. Licensees have the option to get a non-minified debugging variant of yFiles for HTML. There is also the option to get the complete sources of yFiles for HTML with the right to modify and distribute derived versions of the library with custom applications.

Can I use GWT to create my graph application?

yFiles for HTML is a native JavaScript library for which complete GWT bindings exist. This enables GWT developers to author high-quality graph visualization web applications using the Java programming language. The GWT bindings for yFiles for HTML support various customizations. Developers may create custom subclasses of library classes and implement interfaces as well as use the complete API to author their graph applications.

Can I print my graphs from my web application?

yFiles for HTML provides mechanics to print your graphs. With SVG styles, you get high-quality print-outs. You can use poster printing and add custom headers, footers, and other content to print documents. There is no active server component required for operation.

Can I export my graphs as images from my web application?

yFiles for HTML provides several options for exporting your graphs from your web applications. The native export consists of an SVG export with high fidelity vector graphics when using SVG styles. HTML5 Canvas-based styles and WebGL-based styles are included as bitmap images inside the SVG. The resulting SVG contains all visuals and can be exported as is, to bitmap files (PNG), and PDF files (with the free svg2pdf.js third party plugin).

Can I export my graphs in other formats?

The native format for file import and export in yFiles for HTML is GraphML, which preserves the graph structure, stylistic information, and custom business data. As a lighter-weight format, JSON is often preferred if some of the data can be easily re-computed or isn’t necessary to be serialized. yFiles for HTML also has a separate companion product that adds export capability to Microsoft Visio®'s .vsdx file format, while preserving full graphical fidelity as well as editability of the graph.

Does yFiles support creating web applications for iOS and Android?

yFiles for HTML is a pure JavaScript library that leverages SVG, Canvas, WebGL, and ECMAScript 5+. It runs on any major HTML5 compliant browser released since Internet Explorer 9. This, of course, includes the native iOS and Android browsers. Also, yFiles for HTML has built-in support for touch and pen input and does not require a mouse or connected physical keyboard.

Can I use React to create my graph application?

yFiles for HTML is framework agnostic and does not have any third party dependencies. It integrates well with all major UI frameworks and has been specifically tested and prepared to work well with React and its related frameworks. You can use the npm module variant of yFiles for HTML to build modern React components and applications, using both JavaScript and TypeScript. You can even use React components to render your SVG node templates.

Can I use Vue.js to create my graph application?

yFiles for HTML is framework agnostic and does not have any third party dependencies. It integrates well with all major UI frameworks and has been specifically tested and prepared to work well with Vue.js. You can use the npm module variant of yFiles for HTML to build modern Vue.js components and applications, using both JavaScript and TypeScript. You can even use Vue.js components to render your SVG node templates.

Can I use Angular to create my graph application?

yFiles for HTML is framework agnostic and does not have any third party dependencies. It integrates well with all major UI frameworks and has been specifically tested and prepared to work well with Angular and the Angular CLI. You can use the npm module variant of yFiles for HTML to build modern Angular components and applications, using both JavaScript and TypeScript. You can even use Angular components to render your SVG node templates.

Can I use my UI framework to create my graph application?

yFiles for HTML is framework agnostic and does not have any third party dependencies. It integrates well with all major UI frameworks and has been specifically designed to not conflict with well-behaved third party UI frameworks. The npm module variant of yFiles for HTML can be used like other npm packages to build modern components and applications, using both JavaScript and TypeScript. If your UI framework provides the ability to specify some CSS rules, to run JavaScript, and access to insert or upgrade a DOM div element, it should be no problem to embed the yFiles graph component. Please contact our technical support team should you run into any issues.

Does yFiles use D3.js for rendering graphs?

No. yFiles for HTML uses its own rendering technology that supports both SVG, HTML5 Canvas, and WebGL at the same time. The rendering engine uses virtualization to be able to deal with larger visualizations, too. Developers can use D3.js to augment the visualization in yFiles for HTML, e.g., to render bar charts inside node visualizations or to map scalar values to colors in the visualization.

Can I use data binding for rendering my graphs?

Yes. yFiles supports data binding on different levels. Developers can use data binding to bind the visualization for nodes, edges, ports, and labels to properties in the underlying business data. Reactive templating and binding libraries like Angular, React, Vue.js, Svelte, or D3.js can be used for the rendering. yFiles also comes with a simple, built-in, third-party-code-free templating engine for the visualization of graph items. Binding the structure of the graph to reactive business data is also possible.

Is there a low-code version of yFiles for me to get started?

Yes! If you are new to yFiles, the App Generator can help you create and scaffold your first yFiles-powered app withing just minutes. You can interactively configure your data-sources, choose you UI-framework and programming language, and share your project ideas with your team and customers.

Can I use JSON to load my graphs?

The yFiles for HTML programming API allows developers to create graphs from any data source they have access to. There are utility classes that help in quickly parsing and converting both simple and complex data structures into graph visualizations.

How can I load my graphs from the server?

Any technology that is available in a user agent can be used for loading graphs from the server. This includes REST APIs, but also custom binary protocols that work over WebSockets, as well as XML, JSON, plain-text, etc.

Do I need server-side rendering to render my diagrams?

No. The visualization part of yFiles for HTML is an interactive JavaScript component that runs inside the browser on the client. As such, rendering the diagram on the server would not result in an interactive diagram, but rather a static image. yFiles for HTML does not require an active server component, and the page that hosts the diagram component can be rendered on the server with static server-side rendering techniques that create the complete DOM on the server. yFiles for HTML still needs to be loaded on the client to provide interactive features like zooming, scrolling, editing, and animating the diagram.

Hide Description
Open in yEd LiveDownload