Interactive Decision Tree Diagrams
Interactively exploring a filtered decision tree helps to keep a clear view of the decision process
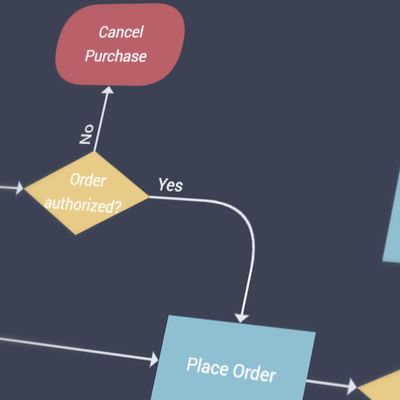
A decision tree guides a user from an initial question into one of the multiple possible end states. Each step along the decision process presents a choice that will branch down further until the user reaches a result. Often these trees consist only of a few steps and can be well provided as a static visualizationstatic visualization. However, adding interactionadding interaction improves the user experience and readability. For more complex diagrams, filtering the tree and interactively exploring it can be crucial to avoid infeasibly large, chaotic graphs.

Limitations of Static Decision Trees
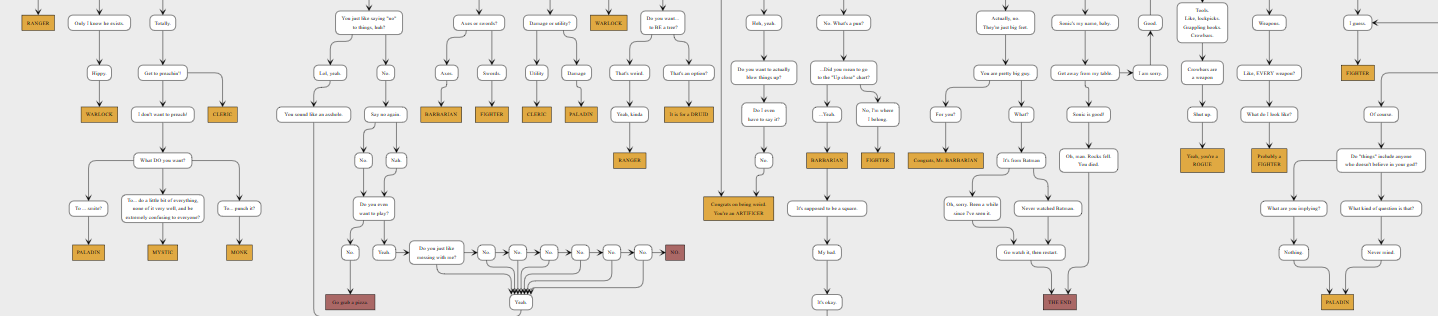
In static visualizations, all possible states and options have to be displayed. Options that can be reached using different decision routes either have to be duplicated or connected with cross or back-links, which both reduce the readability.
As the user should nevertheless easily grasp the current options and their consecutive steps, it is essential to use a suitable arrangement (i.e., layout) to facilitate this task. A well readable decision tree should emphasize the decision flow through the tree that is typically either from top to bottom or from left to right. However, node arrangements that follow this style usually keep succeeding steps close to their parents and produce visualizations with high width. Also, they introduce long cross and back-links that are hard to follow.
Another drawback of the static visualizations is that the user not only sees all possible branches beforehand but especially the consequences of each option before making a decision. Even though this may be irrelevant for some diagrams, it is entirely undesired for others.
Exploring a Decision Tree Interactively
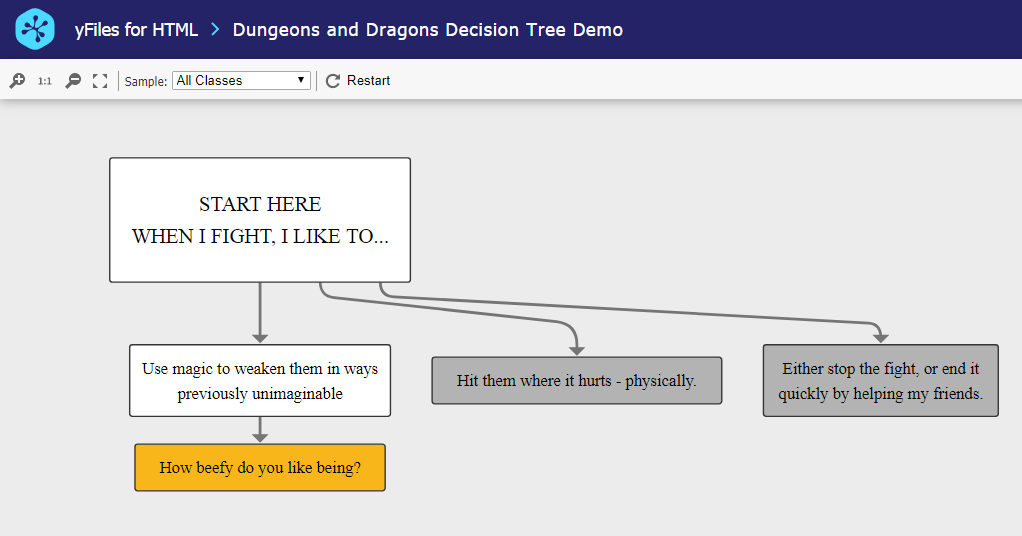
Hiding all branches not yet taken reduces the complexity of the diagram and conceals the consequences of a decision. This reduced diagram is easy to grasp and focuses only on the chosen decision route.
In the beginning, only the initial decision step is visible. When a user selects an option, the result of this choice and the next decision step appear in the visualization. The challenging task is to add these new elements (nodes/edges) in the tree without disturbing the user’s mental map. More precisely, the nodes and edges that were already in the graph should remain as close as possible to their previous positions.
Depending on the use case, the user may or may not be allowed to return to a previous decision route and take another branch.
Using a Sophisticated Diagramming Solution
Using a software library that provides ready-to-use components for this task helps developers save a lot of money, time, and workforce.
Implementing a decision diagram with advanced features like interactivity can be a daunting task. Consequently, relying on a professional graph visualization library will significantly reduce the required workforce, time, and money. yFiles for HTML is a generic graph diagramming library that can be utilized to provide all the heavy lifting such as managing proper element placement, item styling, and animations.
Examples and Source Code
This demo provides a sample implementation of the features above. It allows a user to choose between several data sets and interactively make his way through the decision steps.
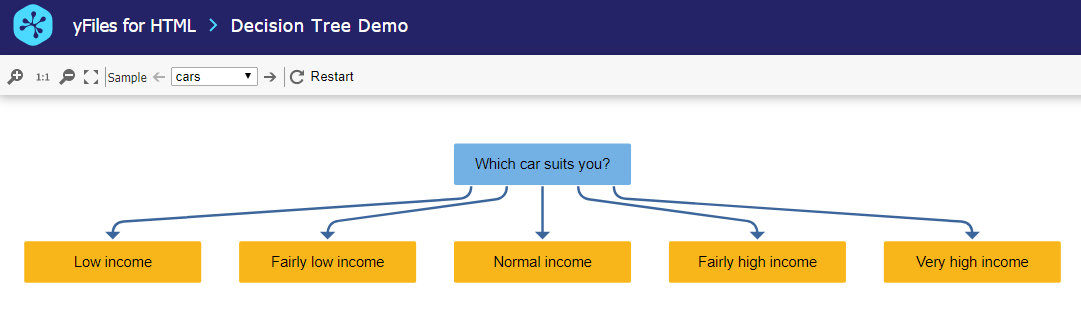
The source code of the Decision Tree Sample Application is available on the yWorks GitHub repository and part of the yFiles for HTML package.
Based on this example, yWorks built the Dungeons & Dragons Hero Class Decision Tree Application. This application guides users to the perfectly matching character class for the next Dungeons & Dragons session based on hand-picked criteria.
Implement Your Own Decision Tree Application
Test the yFiles for HTML diagramming library with a fully functional trial package. To implement your own decision tree application, start with the Decision Tree Sample Application that is part of each yFiles package. It’s not only a showcase application but also provides best-practice source code that you can re-use in your project. yFiles makes it easy to customize all aspects of this application, for example, include your own styling or load the data from your personal data source.
-
Download the trial version of yFiles for HTML for your target platform at the yWorks Customer Center.
-
Navigate to the source directory of the Decision Tree Sample Application.
-
Explore the sample application’s features and
-
adjust its source code to match your requirements or
-
copy the source code of the features you like to your project.
-