Hero image for Navigating Your Graph Through Space and Time

Navigating Your Graph Through Space and Time

Our connected world is intrinsically bound to time, and in many domains the geo-spatial aspect plays an equally crucial role. In this article, we introduce insightful visualizations for relational data that has also a geographic and a temporal dimension. We show how these three dimensions can be assembled into one pivotable data visualization, giving you a powerful stepping stone for your own specific business domain. The source code of an accompanying demo application is available on GitHub.

The connected era

We are in a golden era of data-driven business opportunities, nearly every aspect of an enterprise is affected by data analysis and optimization. All industries, from retail to healthcare over banking and aerospace, are embracing machine learning (ML) and artificial intelligence (AI) in some way. This fabulous explosion of machine intelligence does not, however, discard the need for human intelligence and insights gained from meticulous (re)search and expertise. In fact, AI should be seen as an augmentation of human intelligence leveraging our unique creative skills rather than replacing us. Traditional business intelligence (BI), for example, is nowadays amplified by means of ML and cloud-powered AI but does not remove the need for dashboard design and a broad understanding of the business. Making intelligent decisions requires tools that at the same time pivot all the dimensions of the data and highlight the relationships between features.

The data affluence (aka the new oil) has also revealed how events and data features are interconnected; nothing stands on its own. Whether you look at fraud detection, internet of things (IoT) automation, cybersecurity or law enforcement (to name a few), events are often linked causally (in time) or statistically or in space. The human expertise adds to this by injecting business context, thus emphasizing aspects of the data which are not contained in the raw figures. Fighting the rogue offshore industry (money laundering), for instance, is as much a technological challenge (software and forensic tools) as an analytical one.

The power of graphs

Due to the amount of data and its relational aspects, graph solutions have flourished in recent years, both with respect to storage and presentation. Graph stores with millions of nodes are common and used across all industries. A rich universe of graph implementations and algorithms has bifurcated into semantic networks, property graphs, and distributed graph processing (Spark), among others. At the same time, all these backend solutions do not (or not yet) offer a unified view on this linked data: graph traversals focus on the relational aspects, but are oblivious to temporal correlations; singling out a node (or a cluster of nodes) is based on centrality measures which overlook the spatial data contained inside the nodes. As such, the need to visually navigate heterogeneous data and tools to intuitively comprehend it remains very much necessary. Not only because cross-dimensional aspects are not expressed in backend solutions, but also, as highlighted above, because human expertise is mandatory to fully grasp what is going on. One can object that there are also databases that intrinsically deal with time series (e.g. the popular InfluxDB) or the fact that many relational systems have spatial data types (and associated geo-API), but they do not coherently present the data, much less visualize it.

load from Vimeo

Space-time graphs in your application

With the commercial programming library yFiles, we at yWorks are uniquely positioned to approach the visualization of multi-faceted data. Graphs are in our DNA and our yFiles framework can articulate as good as any type of graph you can envision. The visualization of relational, geographic and time-like data, in particular, is something you can easily assemble in diverse ways.

While there are solutions on the market which make it all possible (from backend to frontend and the analytics in between), we give you a rich framework on top of which you can create amazing interactive applications. Unlike the all-in-one solutions, you can brand, customize and integrate things in any way you like.

The demo application

In the following, we introduce a demo application that focuses on the presentation of data with the aforementioned dimensions: geographic, temporal and relational. The business context of the application has been kept as generic as possible, so you can use your own data and adapt the demo to your needs without much effort. There are, however, many alternative cases one could just as well explore with slightly different datasets: anti-terrorism, fraud detection, research collaboration networks (including citation networks), outlining historical events and even genealogical research and heir location research.

use case space time screenshot

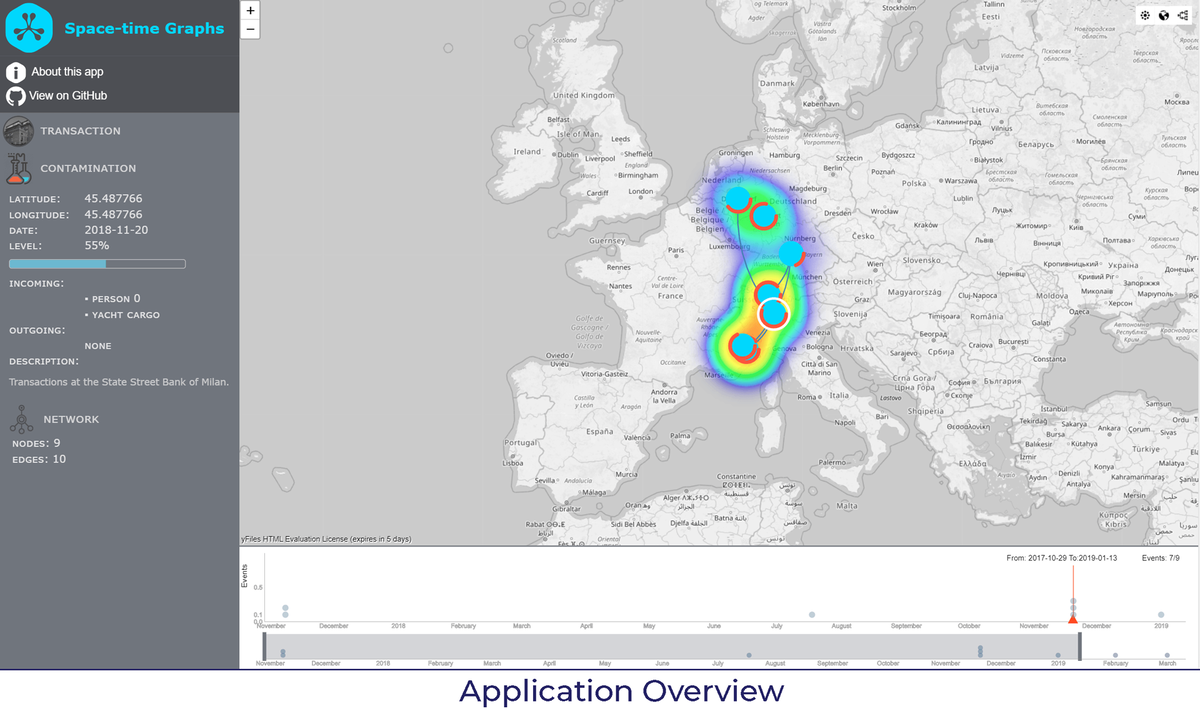
The underlying data is a graph (network) where each node is tagged with geographical and/or date/time information. It’s not mandatory to have this information in each node, but the more it’s present across the data, the more hidden relations can be discovered, of course. The app consists of three panels:

  • the main panel presenting the graph in three ways; overlaid on a map, centered around a particular node (the centric view) or as a horizontal hierarchy which possibly also can emphasize lineage of the data,

  • the property panel presenting the data of the selected node, including some basic graph analysis like directly connected nodes (the neighborhood of the selected node),

  • the timeline panel presenting the events within a time window comprised of the earliest and latest date in the dataset.

Main panel

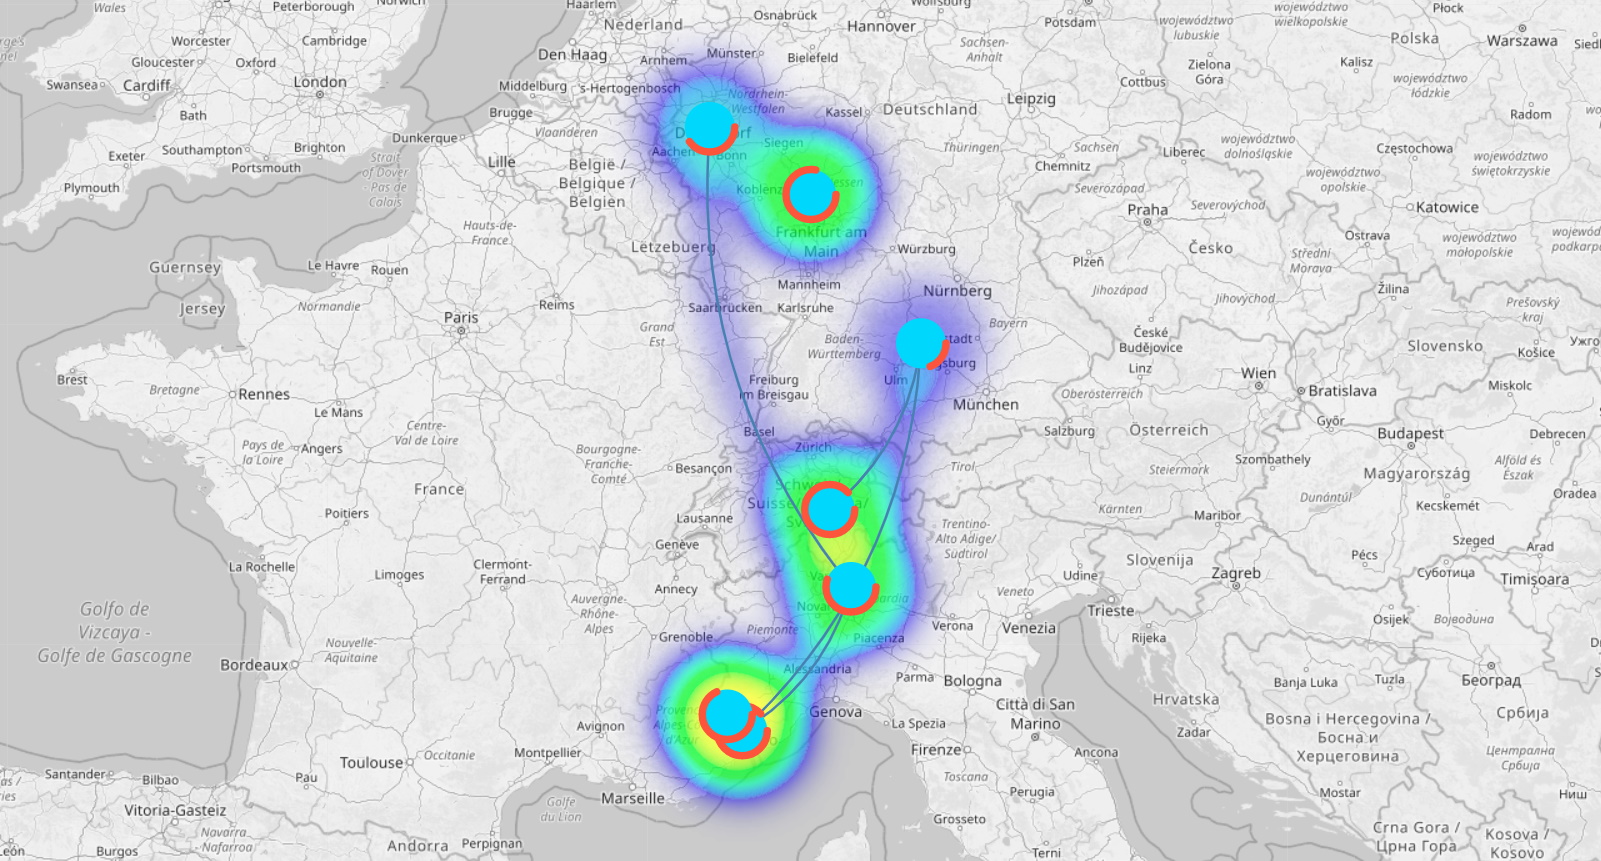
The geographic view emphasizes geographic affinity as well as global topology and breadth of the data across the globe. The following initial questions are typical in spatial analysis and can be supported by the application:

  • Heterogeneity and distribution: what is the scale and spreading of events? Which regions are represented, which are the predominant ones?

  • Spatial interactions: what are the main channels? This can be further accentuated by means of edge bundling or graph analysis.

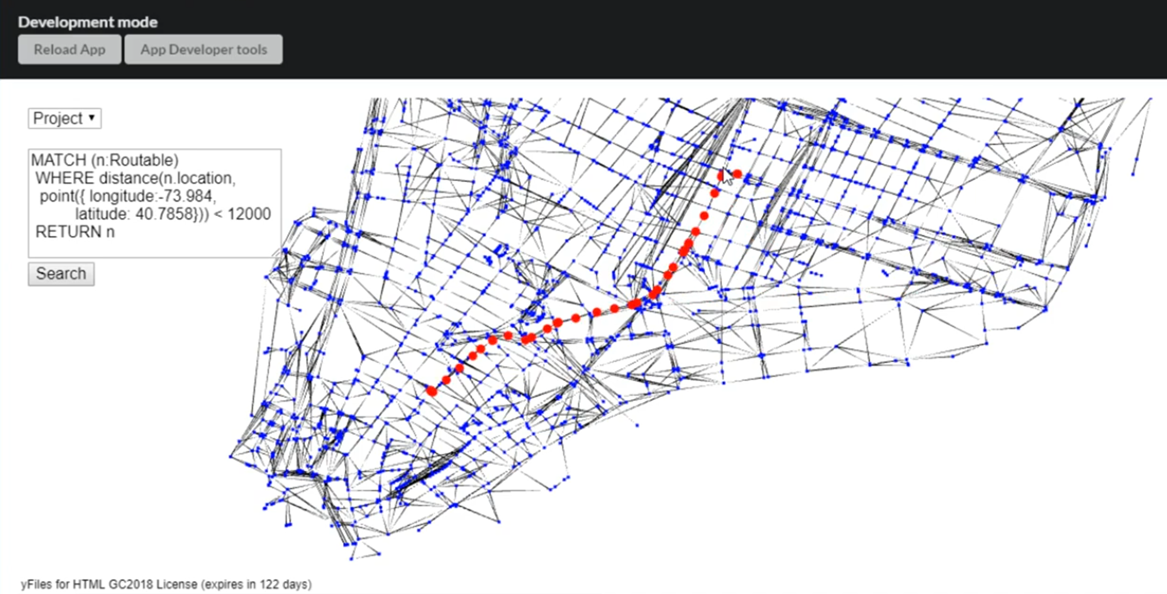
If the amount of data is too large, one can either recourse to backend preprocessing, or use semantic zoom as demonstrated in this sample map application.

use case space time main panel

The smooth transition between the geographic mapping of the nodes and the centric layout reveals how the two different views map neighboring nodes around a particular item. This is an example where animation is more than a gimmick and conveys information by guiding the eyes in a particular way.

More components can be added to the main panel, depending on the integration of this view into a larger application, for example:

  • Rich infoboxes (pop-ups) can add additional information that does not fit the visual constraints of the nodes: paragraphs of text, images or even sound and video. Of course, if you do wish to see larger blobs of information, you can add these as well.

  • The node itself can be a dynamic element containing bar charts, dynamic sparklines, pie charts…​ anything helping the analyst to quickly gather evidence or to navigate towards some insights. The ideal user experience and approach is a mixture of story-telling (what does the application wish to support, what is the workflow?), data types, user interface elements (data visualization), technology (CSS, JavaScript) and, of course, good design. yFiles supports many styling and dynamic possibilities, all just some API calls away.

  • Edges can be dynamic elements as well, with their own info widgets and animation. See the network monitoring example, and the Sankey diagram example for some ideas.

Property panel

use case space time properties

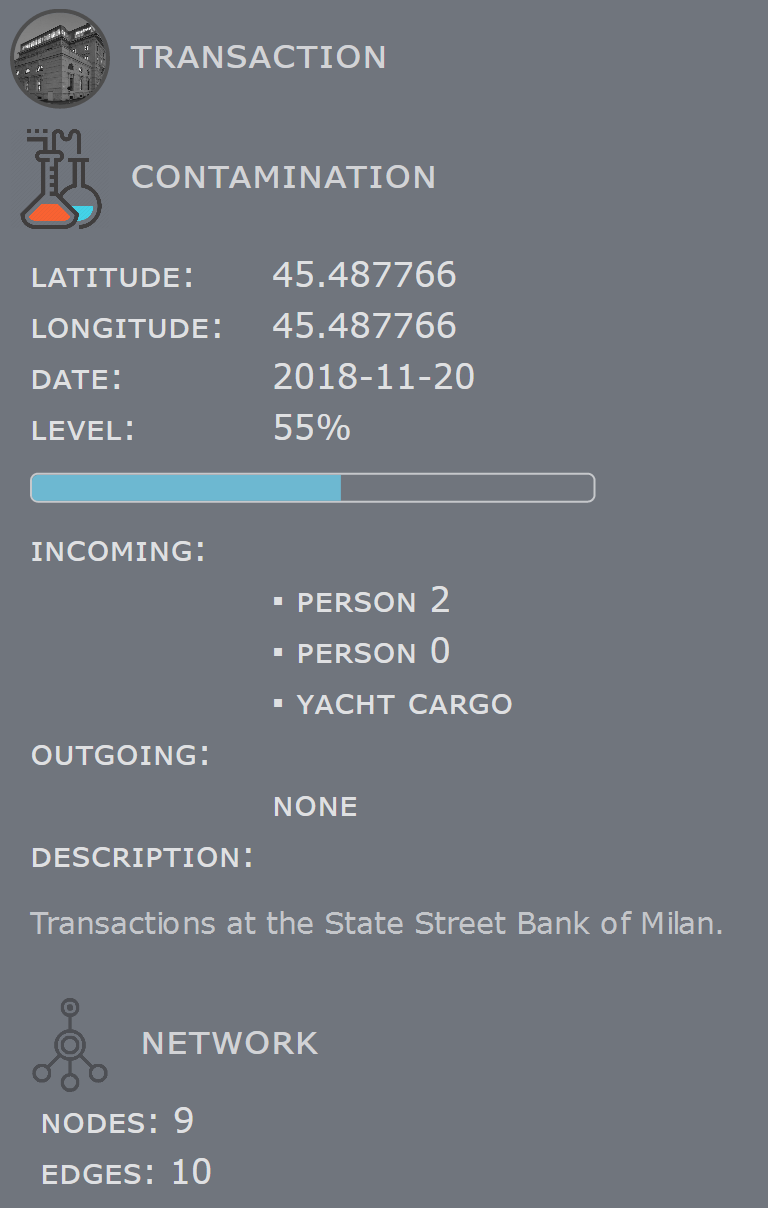
The property panel is where you can display the data directly coming from the nodes, but you can also integrate global or related information here. The information can come from backend services (security details, realtime weather…​) or from the graph topology (say, centrality measures). The panel can furthermore be an alternative way to drill down into the data by hyperlinking properties to graph filtering, graph traversals, and the like. Deciding what to display in the properties panel for your business context is a creative process involving multiple roles: design, functional behavior, data, and end-user comprehension. What is true in all cases is that creative solutions should not be dimmed by technical constraints: at yWorks, we firmly believe that yFiles is uniquely rich and flexible to support the largest range of diagramming solutions around.
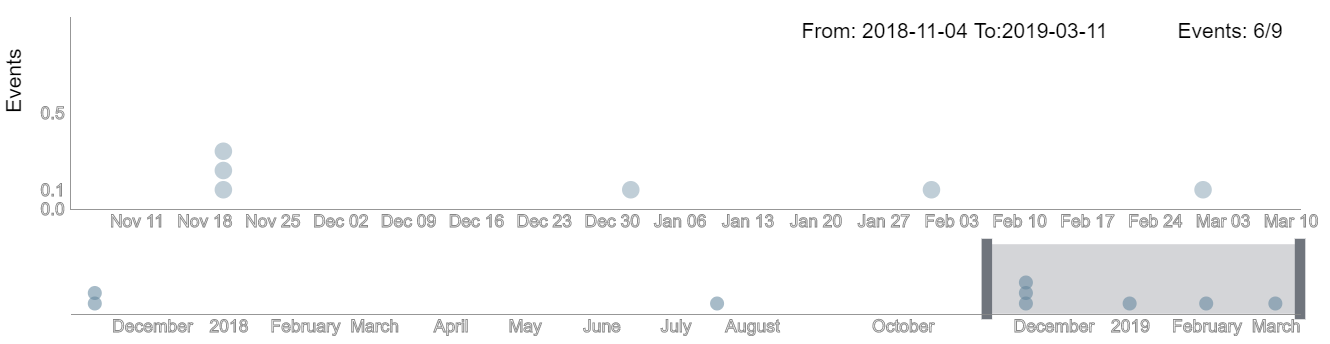
Timeline component

Last but not least, the timeline is where you can see how the data is spread across time. The upper part of the timeline corresponds to the time-window selection in the lower part. The time-window filters out the data in the main panel and, hence, allows you to see how data evolves in time. An alternative timeline is part of the fraud detection example where you can, in addition, play the evolution automatically. This is a feature one could also implement in this app, or use the Leaflet TimeDimension component, or another variant for visualizing the evolution. The way the data dots are stacked to indicate a temporal incidence can also be altered in many ways: one could use a bar chart, an area chart and so on. The time-window in conjunction with the filtering functionality really embodies the essence of a dynamic network: graph relations are often dynamic, and a graph on its own cannot represent this.

use case space time timeline

Get the source code

The source code of the demo application is available on GitHub. See the included readme file for usage instructions and implementation notes.

You need a copy of the yFiles for HTML diagramming library in order to run this application. You can download a free test version of yFiles in the yWorks Customer Center.

Why yFiles?

Most complete solution

Since 2000, yWorks is dedicated to the creation of professional graph and diagramming software libraries. yWorks enables clients to realize even the most sophisticated visualization requirements to help them gain insights into their connected data. The yFiles family of software programming libraries is the most advanced and complete solution available on the market, supporting the broadest range of platforms, integrations, input methods, data sources, backends, IDEs, and programming languages.

Perfect match for all use-cases

yFiles not only lets you create your own customized applications but integrates well with your existing solutions and dashboards on the desktop, on mobile, and on the web. Developers can use concise, rich, complete APIs to create fresh, new applications and user experiences that match your corporate identity and exactly fit your specific use-cases. Browse and choose from hundreds of source code demos and integrations to get ideas and get started in no time.

Honest, simple licensing

yFiles enables white-label integrations into your applications, with royalty-free and perpetual licensing. There are no third party code dependencies.

Industry-leading automatic layouts

yFiles has got you covered with a complete set of fully configurable, extensible automatic layout algorithms, that not merely render the elements on the screen but help users understand their data and the relationships just by looking at the diagrams.

Unmatched customizability

Decades of work went into the creation of the most flexible, extensible, and easy to use diagramming APIs that are available on the market. Everything may be customized with yFiles: data acquisition and import, graph creation, display, interaction, animation, layout, export, printing, and third party service connectivity.

Algorithms included

With yFiles, you can analyze your graphs, connected data, and networks both on the fly and interactively with a complete set of efficient graph algorithm implementations. Calculate centrality measures, perform automatic clustering, calculate flows, run reachability algorithms, find paths, cycles, and dependencies. For the best user experience, use the results to drive the visualization, interactivity, and layout.

Unequaled developer productivity

Developers quickly create sophisticated diagramming applications with yFiles. The extensive API has been carefully designed and thoroughly documented. There are developers’ guides, source code tutorials, getting started videos, and fully documented source code demo applications, that help to realize even the most advanced features. Inline API documentation lookup for all major IDEs with hundreds of code snippets and linked related topics make writing robust code a breeze. Integration samples for many major third party systems help in getting productive, quickly.

Not just a static viewer

With yFiles, you can do more than just analyze and view your data. Create interactive, deeply integrated apps that don’t just let you consume data sources, but also enable users to create, modify, and work with both existing and changing data. Integrate with third party services to automatically trigger actions and apply updates. With yFiles, there are no limits: you decide what your app can do.

High-performance implementations

While it is recommended not to overwhelm the end-user with overly complex graph visualizations, of course, all aspects of the library have been prepared to work with large amounts of data. Developers can create both high-quality diagram visualizations and rich user-interactions, as well as configure algorithms and visualizations to perform great for even the largest graphs and networks.

Generic data acquisition

You don’t need to let your users create the diagrams from scratch or use a particular file format. yFiles enables you to import graphs from any data source which is accessible via an API. Programmatically build the in-memory model using an intuitive, powerful API. Update the diagram live in response to external events and changes.

World-class support

Get the best support for your development teams. Directly connect with more than a dozen core yFiles library developers to get answers to your questions. If you don’t have the time to do the implementation or your team is not large enough to do the implementation, let yWorks help you with consultancy and project work to get your team and apps up running, quickly.

Proven solution

Customers from all industries all over the world have been using yFiles for almost twenty years for both internal and customer-facing applications and tools. See the references for a non-conclusive list.

Frequently Asked Questions

What is yFiles?

yFiles is a software library that supports visualizing, editing, and analyzing graphs and graph-like diagrams. It is not a ready-to-use application or graph editor. Instead, it provides a component for graph visualization, graph editor features, and an extensive set of algorithms for automatic data arrangement and graph analysis. Software developers can use yFiles to display, edit, and analyze diagrams in their own applications. yFiles is available for many platforms.

Which platforms does yFiles support?

Right now, yFiles supports HTML / JavaScript, Java (Swing), JavaFX, .NET (WinForms), and WPF.

What kind of applications can I create with yFiles?

Developers can use concise, rich, complete APIs to create fresh, new applications, and user-experiences that match your corporate identity and exactly fit your specific use-cases. yFiles enables white-label integrations into your applications, with royalty-free and perpetual licensing. Any application that works with or displays relational data in the form of graphs, diagrams, and networks can be built with the help of yFiles.

What devices can I target with yFiles?

yFiles not only lets you create your own customized applications but integrates well with your existing solutions and dashboards on the desktop, mobile, and the web. There are versions of yFiles available for all major platforms and frameworks.

How extensive is the graph API of yFiles?

yFiles offers the most extensive graph layout, visualization, and analysis APIs available commercially. In total, there are around ten thousand public API members (classes, properties, methods, interfaces, enumerations). yFiles uses a clean, consistent, mostly object-oriented architecture that enables users to customize and (re-) use the available functionality to a great extent. API components can be (re-)combined, extended, configured, reused, and modified to a very high degree. It is not mandatory to know the complete API, of course. Most applications only require a minimal subset of the full functionality, and the advanced functionality and APIs may only be required for implementing unique requirements.

As a developer, what can I expect from yFiles?

yFiles helps developers quickly create sophisticated diagramming applications. The extensive API has been carefully designed and thoroughly documented. There are developers’ guides, source code tutorials, and fully documented complete source code demo applications that help to realize even the most advanced features. Inline API documentation lookup for all major IDEs with hundreds of code snippets and linked related topics help in writing robust code, efficiently. Integration samples for many major third party systems help in getting productive, quickly.

Is yFiles Free?

No. yFiles is a commercial software library. If you decide to use yFiles in your application, you’ll have to pay a one-time fee. You also have the option to subscribe annually for technical support and updates.

How does the licensing work for yFiles?

yFiles enables white-label integrations into your applications, with royalty-free and perpetual licensing. There are no third party code dependencies. Licensing basically works on a per developer basis. Please refer to the pricing information and software license agreements of the respective product for more details.

What kind of support can I get for yFiles?

The yFiles libraries come with fully documented demo applications, detailed API documentation, and extensive developers’ guides. Apart from that, yWorks also offers professional support services for your development teams. They can connect directly with more than a dozen core yFiles library developers to get answers to their programming questions. Optionally, if you don’t have the time or necessary team, yWorks can help you with consultancy and project work to get you and your apps up running quickly.

How is the release cycle for yFiles?

There is no public roadmap for yFiles. yFiles usually gets a new major feature release about every 10 to 15 months, with bugfixes or minor maintenance releases in between as required. Typically there are between one and five bugfix releases for each major release, and previous releases get important bugfixes, too. yWorks tries very hard to keep the libraries and APIs backward compatible so that customers can update to the newest version of yFiles regularly with little to no effort and still benefit from performance improvements and new features.

Can I edit my graphs with yFiles?

With yFiles, you can do more than just analyze and view your data. You can have interactive, deeply integrated apps that don’t just let you consume data sources but also enable users to create from scratch, modify, and work with both existing and changing data. Integrate with third party services to automatically trigger actions and apply updates in real-time and publish changes to third party systems while the user works with the graph. It’s up to you to decide what your app can do.

What kind of layouts does yFiles support?

yFiles comes with the most extensive set of fully configurable, extensible automatic layout algorithms, that not merely render the elements on the screen but help users understand their data and the relationships just by looking at the diagrams. yFiles includes hierarchic, organic (force-directed), orthogonal, tree-like, radial, balloon-like, and special purpose layouts. yFiles also supports incremental, partial, and interactive layouts, as well as various edge routing and automatic label placement algorithms.

Are the layout algorithms configurable?

Layout algorithms support various settings and constraints and are fully customizable in code. They support different node sizes, nested groups, bundled edges, orthogonally and octilinearly routed edges, consider and automatically place node, edge, and port labels. Nodes may be partitioned and clustered, and different layout styles can be mixed in the same diagram.

What kind of graph analysis does yFiles support?

yFiles lets you analyze your graphs, connected data, and networks both on the fly and interactively with a complete set of efficient graph algorithm implementations. Choose from a range of different centrality measure implementations, automatic clustering algorithms, network flow algorithms, reachability and connectivity algorithms, pathfinding variants, cycle, and dependency analysis algorithms. For the best user experience, use the results to drive the visualization, interactivity, and layout.

What parts of yFiles can be customized?

yFiles has the most flexible, extensible, and easy to use diagramming APIs that are available commercially. Every aspect of the functionality is customizable with options ranging from high-level configuration settings, down to low-level implementation overrides: data acquisition, import, graph creation, display, interaction, animation, layout, export, printing, and third party service connectivity.

How can I get my data into yFiles?

End-users don’t need to create the diagrams from sketch or use a specific file format. yFiles lets you import graphs from any data source that is accessible via an API. Developers can populate the in-memory model using an intuitive, powerful API, directly connecting to their preferred data sources. Diagrams can be updated live in response to external events and changes.

How can I get my diagrams data back from yFiles?

The in-memory graph model lets you export all the information to any system and file format. There are built-in export options to various file and image formats, but as a developer, you can create your own glue code to connect to arbitrary data storage systems and third party services.

Is the diagram size limited?

Theoretically, the only limiting factor for the number of graph elements is the size of the computer’s memory. In practice, performance is also a limiting factor. For the vast majority of use-cases, yFiles delivers best-in-class performance out-of-the-box. For very large visualizations and data-sets, there are options available that let developers tune between features, running-time, and quality of the results. yFiles can deal with graphs of any size and is only bound by the memory available and the runtime complexity of the algorithms. Large graphs may require adjusting the default settings and performance depends on more than just the number of elements in the diagram, but also the structure of the graph, the algorithm and configuration, as well as platform and hardware capabilities.

Who is using yFiles, already?

Customers from almost all industries all over the planet have been using yFiles for nearly twenty years, to create both internal and customer-facing applications and tools. Clients include both single developers and the largest corporations and organizations in all of academia, public and governmental services, and of course, the commercial space. See the references for a non-conclusive list. Naturally, there are the big well-known software corporations among yWorks’ customers (unfortunately only some of them allow yWorks to list them on the references page), but there’s also a great lot of companies that are not traditionally known for software, but who still have their own IT departments create software for their intranet or customer-facing applications. And last but not least, smaller companies without IT departments that let third party implementors create useful diagramming applications with the help of yFiles for them. yFiles at its core is a generic diagramming component that is use-case agnostic and can be used to create graph and diagramming-centric applications for any business domain that requires working with or displaying connected data.

How long did it take to implement yFiles?

yFiles started as a university project at the University of Tübingen in the late 1990s. Since 2000, yWorks has taken over all development and has been working continuously with a core layout-team of two to eight developers on improving the layout algorithms. The layout algorithms alone, as of 2021, took more than seventy development years to implement. A team of more than 25 developers has been working on the implementation for the visualization and interaction and the support for the various platforms yFiles supports, totaling in more than a hundred years of development for the visualization. Porting yFiles to a new platform in the past took between three and about 15 development years. Most platform variations were implemented in between six and ten calendar months.

How long has yFiles been around?

yFiles started as a university project at the University of Tübingen in the late 1990s. The company yWorks was founded as a spin-off of the university in 2000 when the first commercial customers wanted a license for yFiles. Since then, it has been developing and improving the library. It all started as a Java library, and over time, yWorks improved and even rewrote large parts of the library to add new features and support new platforms.

Who is the company behind yFiles?

yWorks is the company behind yFiles. It was founded as a spin-off of the University of Tübingen in the year 2000 specifically for licensing and supporting yFiles commercially. The German company is a privately-held, headquartered in Tübingen. More than 30 employees are working at yWorks, over 20 of which are developers, working on yFiles and the tooling around the libraries. The library developers also provide support and implementation services to yFiles customers. So as a developer, you will get first-class, highest level support directly from the team that implements the libraries.

What does yWorks specialize in?

Since 2000, yWorks is dedicated to the creation of professional graph and diagramming software libraries. The software yWorks creates, enables customers to realize even the most sophisticated visualization requirements to help them gain insights into their connected data. Their main product is the software programming library family yFiles, which is the most sophisticated and complete solution available for diagramming applications on the market, supporting the broadest range of platforms, integrations, input methods, data sources, backends, IDEs, and programming languages. yWorks has set a track-record in providing the most extensive layout and diagramming solutions for developers on all major platforms. In addition to creating, maintaining and supporting the libraries, yWorks also provides professional consultancy services in the area of visualization and diagramming. In addition to that, yWorks also provides a set of smaller software tools, both free and commercial, end-user facing and for software developers, closed-source and open-source.

Does yWorks own all the intellectual property for yFiles?

yFiles does not depend on any third party library, except of course at runtime, where it depends on the runtime of the platform. yWorks owns the IP for all implementations in the core yFiles library. Some demos show the integration and make use of third party software, but they are not required for other cases.

Which papers and algorithms does yFiles implement?

The list of algorithms implemented by yFiles is long. For the common graph algorithms, we use the traditional implementations with the standard optimizations. For many of the layout algorithms, ideas for the implementation base on publicly available papers. Some algorithms (specifically the orthogonal layout and the balloon layout) we created and helped with the creation of the algorithms and (co-)published the papers for the algorithms. Most layout algorithms have been vastly modified, tuned, and enhanced, though, and don’t follow the original implementation ideas, anymore. yWorks added useful features to these implementations to make the algorithms work in less theoretical environments. We removed previously existing constraints of the original implementations and added new ideas to make the algorithms useful for real-world usage. For most of these changes and improvements, no papers have been published.

Can I get the papers for the layout algorithms used in yFiles?

For some of the algorithms, you will find papers that describe the core idea of the layout algorithms. For most algorithms, yWorks massively enhanced and modified the algorithms to support more advanced features that are frequently required in real-world diagrams. For these modifications, we did not publish any papers. As a commercial yFiles customer, you can obtain a license to the source code of yFiles where you can read, learn about, and modify the algorithms in documented source code form, according to the license terms.

Hide Description
Open in yEd LiveDownload