Hero image for Visualizing an Ontology

Visualizing an Ontology

Knowledge management thrives on big graphs but also requires an abstract conceptual domain-specific framework in order to regulate complexity. Developing an ontology benefits much from proper tooling to bring forward the conspicuous elements of the domain and the intricacies of the ontology. We show how yFiles with its many enticing layout algorithms can empower you and deliver visualization and interactivity no other ontology application has.

load from Vimeo

The database landscape

Relational databases come in all shapes and sizes, from the lightweight SQLite to DB2 on mainframes over Oracle 19 and MySQL. They all have in common the fact that you cannot store data without designing in advance a table structure, often called the table schema. It means defining what sort of data you wish to insert, how it’s structured, giving names (table names and fields), and how things are related to one another (foreign keys). In large enterprise applications, this process can be a whole project on its own and demands a good understanding of the business context as well as a solid comprehension of the actual database system (say, defining indexes and partitions).

The database landscape is, however, much more than relational systems. More generically, the data storage world is a jungle of possibilities and opportunities with things like key-value stores, document stores, graph databases, time-series databases, hybrid systems, cloud-only systems, and much more. Graph stores have, in particular, exploded in recent years and represent on their own a spectrum of approaches. Broadly speaking, one can divide the graph storage solutions into property graphs, triple stores, and hybrid systems. We go deeper into these three segments in another article and only sketch here the mechanics of triple stores.

Triple stores

Let’s take the simple statement 'Anna owns a Toyota.' This can graphically be represented like so

Sample Triple

One distinguishes three parts here: an endpoint representing Anna, an endpoint representing a Toyota, and an edge with the label 'owns a.' In triple language one speaks of an SPO triple; Anna is the Subject (S), the Toyota is the Object (O), and the edge is the Predicate (P). Things couldn’t be more natural, and one can model things further in the same fashion:

Sample Triples

In the end, this results in a stack of SPO triples which can be tabulated

  • Anna - (owns a) → Toyota

  • Anna - (works at) → yWorks

  • Anna - (uses a) → Yellow umbrella

and stored, indexed, queried as such. This, in a nutshell, is a triple store.

Note the simplicity of this scheme:

  • You don’t need to describe in advance what you wish to store. Every triple is, in essence, just an array of three strings

  • Parsing and indexing triples is fast and straightforward.

  • Storing multiple edges between endpoints is just a bunch of additional triples.

The first item deserves special attention here. It says that unlike relational systems, you don’t have to describe in advance what you wish to store. That is, one has a storage mechanism without a schema, without a predefined structure. Of course, we all are nowadays used to MongoDB and NoSQL solutions, which all are schema-less. If you have used NoSQL solutions with big data, you are for sure aware of the disadvantages of this:

  • Without structure, you end up with a heap of amorphic data.

  • The integrity of data is difficult to maintain.

  • Without a schema, different people can store the same thing in different, ambiguous ways.

What is an ontology?

When looking at triples, you can easily see it happening:

  • Somebody can say 'Anna owns a Toyota' while somebody else can state 'Anna is driving a Toyota.'

  • When updating 'yellow umbrella' to 'red umbrella,' you need to check the existence of an umbrella object first. But what is the predicate? 'uses an umbrella,' 'carrying an umbrella' …​?

  • You cannot delete an endpoint because it might be used by other endpoints

and so on. There are plenty of ambiguous situations, and one cannot use triples for large-scale knowledge management without some form of schema: enter ontologies.

An ontology is a specification of a conceptualization. That is, an ontology is a description and a formal specification of concepts and their relationships. It describes part of our world, corresponding to some knowledge domain. One has ontologies for cancer research, for forensic analysis, for properties of molecules, and so on.

Looking at the example above, we convert the concrete example to something a little more abstract:

  • Person - (owns a) → Car

  • Person - (works at) → Company

  • Person - (uses an) → Umbrella

with the original example being a concrete example of these abstract relations. One calls the abstract entities, like Person, a class of the ontology. Classes are concepts, and the concrete examples of a class are called instances or individuals of the class. In our example above, Anna is an individual of the class Person.

General Sample Triples

Properties: adding data to entities

The relations emanating from the classes can be divided into two categories: things which link two classes and things which adorn a class. For example, a Person has a birthdate and a shoe size, but usually, these properties are not considered worth a class 'Birthdate' or a class 'ShoeSize.' One can also see it like this; some things around us have a complex sub-structure while others don’t. Usually, one does not assign a complex sub-structure to a number, but one does to a car. Hence, things that can be described by simple data types (number, date, string, …​) are called data-type properties.

Properties that point to something more complex are called object properties. The concept 'age of a person' is a data property while 'owns a car' is an object property. The distinction is not always easily made, and this is where domain experts come in. For example, a person has an address, and this can be stored as a simple string or as a structured object (separating postal code, address-line, …​ into separate properties). Whether one shape is right or wrong depends on the global context and aim of the data. It’s also not uncommon to start with a data-type and months later moving on to an object. The situation is, in fact, true for any schema: it evolves together with the software and increasing complexity of the data.

Querying triple stores

How does one query triples? Triple data comes with its own query language called SPARQL. It looks similar to SQL but is tuned to the graph-like data structure. It allows one to harvest triples and subgraphs quickly. Much like SQL, every triple storage system implements the SPARQL standard and adds custom elements (query functions) to it. It is, however, pretty much the only common denominator. Aside from SPARQL, triple stores vary very much in terms of feature set, and the market is rapidly evolving. The same can be said about the associated data access frameworks wrapping around SPARQL; quality and sophistication differ a lot across the various package repositories. At the moment, Java is without a doubt your best choice if you wish to go full scale.

As a side-note, ontologies are often equated with taxonomic hierarchies, but they are not the same thing. A taxonomy is basically a naming convention, a set of labels if you wish. Usually, when these labels are organized, they form a tree-structure, and one ignores the possible non-linearity. That is, the same 'thing' can have multiple parents and form a graph rather than a tree. The reason that taxonomies are preferred over ontologies is that trees are so much easier to manipulate and represent than graphs.

Representations of ontologies

This brings us to representations of ontologies and how it relates to graph stores. From the discussion above, it should be clear that an ontology is itself a bunch of triples. This is a big contrast with the relational world where schema and data are two very different things in a database. Not so in a triple store: the schema and the data are next to another, and they are indistinguishable on the data level. Even more, you can have multiple ontologies inside a database. This can be an advantage, but it’s often the ugly aspect of triple store solutions; there isn’t a triple store that enforces the defined ontology. Read again: you can add an ontology to your triple store, but it will not be used to enforce the data to behave accordingly. Some hybrid solutions like TypeDB fix this, but most vendors do not. The implications are many, but we go deeper into this in another article. Note that because an ontology is a set of triples, you can construct and manipulate an ontology like any other triple data. Using the SPARQL query language, you can uniformly approach data and ontology within the very same queries. It allows one to dynamically alter a schema and its related data, something totally alien to the relational world.

Ontologies in the real world

The concept of ontologies can be found everywhere, e.g. DbPedia is a triple store that replicates all of the facts that can be inferred from the information stored in the whole Wikipedia. If you look at the DbPedia ontology, you discover many common-sense relations we all know. For example, a person has children, but a car does not.

You can find here an extensive list of open ontologies out of which the BioPortal is the most famous one. It contains around ten million classes related to biomedics.

From a software engineering point of view, there are not many ontology editors. The best known is Protégé from Stanford. It does a good job for small to medium-sized ontologies and is freely available.

Representing (that is, visualizing) ontologies is, however, not hard, and we have assembled one such application for you!

App Screenshot

Creating your own ontology visualizer

yFiles is a commercial programming library designed explicitly for diagram visualization and is a perfect fit for the challenges of ontology visualization. It provides an extensive set of predefined styles for visualizing the elements of a network, while it also supports the creation of user-defined custom styles. yFiles comes with a complete set of layout algorithms for arranging the graph based on the user’s needs. These sophisticated algorithms organize the network to produce a clear and concise diagram.

Building on these powerful diagramming features, assembling an ontology visualizer with yFiles is indeed a walk in the park. The most challenging part is the data access to fetch the triples and hand them over to the yFiles framework (the GraphBuilder in the case of yFiles for HTML to be precise). This part is specific to your environment (Java, .Net, NodeJs…​). Every ecosystem has its own stack of packages to approach data and triples in particular. Also, triple storage systems differ widely with respect to features, scalability, and enterprise readiness.

use case ontology screenshot

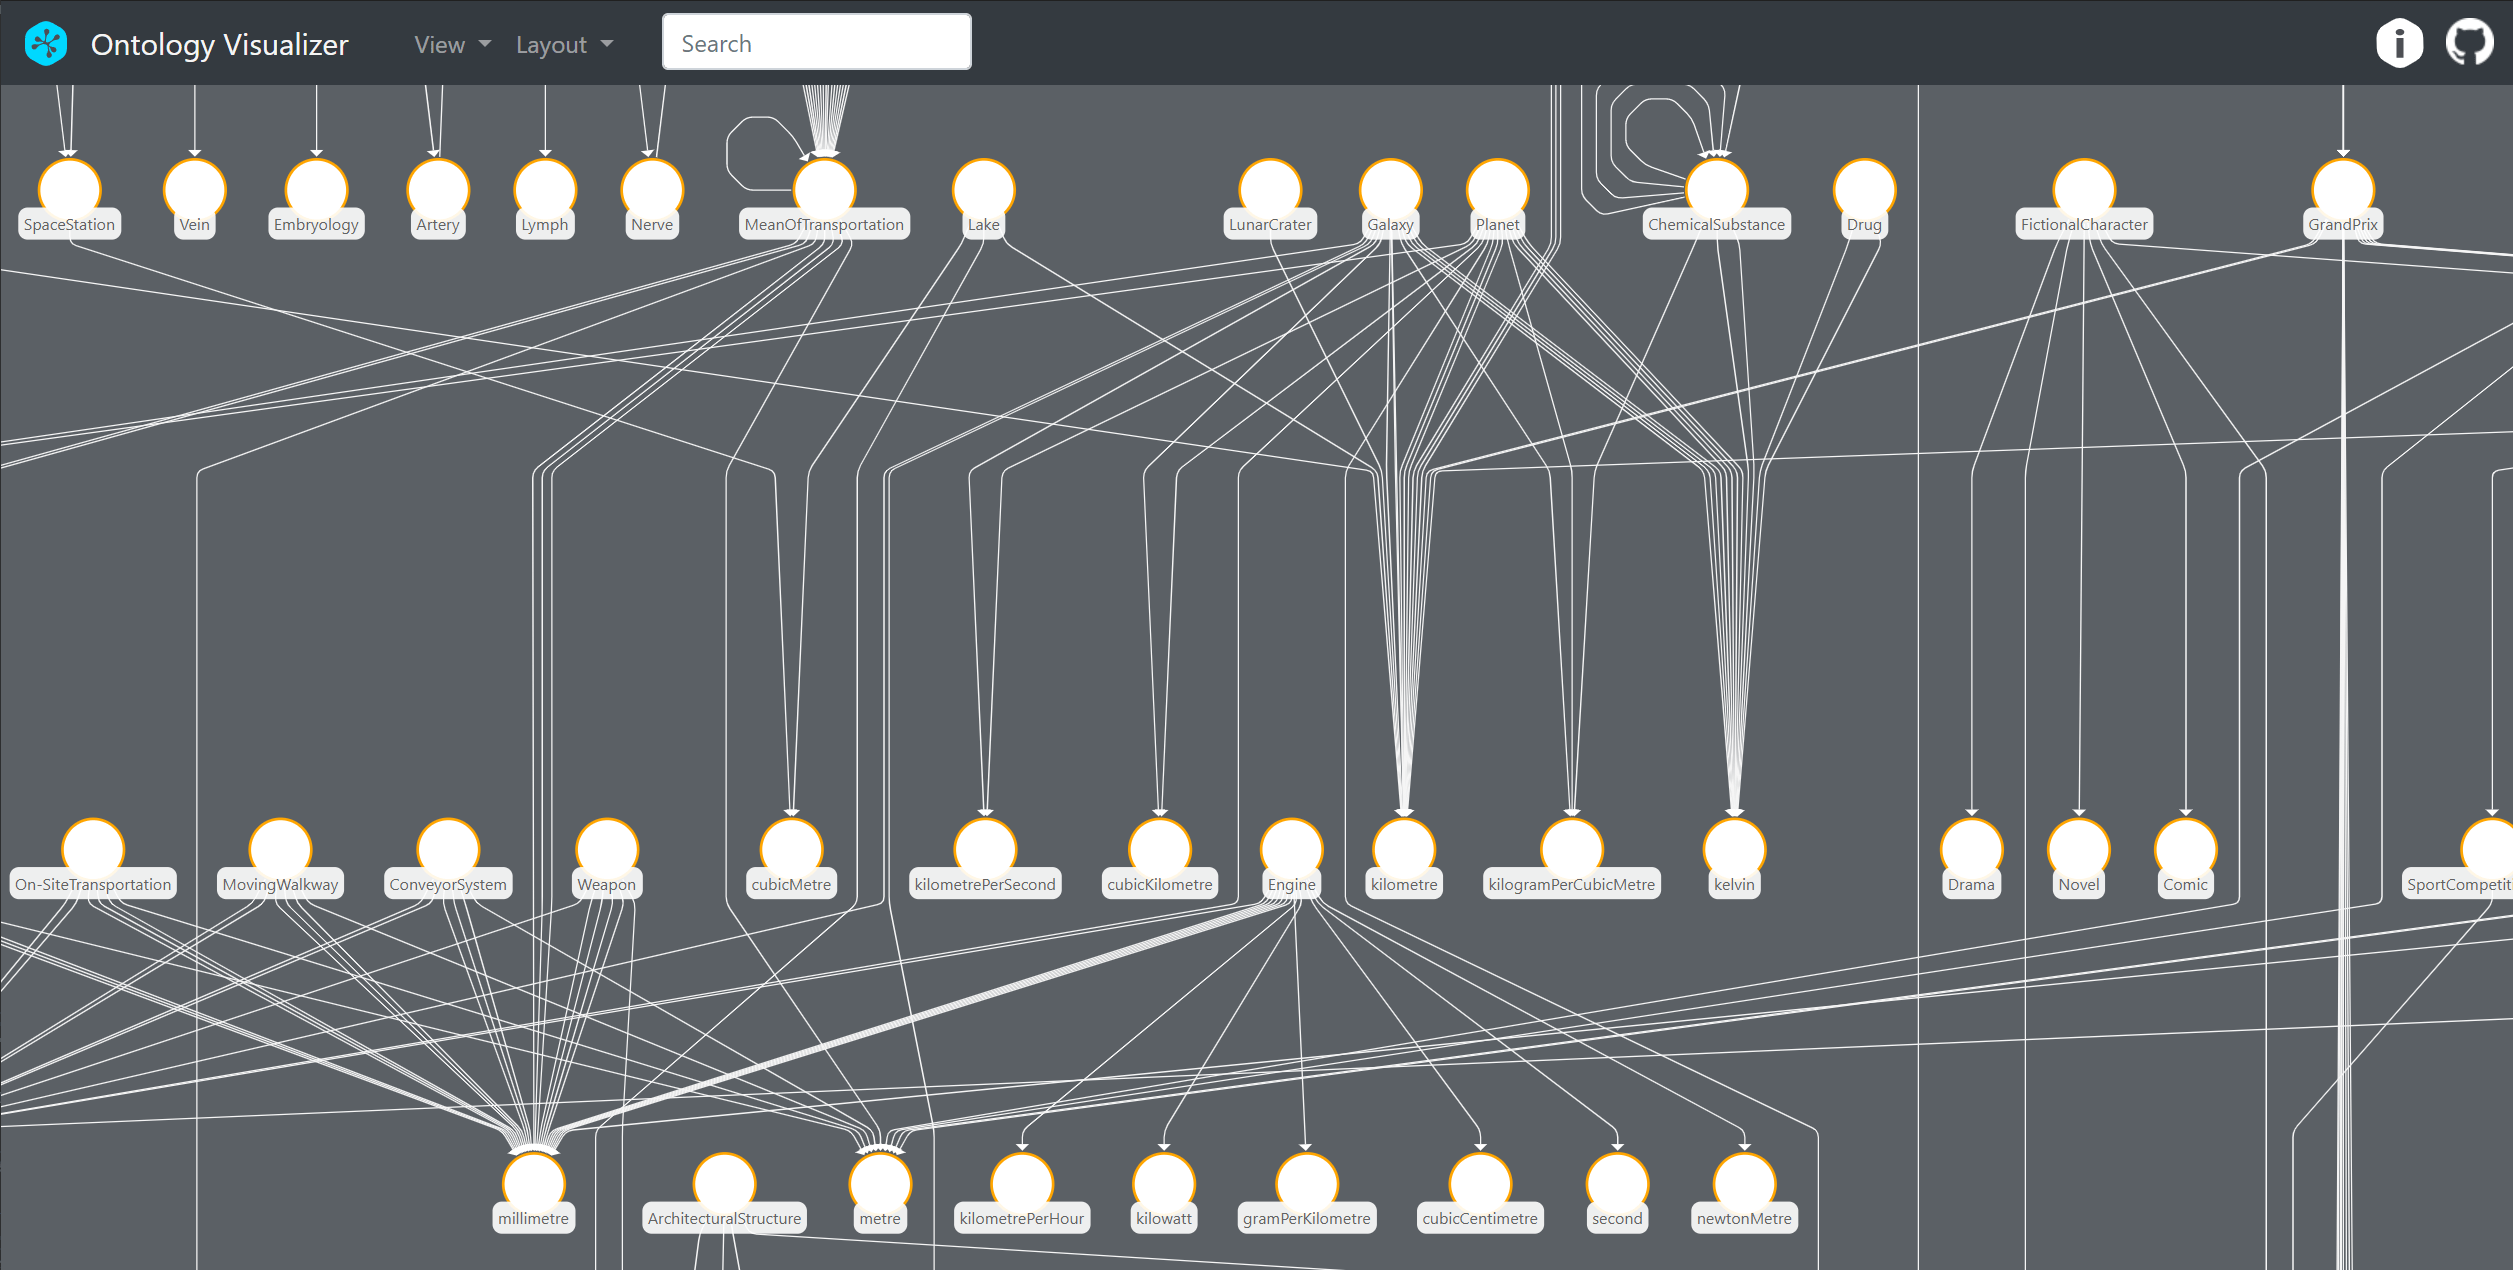
On the other hand, if you wish to experiment with triples and ontologies, you don’t need to crack a safe. Apache Fuseki is an easy to install cross-platform triple store, and the Protégé application mentioned above uses a simple file system. To make things easy, our yFiles for HTML-based visualizer sample application does not require any setup at all. It relies on a key-value storage system akin to what every browser is using to store information. Just run and experiment. Some of the more salient features you will find in this application are:

  • The possibility to use an excellent set of layout algorithms from yFiles. While there are various good-looking ontology visualizers out there in the open (e.g., WebVOWL), none of them have much to offer in terms of graph layout. Usually, they rely on a simple spring-embedder algorithm that fails to deliver with large diagrams and multiple edges between nodes. No complex tuning or parameterization was necessary to achieve this, whatsoever.

  • The integrated graph analysis algorithms allowing one to gain insight into the ontological structure; using centrality measures can reveal hidden aspects of the ontology. This is a unique feature you will not find in any ontology tool.

  • Similarly, one can create clusters and box ontology classes together to define ontological sub-domains, which, in principle, can be extracted into separate ontologies.

Of course this is not where it ends. The above application is just a small sample application created within just a few days of work. However this should give you an idea already of the possibilities you get with a custom diagramming library like yFiles:

  • Use any type of data-source and technology stack to connect to your data-sources.

  • Let your users not just view, but manipulate, edit, or create your ontologies using intuitive, specific, and supportive diagram editing features.

  • Connect your application to third-party systems (e.g. to run inference engines).

  • Embed your ontology visualization into your own existing or newly created app, dashboard, or website.

So what are you waiting for? Try the sample app or start creating your own with yFiles, today!

Get the source code

The source code of the Ontology Visualizer demo application is available on GitHub. See the included readme file for usage instructions and implementation notes.

You need a copy of the yFiles for HTML diagramming library in order to run this application. You can download a free test version of yFiles in the yWorks Customer Center.

Why yFiles?

Most complete solution

Since 2000, yWorks is dedicated to the creation of professional graph and diagramming software libraries. yWorks enables clients to realize even the most sophisticated visualization requirements to help them gain insights into their connected data. The yFiles family of software programming libraries is the most advanced and complete solution available on the market, supporting the broadest range of platforms, integrations, input methods, data sources, backends, IDEs, and programming languages.

Perfect match for all use-cases

yFiles not only lets you create your own customized applications but integrates well with your existing solutions and dashboards on the desktop, on mobile, and on the web. Developers can use concise, rich, complete APIs to create fresh, new applications and user experiences that match your corporate identity and exactly fit your specific use-cases. Browse and choose from hundreds of source code demos and integrations to get ideas and get started in no time.

Honest, simple licensing

yFiles enables white-label integrations into your applications, with royalty-free and perpetual licensing. There are no third party code dependencies.

Industry-leading automatic layouts

yFiles has got you covered with a complete set of fully configurable, extensible automatic layout algorithms, that not merely render the elements on the screen but help users understand their data and the relationships just by looking at the diagrams.

Unmatched customizability

Decades of work went into the creation of the most flexible, extensible, and easy to use diagramming APIs that are available on the market. Everything may be customized with yFiles: data acquisition and import, graph creation, display, interaction, animation, layout, export, printing, and third party service connectivity.

Algorithms included

With yFiles, you can analyze your graphs, connected data, and networks both on the fly and interactively with a complete set of efficient graph algorithm implementations. Calculate centrality measures, perform automatic clustering, calculate flows, run reachability algorithms, find paths, cycles, and dependencies. For the best user experience, use the results to drive the visualization, interactivity, and layout.

Unequaled developer productivity

Developers quickly create sophisticated diagramming applications with yFiles. The extensive API has been carefully designed and thoroughly documented. There are developers’ guides, source code tutorials, getting started videos, and fully documented source code demo applications, that help to realize even the most advanced features. Inline API documentation lookup for all major IDEs with hundreds of code snippets and linked related topics make writing robust code a breeze. Integration samples for many major third party systems help in getting productive, quickly.

Not just a static viewer

With yFiles, you can do more than just analyze and view your data. Create interactive, deeply integrated apps that don’t just let you consume data sources, but also enable users to create, modify, and work with both existing and changing data. Integrate with third party services to automatically trigger actions and apply updates. With yFiles, there are no limits: you decide what your app can do.

High-performance implementations

While it is recommended not to overwhelm the end-user with overly complex graph visualizations, of course, all aspects of the library have been prepared to work with large amounts of data. Developers can create both high-quality diagram visualizations and rich user-interactions, as well as configure algorithms and visualizations to perform great for even the largest graphs and networks.

Generic data acquisition

You don’t need to let your users create the diagrams from scratch or use a particular file format. yFiles enables you to import graphs from any data source which is accessible via an API. Programmatically build the in-memory model using an intuitive, powerful API. Update the diagram live in response to external events and changes.

World-class support

Get the best support for your development teams. Directly connect with more than a dozen core yFiles library developers to get answers to your questions. If you don’t have the time to do the implementation or your team is not large enough to do the implementation, let yWorks help you with consultancy and project work to get your team and apps up running, quickly.

Proven solution

Customers from all industries all over the world have been using yFiles for almost twenty years for both internal and customer-facing applications and tools. See the references for a non-conclusive list.

Frequently Asked Questions

What is yFiles?

yFiles is a software library that supports visualizing, editing, and analyzing graphs and graph-like diagrams. It is not a ready-to-use application or graph editor. Instead, it provides a component for graph visualization, graph editor features, and an extensive set of algorithms for automatic data arrangement and graph analysis. Software developers can use yFiles to display, edit, and analyze diagrams in their own applications. yFiles is available for many platforms.

Which platforms does yFiles support?

Right now, yFiles supports HTML / JavaScript, Java (Swing), JavaFX, .NET (WinForms), and WPF.

What kind of applications can I create with yFiles?

Developers can use concise, rich, complete APIs to create fresh, new applications, and user-experiences that match your corporate identity and exactly fit your specific use-cases. yFiles enables white-label integrations into your applications, with royalty-free and perpetual licensing. Any application that works with or displays relational data in the form of graphs, diagrams, and networks can be built with the help of yFiles.

What devices can I target with yFiles?

yFiles not only lets you create your own customized applications but integrates well with your existing solutions and dashboards on the desktop, mobile, and the web. There are versions of yFiles available for all major platforms and frameworks.

How extensive is the graph API of yFiles?

yFiles offers the most extensive graph layout, visualization, and analysis APIs available commercially. In total, there are around ten thousand public API members (classes, properties, methods, interfaces, enumerations). yFiles uses a clean, consistent, mostly object-oriented architecture that enables users to customize and (re-) use the available functionality to a great extent. API components can be (re-)combined, extended, configured, reused, and modified to a very high degree. It is not mandatory to know the complete API, of course. Most applications only require a minimal subset of the full functionality, and the advanced functionality and APIs may only be required for implementing unique requirements.

As a developer, what can I expect from yFiles?

yFiles helps developers quickly create sophisticated diagramming applications. The extensive API has been carefully designed and thoroughly documented. There are developers’ guides, source code tutorials, and fully documented complete source code demo applications that help to realize even the most advanced features. Inline API documentation lookup for all major IDEs with hundreds of code snippets and linked related topics help in writing robust code, efficiently. Integration samples for many major third party systems help in getting productive, quickly.

Is yFiles Free?

No. yFiles is a commercial software library. If you decide to use yFiles in your application, you’ll have to pay a one-time fee. You also have the option to subscribe annually for technical support and updates.

How does the licensing work for yFiles?

yFiles enables white-label integrations into your applications, with royalty-free and perpetual licensing. There are no third party code dependencies. Licensing basically works on a per developer basis. Please refer to the pricing information and software license agreements of the respective product for more details.

What kind of support can I get for yFiles?

The yFiles libraries come with fully documented demo applications, detailed API documentation, and extensive developers’ guides. Apart from that, yWorks also offers professional support services for your development teams. They can connect directly with more than a dozen core yFiles library developers to get answers to their programming questions. Optionally, if you don’t have the time or necessary team, yWorks can help you with consultancy and project work to get you and your apps up running quickly.

How is the release cycle for yFiles?

There is no public roadmap for yFiles. yFiles usually gets a new major feature release about every 10 to 15 months, with bugfixes or minor maintenance releases in between as required. Typically there are between one and five bugfix releases for each major release, and previous releases get important bugfixes, too. yWorks tries very hard to keep the libraries and APIs backward compatible so that customers can update to the newest version of yFiles regularly with little to no effort and still benefit from performance improvements and new features.

Can I edit my graphs with yFiles?

With yFiles, you can do more than just analyze and view your data. You can have interactive, deeply integrated apps that don’t just let you consume data sources but also enable users to create from scratch, modify, and work with both existing and changing data. Integrate with third party services to automatically trigger actions and apply updates in real-time and publish changes to third party systems while the user works with the graph. It’s up to you to decide what your app can do.

What kind of layouts does yFiles support?

yFiles comes with the most extensive set of fully configurable, extensible automatic layout algorithms, that not merely render the elements on the screen but help users understand their data and the relationships just by looking at the diagrams. yFiles includes hierarchic, organic (force-directed), orthogonal, tree-like, radial, balloon-like, and special purpose layouts. yFiles also supports incremental, partial, and interactive layouts, as well as various edge routing and automatic label placement algorithms.

Are the layout algorithms configurable?

Layout algorithms support various settings and constraints and are fully customizable in code. They support different node sizes, nested groups, bundled edges, orthogonally and octilinearly routed edges, consider and automatically place node, edge, and port labels. Nodes may be partitioned and clustered, and different layout styles can be mixed in the same diagram.

What kind of graph analysis does yFiles support?

yFiles lets you analyze your graphs, connected data, and networks both on the fly and interactively with a complete set of efficient graph algorithm implementations. Choose from a range of different centrality measure implementations, automatic clustering algorithms, network flow algorithms, reachability and connectivity algorithms, pathfinding variants, cycle, and dependency analysis algorithms. For the best user experience, use the results to drive the visualization, interactivity, and layout.

What parts of yFiles can be customized?

yFiles has the most flexible, extensible, and easy to use diagramming APIs that are available commercially. Every aspect of the functionality is customizable with options ranging from high-level configuration settings, down to low-level implementation overrides: data acquisition, import, graph creation, display, interaction, animation, layout, export, printing, and third party service connectivity.

How can I get my data into yFiles?

End-users don’t need to create the diagrams from sketch or use a specific file format. yFiles lets you import graphs from any data source that is accessible via an API. Developers can populate the in-memory model using an intuitive, powerful API, directly connecting to their preferred data sources. Diagrams can be updated live in response to external events and changes.

How can I get my diagrams data back from yFiles?

The in-memory graph model lets you export all the information to any system and file format. There are built-in export options to various file and image formats, but as a developer, you can create your own glue code to connect to arbitrary data storage systems and third party services.

Is the diagram size limited?

Theoretically, the only limiting factor for the number of graph elements is the size of the computer’s memory. In practice, performance is also a limiting factor. For the vast majority of use-cases, yFiles delivers best-in-class performance out-of-the-box. For very large visualizations and data-sets, there are options available that let developers tune between features, running-time, and quality of the results. yFiles can deal with graphs of any size and is only bound by the memory available and the runtime complexity of the algorithms. Large graphs may require adjusting the default settings and performance depends on more than just the number of elements in the diagram, but also the structure of the graph, the algorithm and configuration, as well as platform and hardware capabilities.

Who is using yFiles, already?

Customers from almost all industries all over the planet have been using yFiles for nearly twenty years, to create both internal and customer-facing applications and tools. Clients include both single developers and the largest corporations and organizations in all of academia, public and governmental services, and of course, the commercial space. See the references for a non-conclusive list. Naturally, there are the big well-known software corporations among yWorks’ customers (unfortunately only some of them allow yWorks to list them on the references page), but there’s also a great lot of companies that are not traditionally known for software, but who still have their own IT departments create software for their intranet or customer-facing applications. And last but not least, smaller companies without IT departments that let third party implementors create useful diagramming applications with the help of yFiles for them. yFiles at its core is a generic diagramming component that is use-case agnostic and can be used to create graph and diagramming-centric applications for any business domain that requires working with or displaying connected data.

How long did it take to implement yFiles?

yFiles started as a university project at the University of Tübingen in the late 1990s. Since 2000, yWorks has taken over all development and has been working continuously with a core layout-team of two to eight developers on improving the layout algorithms. The layout algorithms alone, as of 2021, took more than seventy development years to implement. A team of more than 25 developers has been working on the implementation for the visualization and interaction and the support for the various platforms yFiles supports, totaling in more than a hundred years of development for the visualization. Porting yFiles to a new platform in the past took between three and about 15 development years. Most platform variations were implemented in between six and ten calendar months.

How long has yFiles been around?

yFiles started as a university project at the University of Tübingen in the late 1990s. The company yWorks was founded as a spin-off of the university in 2000 when the first commercial customers wanted a license for yFiles. Since then, it has been developing and improving the library. It all started as a Java library, and over time, yWorks improved and even rewrote large parts of the library to add new features and support new platforms.

Who is the company behind yFiles?

yWorks is the company behind yFiles. It was founded as a spin-off of the University of Tübingen in the year 2000 specifically for licensing and supporting yFiles commercially. The German company is a privately-held, headquartered in Tübingen. More than 30 employees are working at yWorks, over 20 of which are developers, working on yFiles and the tooling around the libraries. The library developers also provide support and implementation services to yFiles customers. So as a developer, you will get first-class, highest level support directly from the team that implements the libraries.

What does yWorks specialize in?

Since 2000, yWorks is dedicated to the creation of professional graph and diagramming software libraries. The software yWorks creates, enables customers to realize even the most sophisticated visualization requirements to help them gain insights into their connected data. Their main product is the software programming library family yFiles, which is the most sophisticated and complete solution available for diagramming applications on the market, supporting the broadest range of platforms, integrations, input methods, data sources, backends, IDEs, and programming languages. yWorks has set a track-record in providing the most extensive layout and diagramming solutions for developers on all major platforms. In addition to creating, maintaining and supporting the libraries, yWorks also provides professional consultancy services in the area of visualization and diagramming. In addition to that, yWorks also provides a set of smaller software tools, both free and commercial, end-user facing and for software developers, closed-source and open-source.

Does yWorks own all the intellectual property for yFiles?

yFiles does not depend on any third party library, except of course at runtime, where it depends on the runtime of the platform. yWorks owns the IP for all implementations in the core yFiles library. Some demos show the integration and make use of third party software, but they are not required for other cases.

Which papers and algorithms does yFiles implement?

The list of algorithms implemented by yFiles is long. For the common graph algorithms, we use the traditional implementations with the standard optimizations. For many of the layout algorithms, ideas for the implementation base on publicly available papers. Some algorithms (specifically the orthogonal layout and the balloon layout) we created and helped with the creation of the algorithms and (co-)published the papers for the algorithms. Most layout algorithms have been vastly modified, tuned, and enhanced, though, and don’t follow the original implementation ideas, anymore. yWorks added useful features to these implementations to make the algorithms work in less theoretical environments. We removed previously existing constraints of the original implementations and added new ideas to make the algorithms useful for real-world usage. For most of these changes and improvements, no papers have been published.

Can I get the papers for the layout algorithms used in yFiles?

For some of the algorithms, you will find papers that describe the core idea of the layout algorithms. For most algorithms, yWorks massively enhanced and modified the algorithms to support more advanced features that are frequently required in real-world diagrams. For these modifications, we did not publish any papers. As a commercial yFiles customer, you can obtain a license to the source code of yFiles where you can read, learn about, and modify the algorithms in documented source code form, according to the license terms.

Hide Description
Open in yEd LiveDownload