Step into your diagram with augmented or virtual reality immersion using the updated VR graph viewer in our free online diagram editor yEd Live.
Data Visualization in Virtual Reality: Uncharted Territory
Integrating yFiles into a VR environment is a powerful way to visualize complex graph data in three dimensions, leveraging the immersive nature of VR to enhance data exploration and understanding. By combining the principles of data visualization in virtual- or augmented reality with the capabilities of yFiles, developers can create compelling VR experiences for exploring graph data in new and innovative ways.
Before we go into the specifics of how to feel your graphs in VR/AR, with yFIles’ VR graph viewer in yEdLive, let’s go over some VR/ AR basics!
Enhancing Data Visualization with VR: Immersion, Dimensionality, Perspective, and Interaction
VR introduces four distinct aspects to data visualization, each interconnected:
Immersion: In a 2D graph, conveying volume can be ambiguous. VR solves this by allowing users to visually experience volume, providing a tangible sense of data size. Additionally, VR's immersive nature can evoke strong emotions, enhancing engagement and retention.
Dimensionality: By adding a third dimension, VR enables the simultaneous representation of multiple data layers, facilitating clearer comparisons and showcasing changes over time in innovative ways.
Perspective: VR offers flexibility in perspective, allowing users to switch between views and experience data from both detached and immersive angles. Scale manipulation in VR further enhances perspective, offering unique insights into data representation.
Interaction: VR enables meaningful interaction with data, empowering users to explore different facets of information through gestures, teleportation, and 360-degree views. Dynamic scaling provides varying levels of detail, catering to individual preferences. yEdLive’ VR graph viewer enables you to experience your graphs in VR/AR. Check it out and share your observations!
What are the Experience Types in AR/ VR?
We can distinguish between Passive and Active experiences:
The choice between passive and active VR experiences depends on the device's capabilities. Passive experiences are suitable for headsets without input controls, while active experiences leverage input controls for interactivity.
The Principles for data visualization in virtual reality:
1. Immersion: Utilize VR's immersive nature to provide users with a sense of presence within the data environment, enhancing engagement and understanding.
2. Dimensionality: Leverage VR's ability to add a third dimension to data visualization, enabling the representation of multiple data layers and facilitating clearer comparisons.
3. Perspective: Offer flexibility in perspective, allowing users to switch between views and experience data from both detached and immersive angles.
4. Interaction: Enable meaningful interaction with data through gestures, teleportation, and 360-degree views, empowering users to explore different facets of information.
5. Experience Types:
- Passive vs. Active: Consider whether the VR experience should be passive or active based on the device's capabilities and the desired level of interactivity.
- 3rd Person vs. 1st Person: Decide whether to present data from a third-person or first-person perspective, offering different levels of immersion and insights.
- Standalone vs. Integrated: Determine if the visualization should stand alone or be integrated into a larger narrative or context.
These principles collectively guide the design and implementation of data visualizations in virtual reality, aiming to create compelling and informative experiences for users interacting with complex datasets.
Let us now explore how to interact with your graphs in VR/AR through the yEdLive VR graph viewer!
What are the benefits of examining graphs in AR/VR through the browser?
The emergence of next-gen AR/VR headsets such as the Meta Quest 3 has significantly reduced the barriers to entry for using head-mounted displays (HMDs). With no need for external sensors or camera setups, coupled with the absence of attached cables to the HMD, accessing AR/VR experiences has become more convenient than ever.
This simplified setup can be harnessed in applications such as yEd Live to smoothly transition into an AR/VR view of the diagram, introducing a new level of rendering dimension. This shift not only offers an impressive change in perspective but also enables force-directed layouts to utilize the additional dimension, preventing edge crossings or node overlaps that might occur in a two-dimensional rendering.
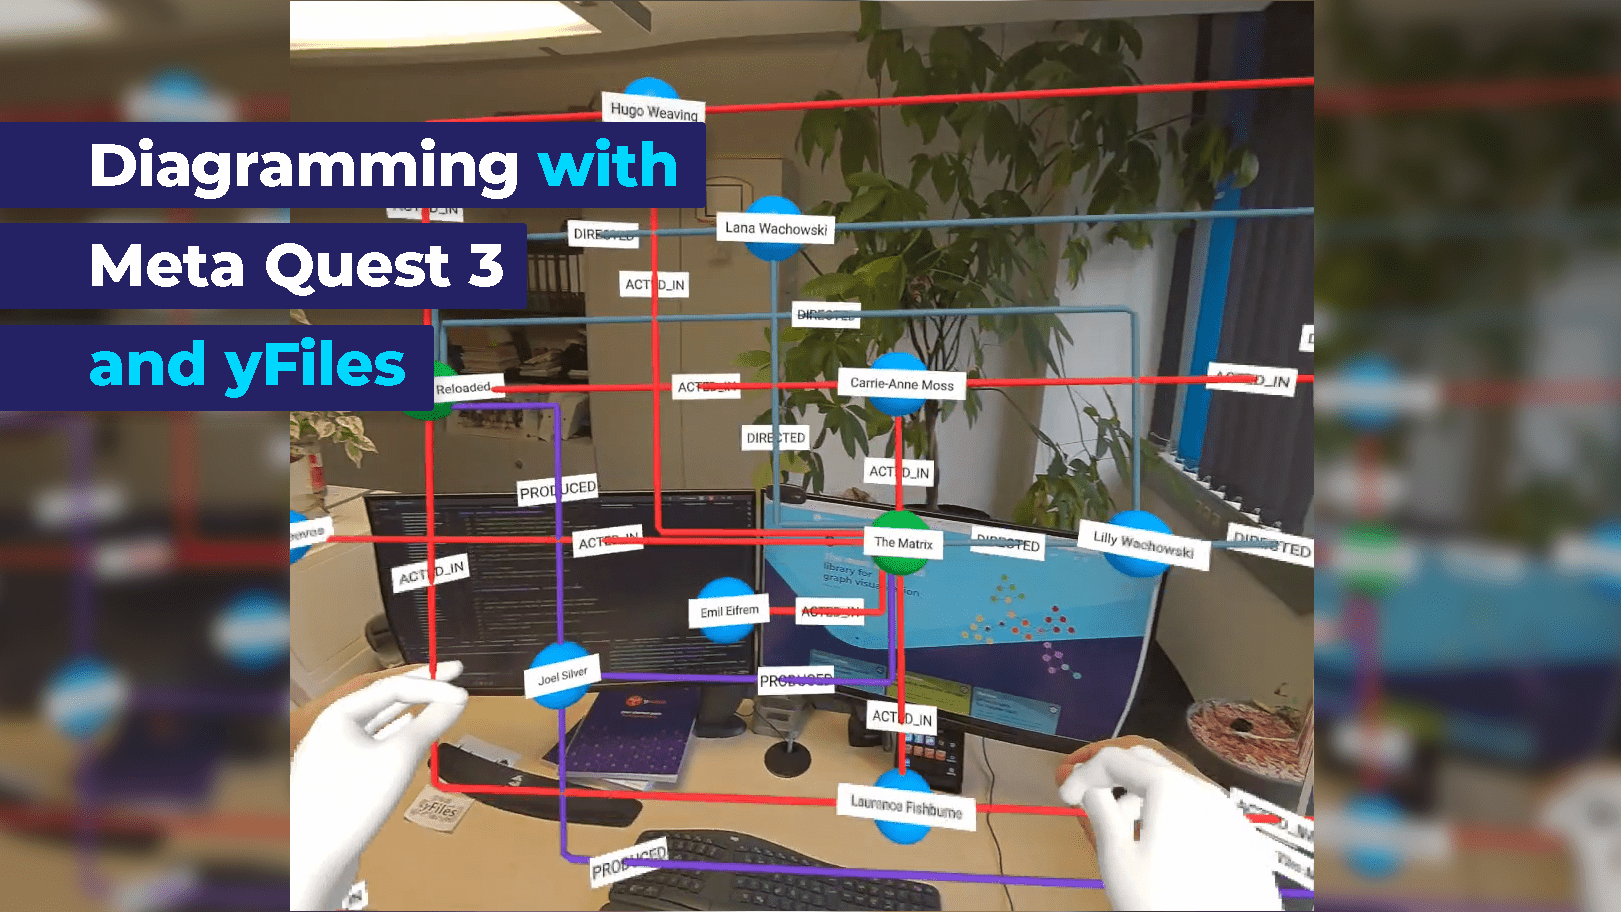
This additional dimension is also beneficial to the user: The diagram can be inspected from all directions. It can be expanded to navigate through an unlimited space, allowing users to zoom in on smaller structures with ease. Alternatively, the diagram can be condensed into a portable object that can be conveniently inspected from all angles.
How to render a diagram in augmented- or virtual-reality?
In yEd Live, we created a graph viewer based on the open-source VR web framework A-Frame. A-Frame is an entity-component framework on top of HTML providing a user-friendly interface for 3D rendering engines three.js.
In combination with using yFiles for HTML, our graph visualization library tailored for web platforms, we can transmit the graph geometry data to our 3D graph viewer, facilitating the creation of essential entities and positioning them in virtual reality. If the graph was originally arranged using a force-directed approach, yFiles' Organic Layout algorithm dynamically recalculates a new layout, leveraging the enhanced freedom offered by the additional dimension.
Interactions with the graph in VR are mediated by the events and components integrated into A-Frame. by A-Frame. These functionalities enable the detection of grab and pinch gestures, empowering us to manipulate the graph object in 3D by moving, rotating, and scaling it as needed.
How to view the graph in Augmented or Virtual Reality in yEd Live?
To activate the 3D graph viewer for your current graph, open the main menu, select the "View" section and select "Show graph in virtual reality".
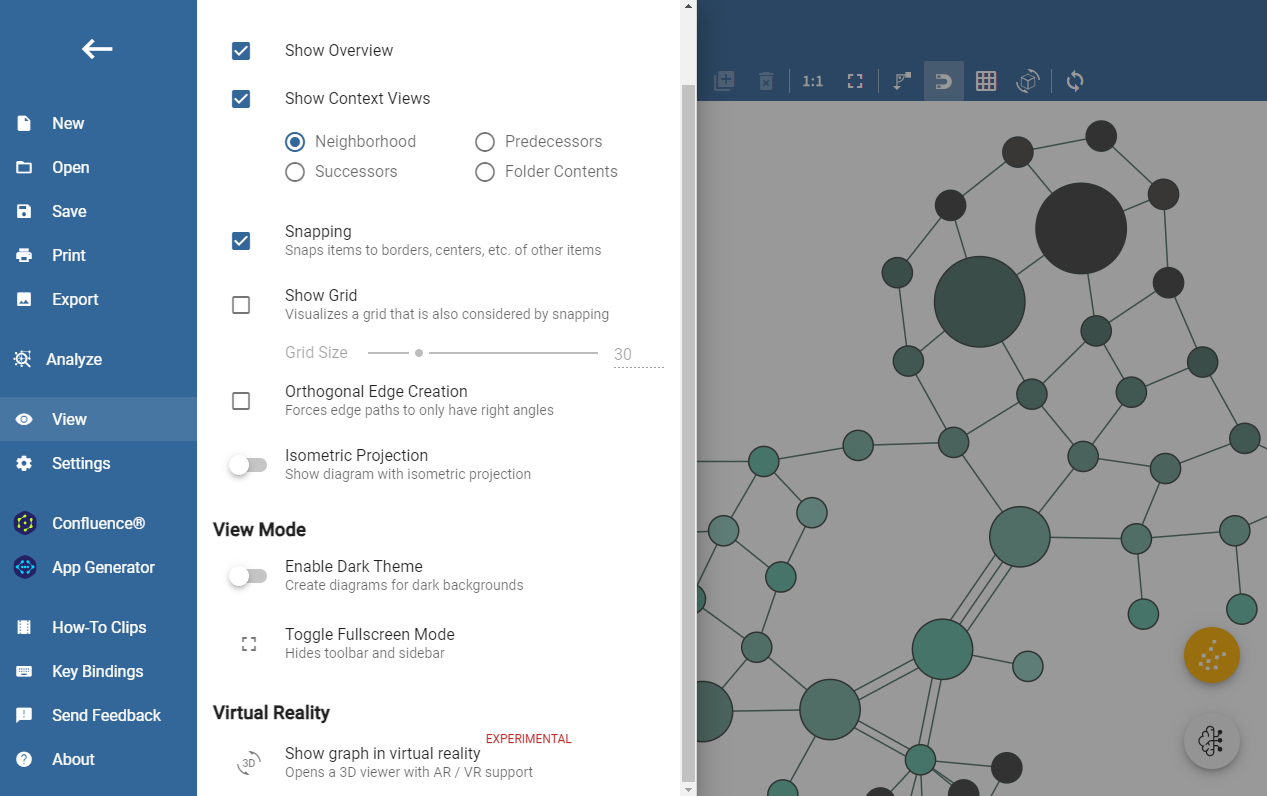
Clicking this initiates a 3D graph viewer in a separate window, offering diverse options based on the connected hardware. If VR and/or AR capabilities are detected, corresponding buttons for entering these modes will appear at the bottom right corner of the 3D graph viewer.

Conclusion
Data visualization in VR unlocks new dimensions for presenting information, offering unparalleled opportunities for manipulation, context, and storytelling.
Integrating yFiles with VR/ AR presents an exciting episode in data visualization, offering immersive experiences that enhance exploration and understanding. By adhering to principles like immersion, dimensionality, perspective, and interaction, developers can create compelling VR visualizations that empower users to interact with complex datasets in innovative ways.
With yEdLive's VR graph viewer, you can explore your graphs in immersive environments, gaining deeper insights. In essence, yFiles in VR/ AR represents inspiring territory, embodying boundless opportunities for impactful data visualization experiences.
FAQ for yEd Live VR Graph Viewer
1. What is yEd Live?
yEd Live is a free, online diagram editor that allows users to create and edit diagrams directly in their web browser.
2. What is the VR graph viewer in yEd Live?
The VR graph viewer is a feature in yEd Live that allows users to visualize their graphs in immersive augmented and virtual reality environments.
3. How do I access the VR graph viewer in yEd Live?
To access the VR graph viewer, open the main menu in yEd Live, select the "View" section, and click "Show graph in virtual reality."
4. What are the benefits of viewing graphs in VR?
Viewing graphs in VR provides enhanced immersion, allows for the representation of multiple data layers in three dimensions, offers flexible perspective views, and enables meaningful interaction with the data.
5. Can I use yEd Live’s VR graph viewer without a VR headset?
Yes, you can explore the 3D graph viewer in a standard browser window, but for full VR experiences, a VR headset is recommended.
6. What types of devices are compatible with yEd Live's VR graph viewer?
The VR graph viewer is compatible with various VR headsets, including Meta Quest 3 and other modern headsets that support WebVR or WebXR standards.
7. How does VR enhance data visualization?
VR enhances data visualization by providing an immersive experience, adding depth and volume to data representations, offering multiple perspectives, and enabling interactive exploration.
8. What types of interactions are possible in the VR graph viewer?
Users can interact with the graph through gestures, teleportation, 360-degree views, and dynamic scaling to explore different facets of the information.
9. How does the VR graph viewer handle large datasets?
The VR graph viewer can handle large datasets by utilizing dynamic scaling and force-directed layouts to manage node overlaps and edge crossings efficiently.
10. Is the VR graph viewer suitable for educational purposes?
Yes, the VR graph viewer is excellent for educational purposes, as it enhances engagement, retention, and understanding of complex data through immersive visualization.
Benefits
1. Enhanced Immersion:
VR provides an immersive experience that allows users to feel as if they are inside the data, making it easier to understand complex information by experiencing it in a more tangible way.
2. Improved Data Comprehension:
By visualizing data in three dimensions, users can better comprehend relationships and patterns that might be ambiguous in 2D representations.
3. Multiple Data Layers:
VR allows for the simultaneous representation of multiple data layers, facilitating clearer comparisons and a more comprehensive view of changes over time.
4. Flexible Perspective:
Users can switch between various perspectives, viewing data from both detached and immersive angles. This flexibility can reveal insights that static 2D views might miss.
5. Interactive Exploration::
VR supports meaningful interaction with data through gestures, teleportation, and 360-degree views. Users can dynamically scale and manipulate the graph, exploring different facets of the information.
6. Increased Engagement:1. Enhanced Immersion:
The immersive nature of VR can evoke strong emotional responses, making the data more engaging and memorable. This can be particularly useful in educational settings.
7. Avoidance of Overlaps:
Using VR’s additional dimension can help avoid node overlaps and edge crossings that are common in 2D representations, leading to cleaner and more readable graphs.
8. Scalability:
VR enables users to zoom in on smaller structures or expand the graph to navigate through an unlimited space, allowing for detailed inspection and analysis of complex datasets.
9. Innovative Presentation
Presenting data in VR can be a powerful way to communicate information in a more compelling and innovative manner, which can be particularly impactful in business and academic presentations.
10. Accessibility and Convenience:
With modern VR headsets like the Meta Quest 3, which do not require external sensors or cables, accessing VR experiences has become more convenient. This ease of setup can be harnessed to seamlessly transition into an AR/VR view of the diagram within yEd Live.