Products
Downloads
Demos
RSS Newsfeed
All Articles
Posts labeled "
yFiles for HTML
"
2026-6-7
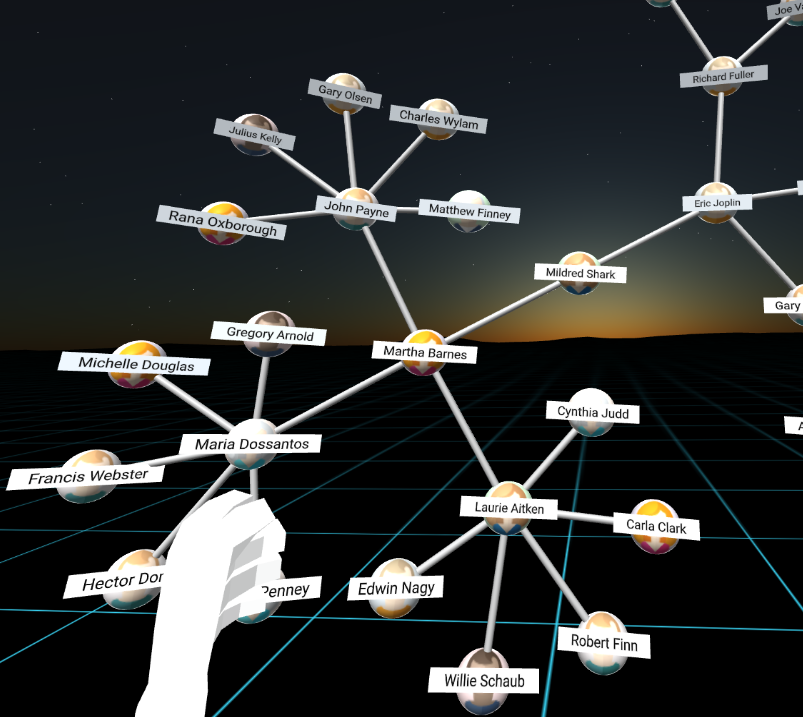
Working with Graphs in Augmented - and Virtual-Reality
How to display your graph in augmented- or virtual-reality with yEd Live.
2023-7-10
Introducing yFiles for HTML – Major Release Version 2.6
yFiles for HTML version 2.6 brings a wealth of powerful new features and improvements that strengthen the graph visualization capabilities of developers.
2022-11-3
Make the right IT decisions – with the help of diagrams
How up-and-coming software developer qbilon GmbH optimizes IT landscape analysis with visual representation.
2022-8-3
Meet yFiles for HTML, version 2.5!
The new yFiles versions in 2022 come with a many new features, including a set of beautifully hand-crafted visualization implementations. Specifically for the web version yWorks invested heavily into the feature set of the WebGL 2.0 rendering backend.
2022-5-19
Keeping personal info private – with the power of graphs
Companies need to model all the “players” involved in processing personal data as well as all the relationships between them.
2021-6-30
yWorks releases version 2.4 of yFiles for HTML!
The new yFiles versions in 2021 come with a many new features. Specifically for the web version yWorks invested heavily into developer experience and performance.
2020-6-9
yWorks releases version 2.3 of yFiles for HTML!
The year 2020 releases of the diagramming software libray family yFiles come with an impressive number of new features. Come and find out more about the highlights in this article.
2020-5-18
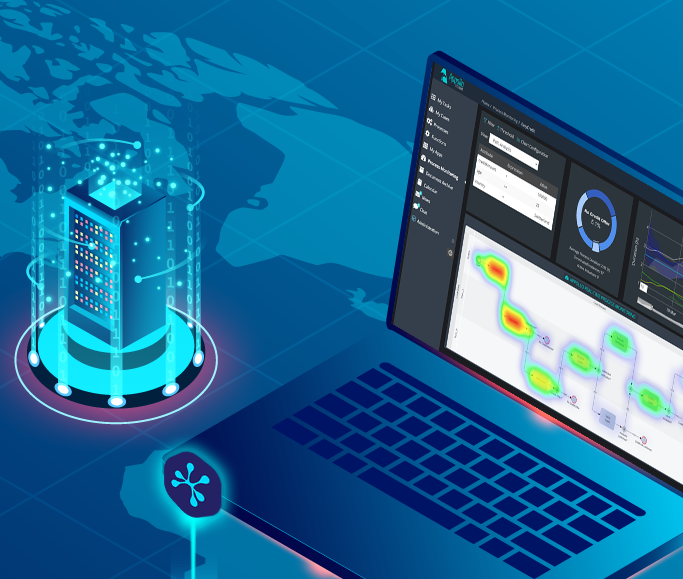
Case Study: Visualizing Digital Innovation
How Appollo Systems used yFiles to create the first low-code development platform for visual business analyses and optimization on the market.
2019-4-11
yWorks releases version 2.2 of yFiles for HTML!
2018-9-17
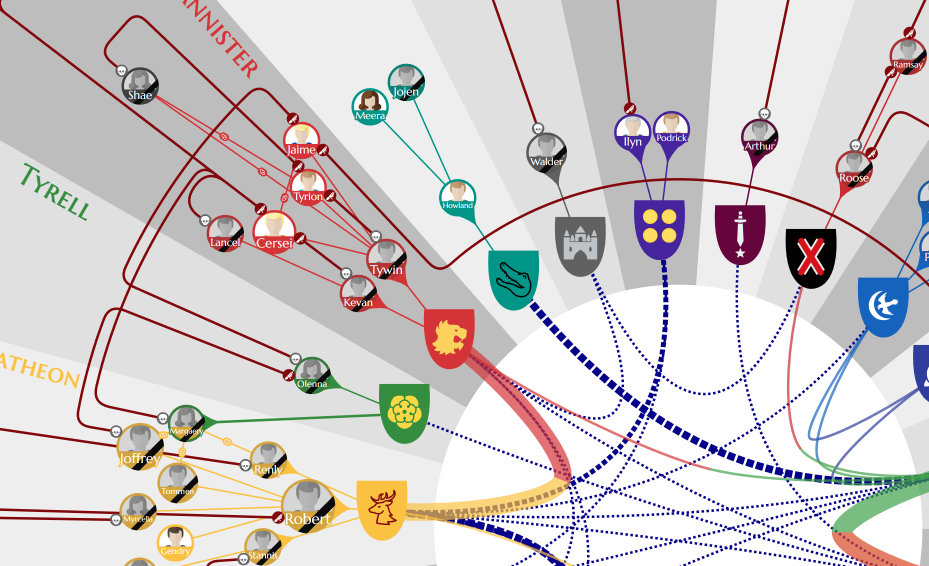
‘Game of Thrones’ Relationship Graph
yWorks’ submission to the Graph Drawing Contest 2018 in Barcelona, Spain
2018-7-6
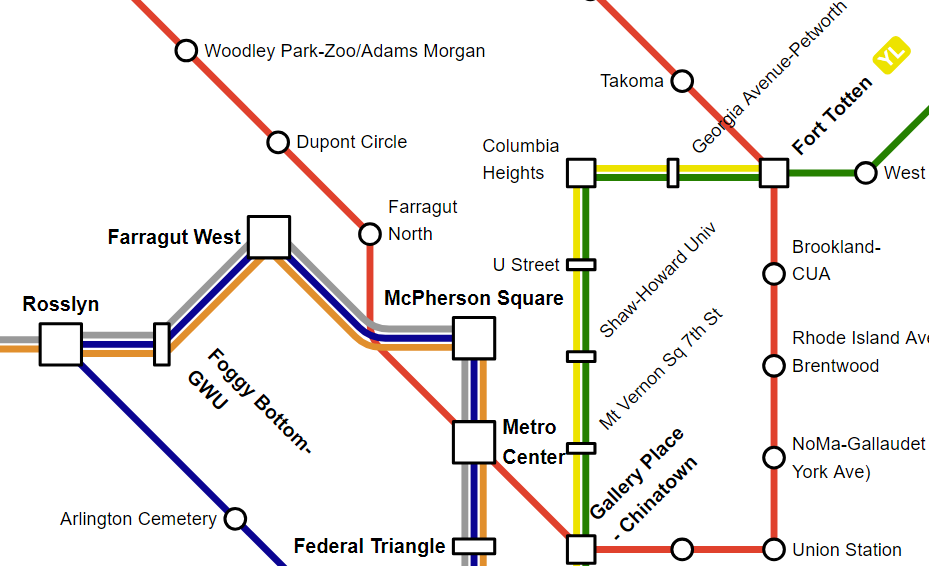
Automatic Metro Map Generation
Discover how yFiles can be used for automatic metro map generation, transforming OpenStreetMap data into visually appealing and efficient maps. Ideal for public transport systems, yFiles offers advanced visualization and labeling. Try yFiles free today!
2018-2-12
yWorks releases version 2.1 of yFiles for HTML!
2017-11-3
Virtual Reality in yEd Live
Showcase of the virtual reality support in yEd Live.
2017-9-29
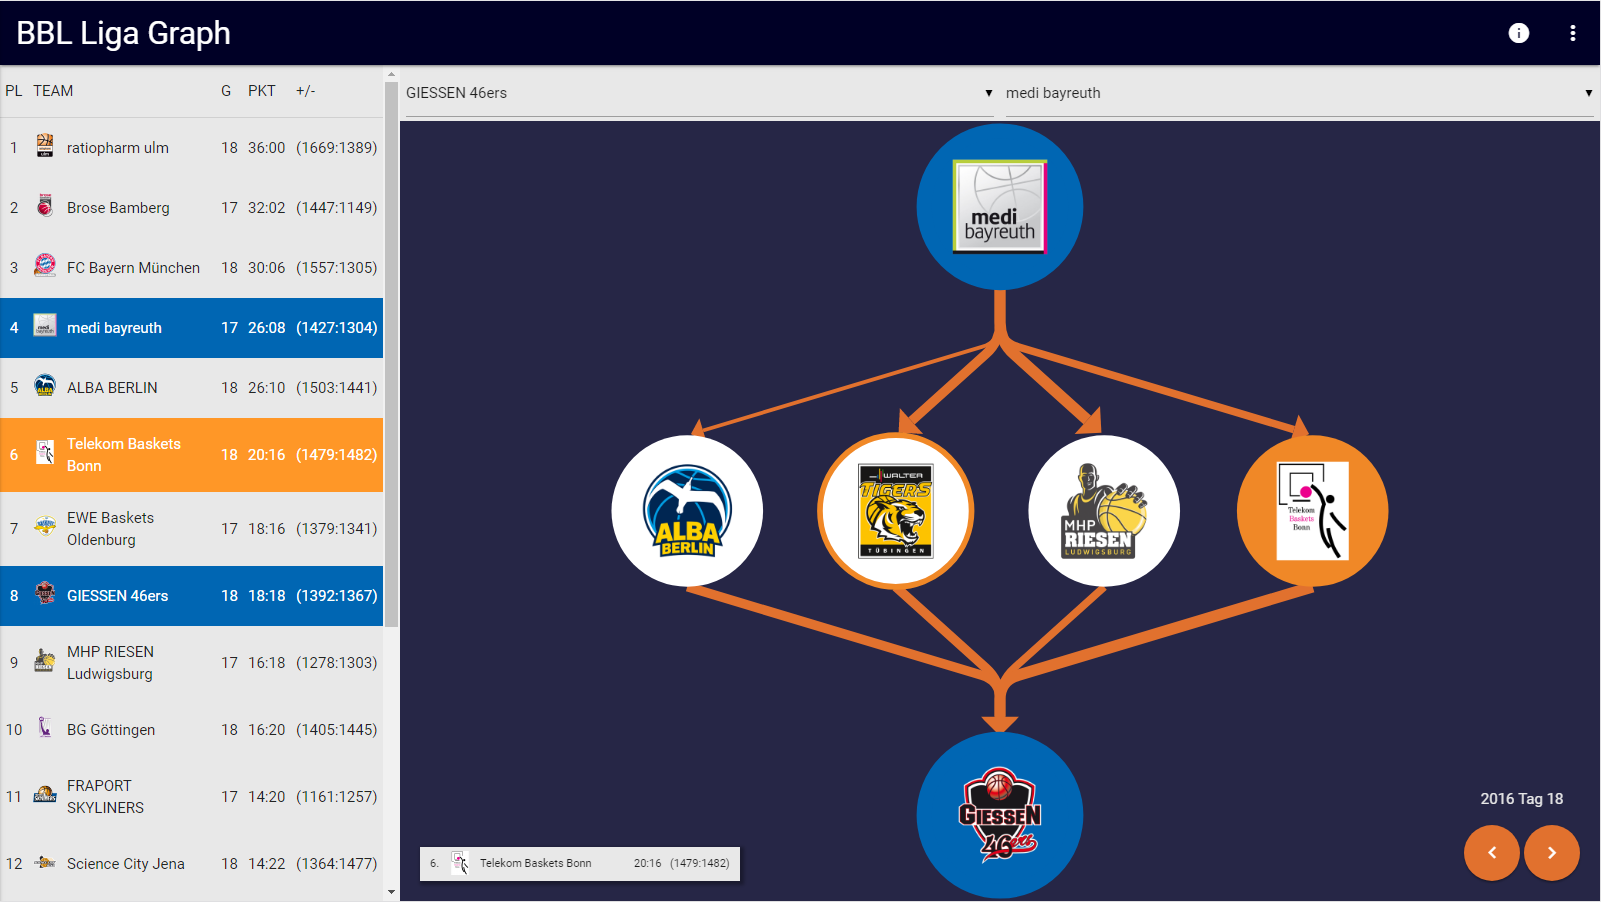
BBL Liga Graph - Eine App für die Basketball Bundesliga
“BBL Liga Graph” - eine App für die Basketball Bundesliga - a webapp for the German basketball league.
2017-9-1
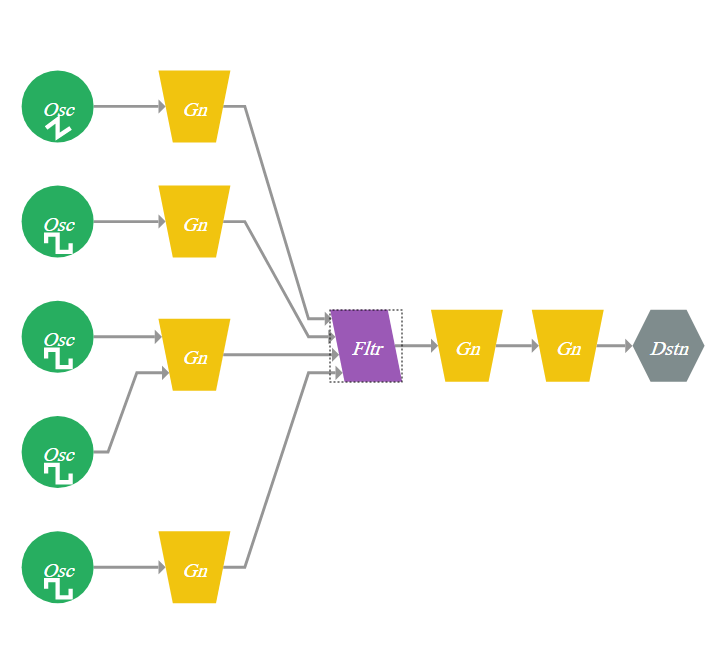
Project #1: The Sound Graph
“Sound Graph” - this year's winning project of our annual “Project Days” for yWorks developers
2017-4-12
yWorks releases version 2.0.1 of yFiles for HTML!
2017-3-31
yWorks releases version 1.4 of the 1.x technology line of yFiles for HTML!
2016-12-13
yWorks releases version 2.0 of yFiles for HTML!
2015-8-24
yWorks releases version 1.3 of yFiles for HTML!
2015-3-20
yWorks releases version 1.2.1 of yFiles for HTML!
2014-8-22
New yFiles for HTML API Documentation.
2014-5-16
yWorks releases version 1.2 of yFiles for HTML!
2014-3-13
Third EAP version of the yFiles for HTML GWT Extension available!
2013-5-7
yWorks releases version 1.1 of yFiles for HTML!
2012-9-25
yWorks releases yFiles for HTML 1.0!
2012-2-13
Coming soon: yWorks announces yFiles for HTML
All Articles
Latest Blog Posts
Working with Graphs in Augmented - and Virtual-Reality
RobyGraph Cosmic Graph Strategy
From Experiments to Agents: How yWorks Uses AI to Democratize Graph Visualization
Making AI-generated diagrams useful and interactive
Enabling LLM development through knowledge graph visualization
Use Cases
Business process management
Company structures
Data management
Supply chain management
Test and experience
yFiles free
of charge!
Free support
Fully functional
100+ source-code examples
Try now