What's new in the major release of yFiles for the web platform?
yFiles version 2.6 brings a wealth of powerful new features and improvements that strengthen the graph visualization capabilities of developers. With major improvements to the organic layout, enhanced label placement, a node alignment utility, compact star structure rendering, custom node ordering for the radial layout, easy CSS styling for built-in styles, HTML5 rendering as another rendering backend, and streamlined development workflows, yFiles empowers developers to create visually appealing, interactive, and informative graph visualizations. The new and enhanced demos, advanced customization options, and step-by-step tutorials further improve developer productivity, providing valuable guidance and support throughout the graph visualization journey. By valuing user feedback and continuously innovating, yFiles remains a top choice for developers seeking to unlock the true potential of their data through graph visualization.
In this article, we’ll explore the major new features and improvements brought by yFiles 2.6, focusing on the areas of graph layout algorithms, rendering and visualization, and developer productivity.
Automatic Graph Layouts
New Organic Layout Constraints: Clarifying Complex Networks
Traditionally, the organic layout algorithm arranges elements on the canvas using a force-directed approach, which produces visually pleasing visualizations of complex networks. However, the variability inherent in this approach can make it challenging to highlight specific aspects of the data or ensure consistent visual representations.
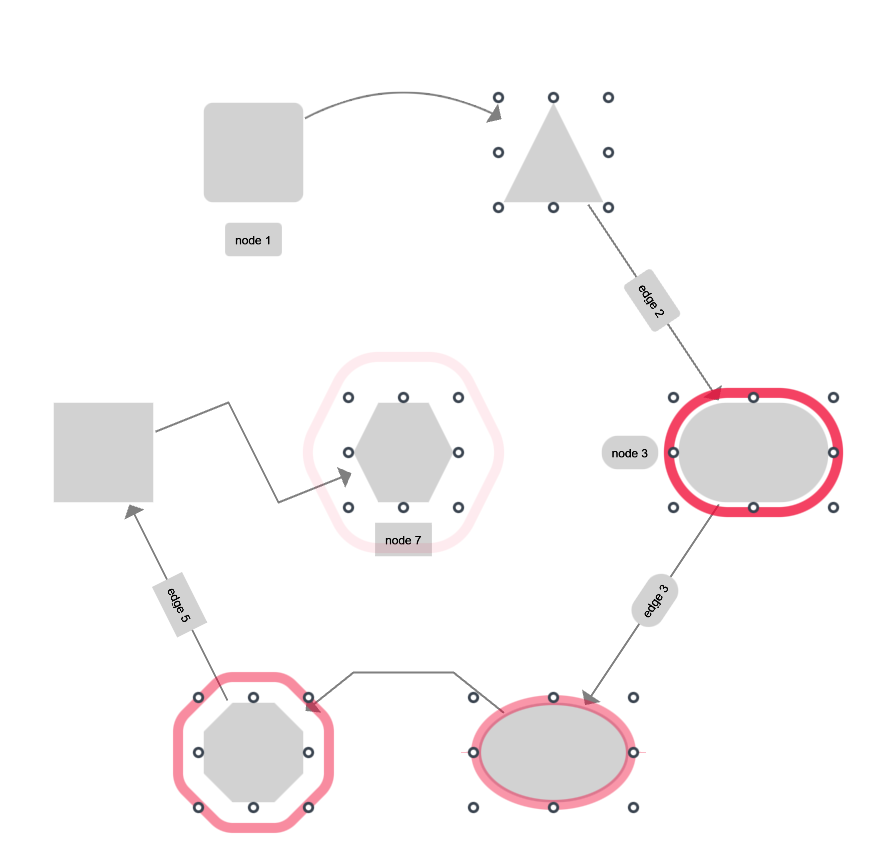
With the layout constraints introduced in version 2.6, developers can now guide the organic layout algorithm to position nodes in specific ways that align with their envisioned representation of the data. Constraints can allow nodes to be organized into chains, placed on circles, or arranged in grids, even if they are not directly connected by edges! This flexibility enables developers to bring hidden relationships to the forefront, emphasizing important aspects of the graph that might not be explicitly represented by edges.
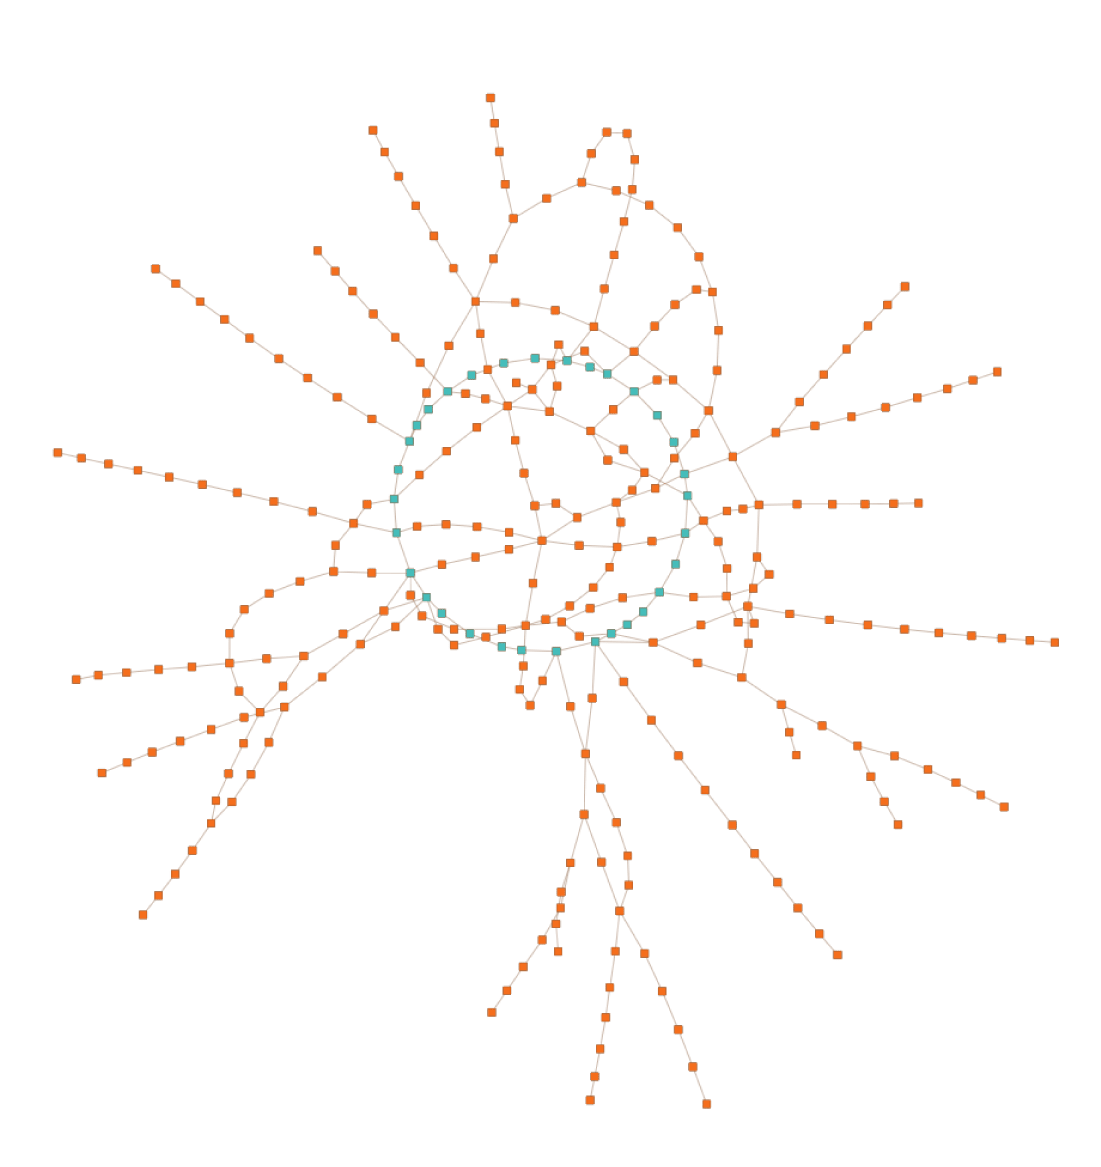
Note, however, that you should carefully consider highlighting hidden relationships like this when the relationship itself does not manifest as an edge in the diagram. When you introduce constraints on elements that are seemingly unrelated in the graph structure in order to highlight important aspects in the graph, you might also consider “materializing” these relationships in the diagram and vice versa. In other words, if your graph has many unimportant edges, consider excluding them from the layout process or only show them when the user interacts with the diagram. Do not put constraints on every node, unless your graph has a limited number of edges.
Organic Layout with Constraints Demo
But that's not all. The organic layout also learnt how to properly consider and place edge labels along the edges!This effectively avoids potential overlaps and makes it clearer for the user to see which edge the labels belong to.
Tabular Layout: Supporting Compact Orthogonal Edge Routing
The simple tabular layout style introduced in an earlier version in yFiles places nodes in a regular grid.However, by default, it does not apply a sophisticated edge routing to the edges between the nodes. In fact, it does not even consider them at all. Until now.
We came up with a way to reuse the simple algorithm and combine it with our advanced automatic orthogonal edgerouting algorithms. This results in super compact and clear visualizations.
In the sample, you can see how the new algorithm cleverly sorts the nodes into the table cells, dramaticallyimproving the resulting edge routing.
Node Alignment Utility: Achieving Technical Views and Simplified Edge Routing
To create more technical views and streamline edge routing, yFiles introduces the node alignment utility. This powerful tool can be seamlessly integrated into automatic graph layout pipelines, enabling developers to post-process layout results and align nodes based on specific requirements. By aligning nodes strategically, developers can improve the overall organization of the graph, making it easier to follow connections and understand the underlying structure. The node alignment utility empowers developers to create visually coherent and technically precise graph visualizations.
Applying the node alignment utility in pre- or post-processing step in automatic layouts enables benefits such as producing channels where you can route the edges without bending.
But that's not all! This utility can also enhance interactive editing experiences and guide the user into interactively placing elements nicely on the canvas without requiring a traditional rigid grid.
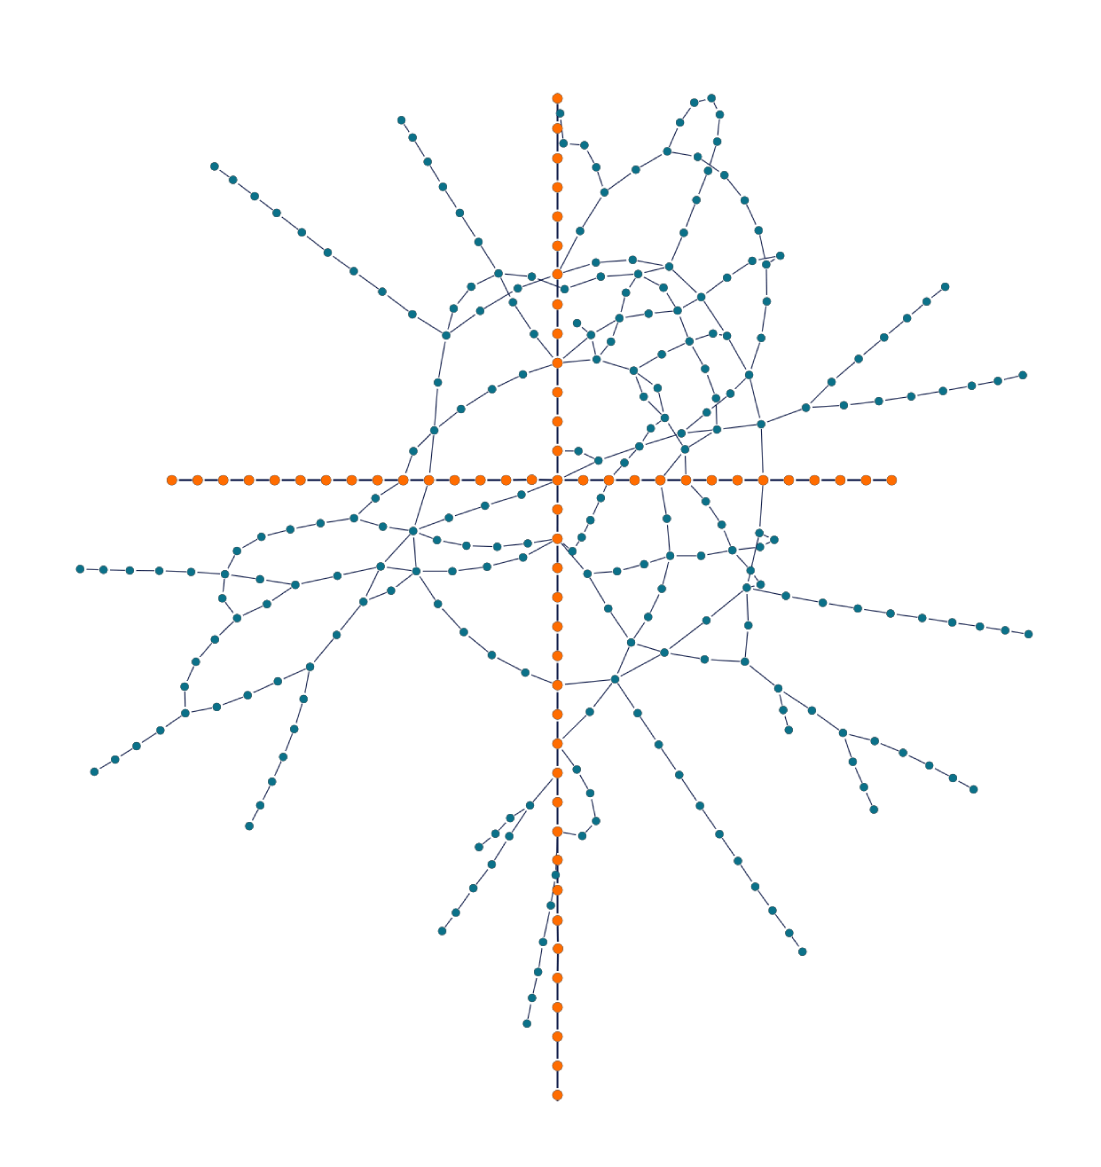
Compact Star Structures: Streamlining Circular Layouts
The compact star rendering feature, introduced in the previous major release of yFiles, continues to enhance circular layouts in version 2.6. By efficiently handling star substructures, this feature improves the clarity and effectiveness of circular layouts. The compact star rendering capability significantly improves the representation of hierarchical relationships within the graph, enabling users to gain deeper insights into complex structures.
This feature also works with semantic node types, so if your nodes have different semantic meanings, but otherwise are structurally identical in the graph, the algorithm can make use of this optional information in order to create more helpful and easier to understand layouts.
Node Ordering for Radial Layout: Enhanced Organization and Discoverability
The radial layout in yFiles version 2.6 introduces support for semantic node types and ordering elements. With this feature, developers can provide comparable values to automatically sort elements based on their importance or other criteria. By intelligently ordering nodes within the visualization, developers can guide users' attention and facilitate efficient exploration of the graph.
Visualization and Rendering
CSS Styling: Unleashing Creativity and Customization
The addition of CSS class styling support to the built-in styles in yFiles version 2.6 opens up new horizons for visual customization. With CSS styling, developers can apply custom styles, transitions, and animations to graph elements, enabling the creation of visually stunning and dynamic graph visualizations. This powerful feature enhances the visual experience, captivates users' attention, and elevates the overall quality of graph representations.
const labelStyle = new DefaultLabelStyle({
  cssClass: 'label invisible', // fade-in labels on hover
  backgroundFill: 'rgba(255, 255, 255, .7)',
  shape: 'round-rectangle'
})
/* Labels */
.label {
opacity: 1;
transition-property: opacity;
}
.label.invisible {
opacity: 0;
}
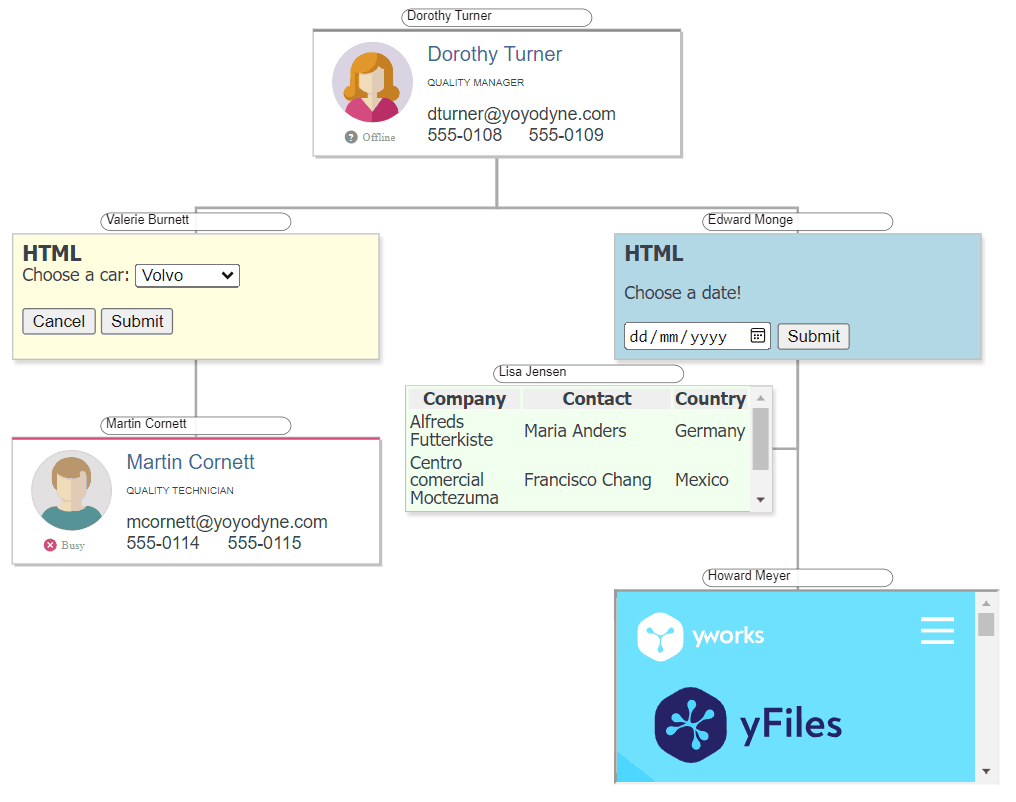
HTML5 Rendering: Flexibility and Interactivity at Your Fingertips
Since its inception, yFiles has supported SVG and HTML5 Canvas, and later added WebGL 1 and 2. Developers can utilize all these rendering technologies simultaneously in the same diagram, offering unparalleled flexibility in rendering their graphs.
SVG provides developers with flexibility, fidelity, and the ability to apply CSS styling, animations, and transitions. Initially, Canvas excelled in rendering large graph visualizations while maintaining ease of use. WebGL, on the other hand, offers exceptional performance, although it requires delving into the lower-level platform API or trading off some flexibility by relying on yFiles' WebGL style implementations.
While SVG remains the recommended option whenever feasible, there are situations where using regular HTML becomes more convenient. With yFiles for HTML 2.6, developers can now leverage HTML to render significant amounts of text, tables, interactive UI elements, and other content within nodes, labels, and other parts of their diagrams. Notably, the performance of HTML rendering in modern browser engines is remarkably efficient.
New WebGL2 Rendering: Enhanced Styling and Performance
Previous yFiles releases had introduced stunning styling options for selection in the WebGL2 rendering backend, and with this latest release, those options are now also available for high-fidelity traditional SVG-based rendering. Developers can now seamlessly mix SVG graph item rendering with WebGL2 selections, highlighting, and focus indicators, allowing for a wide range of visual combinations. Leveraging the new animations for beacons and halos for highlight decoration can greatly enhance the aesthetic appeal of applications, resulting in visually captivating graph visualizations.
The WebGL2 backend has gained significant popularity among yFiles users, particularly for rendering large graphs. Many customers have embraced the examples provided by yFiles, which automatically switch between SVG and WebGL2 based on the level of detail. This use-case wasn't initially anticipated as the main use-case for WebGL2 rendering. With more customers using this, a performance issue that results in short pauses during switching became apparent, especially on slower hardware and systems. To address this, we implemented multiple solutions. First, WebGL shaders can now be precompiled before rendering the graph, optimizing performance. Second, developers receive notifications when asynchronous compilation is complete, enabling them to enhance the user experience. Third, yFiles can now manage the two visualizations in parallel without having to rebuild one when switching between them, thus massively improving responsiveness during the switch. Additionally, for the slowest hard and software combinations, yFiles has introduced staggered loading of text labels, resulting in a more responsive user interface, particularly when dealing with thousands of WebGL labels.
In terms of label rendering, WebGL2 brings a new feature that aligns and wraps text inside shapes, similar to what was already possible with SVG rendering. This enhances the presentation and readability of labels within the graph visualization. Lastly, yFiles version 2.6 includes three highly requested features for the default group node style visualization. Group nodes can now be rendered with a transparent content pane, allowing for more visually appealing group representations. The tabs within group nodes both in SVG and WebGL rendering modes automatically adapt their size to accommodate label contents, eliminating the need for manual size adjustments. Additionally, a new simple style variant has been introduced, providing developers with more styling options to customize group node visualizations.
Developer Productivity
Enhanced Templating Mechanism and Framework Integration

In addition to the rendering improvements, yFiles version 2.6 introduces enhancements to the templating mechanism, specifically tailored for popular frameworks such as React, Vue.js, Angular, Svelte, Solid, Lit, and others. New and enhanced demos provide reusable components for rendering SVG and HTML-based node and label visualizations with the help of the various templating and data-binding technologies.
To demonstrate the capabilities of the enhanced templating mechanism, existing demos have been modified to support the new HTML rendering features. E.g. React's functional components are utilized to render node and label visualizations in the React JSX Component style demo.
React JSX Component Style Demo
Enhanced Demos and Streamlined Development Workflow
To improve developer productivity and facilitate exploration of yFiles features, the yFiles team has revamped the demos accompanying version 2.6. These demos cover a wide range of scenarios, from basic graph visualizations to more complex use cases with advanced interactions.
The introduction of Vite, a development server, simplifies the processof working with the demos. Vite offers features like hot reload, allowing developers to instantly see the impact of their changes and iterate rapidly. The demos have also been reworked to make it easier to extract and reuse specific functionality, streamlining the integration of various yFiles features into developers' projects.
Advanced Customizations and Step-by-Step Tutorials
In addition to the core features, one of yFiles' strength is the unmatched set of advanced customization options, empowering developers to tailor the library to their specific needs. The new release again includes improvements in TypeScript typings, enabling cleaner and more type-safe coding practices. These enhancements not only boost code quality but also enhance developer productivity by providing a smoother development experience. Furthermore, the package contains step-by-step tutorials that guide developers through complex tasks, ensuring they can fully harness the power of yFiles.
Try the new features yourself!
This article does not begin to exhaust the wealth of powerful features and improvements introduced in this major release.
See the official yFiles for HTML release notes for more exhaustive list of the features we added to yFiles for HTML 2.6.
Most topics in this article are also covered in our webinar What’s new in yFiles 2023, which you can watch on YouTube:
Whether you're new to yFiles for HTML or want to try out the new version, we invite you to download yFiles for HTML, today!
And if you are interested in seeing some code, first, please do take a look at our GitHub repository which contains the TypeScript and modern EcmaScript sources for all the demos we provide.
As always: Happy diagramming with yFiles!