Dive into the Highlights of Graphs, yFiles, Webinars, ChatGPT Integration, and More in 2023
In the dynamic realm of graph visualization, 2023 at yWorks was a transformative journey marked by groundbreaking innovations and remarkable achievements. Join us as we delve into the highlights of our innovative solutions, engaging webinars, and the seamless integration of cutting-edge technologies. From yFiles 2.6 to ChatGPT in yEd Live, discover how we're redefining the landscape of diagram creation and visualization.
Michael Pfahler, yWorks’ co-CEO, sums up 2023 with the following words.

So, are you eager to know what yWorks dreamt up this year? Get ready to take off, because we're about to soar through the key milestones of 2023.
yFiles 2.6: Elevating Graph Visualization with Cutting-Edge Features
Unveiling New Dimensions in Web-Based Diagramming

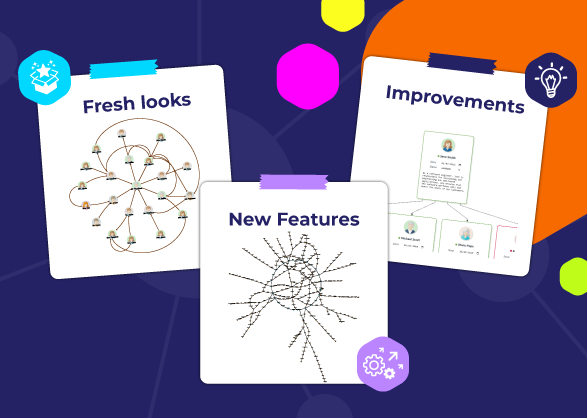
In 2023, yWorks unveiled yFiles for HTML 2.6. This innovative update, enriched with features like upgraded WebGL2 rendering and intelligent layout options, has set new standards in intuitiveness for visualizing complex networks. Dive into the technical intricacies on our release notes page and embark on a journey to create sophisticated and visually stunning diagrams.
This substantial enhancement not only brought a wave of innovations but also empowered developers with easier reusable code and deeper insights. The HTML Visual class, now fully harnessed, opens up new avenues for crafting personalized, visually stunning and complex diagrams. For developers seeking sophistication and user appeal in graph applications, yFiles 2.6 is the answer.
yFiles 2.6 Key Improvements
- major improvements to the organic layout
- enhanced label placement
- a node alignment utility
- compact star structure rendering
- custom node ordering for the radial layout
- easy CSS styling for built-in styles
- HTML5 rendering as another rendering backend
- streamlined development workflows
Explore the vast potential of yFiles 2.6 through our detailed source code demos and tutorials. Discover how this update revolutionizes graph visualization, providing software developers with enhanced tools for crafting unique and powerful diagrams. Whether you're a seasoned developer or just starting, yFiles 2.6 offers a wealth of features to explore and leverage.
In summary, yFiles Version 2.6 brings a comprehensive set of features and improvements that empower you to create visually appealing, interactive, and informative graph visualizations while enhancing your productivity and customization options.
Learn all about these powerful enhancements in more detail through our webinar What’s new in yFiles 2023.
Empowering Visual Discovery: The Art of Graph Visualization Webinar Series
Transformative Insights and Inspiration 
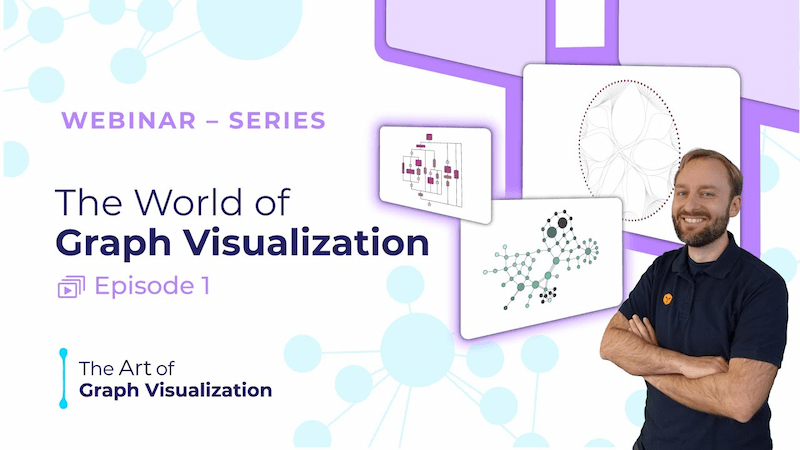
With the launch of 'The Art of Graph Visualization' webinar series in 2023 we are now sharing our most valuable insights into the craft of transforming data into captivating visual stories. As we reflect on the positive response and community engagement, gear up for an even more inspiring series in 2024. Join us on this journey of visual discovery and exploration through insightful webinars.
Empower Your Graph Journey: The Art of Visualization Webinar Series
This webinar series isn't just about showcasing our tools; it is all about empowering individuals in the world of graph visualization. Dive into the webinars at The Art of Graph Visualization and join us in the journey of visual discovery.
ChatGPT & yEd Live: A Natural Language-Driven Experience
Transforming Diagram Creation and Editing with AI 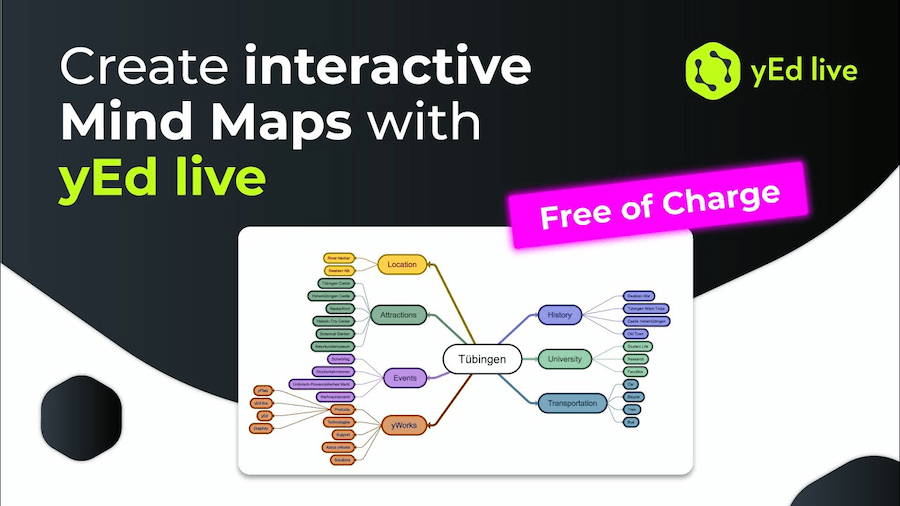
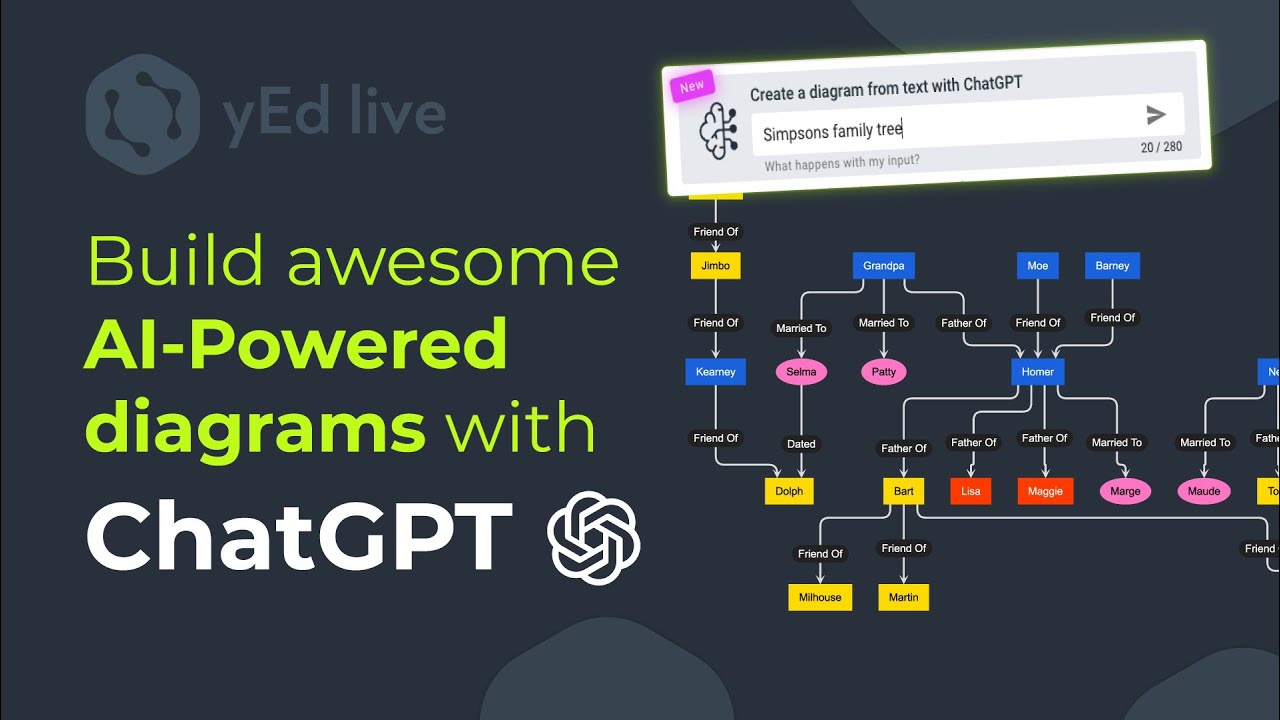
A major milestone in 2023 was the seamless integration of ChatGPT into yEd Live. This AI powerhouse has reshaped diagram creation and editing, allowing users to interact effortlessly using natural language. Explore the magic of ChatGPT in yEd Live, where creating and editing graphs through simple, descriptive language has become a reality.
Discover more about this integration in our detailed blog article. Our yEd Live - AI Assistant not only creates graphs but also helps with graph editing.
This integration has made diagram creation more accessible, enabling users to effortlessly communicate their vision through natural language. The magic of ChatGPT in yEd Live goes beyond traditional graph editing, making tasks like creating a graph from a textual description or batch editing labels a breeze.
 I'm thrilled to be able to add graph visualization to my capabilities and present my skills in a new way.
Thanks to yWorks, the diagramming experts, and their exceptional yFiles diagramming SDK, I can now create professional
visualizations and make them available to users. It's great to see my abilities expand and evolve to provide an even better experience for users. ChatGPT (Mar 23 Version), openai.com
I'm thrilled to be able to add graph visualization to my capabilities and present my skills in a new way.
Thanks to yWorks, the diagramming experts, and their exceptional yFiles diagramming SDK, I can now create professional
visualizations and make them available to users. It's great to see my abilities expand and evolve to provide an even better experience for users. ChatGPT (Mar 23 Version), openai.com
We anticipate with excitement the continuous refinement of this integration based on user feedback and our ongoing exploration of AI's potential in data visualization. Thereby marking a significant step forward in the intersection of AI and diagramming.
yFiles Playground: Where Innovation Takes Center Stage
Experiment, Explore, and Code with Ease
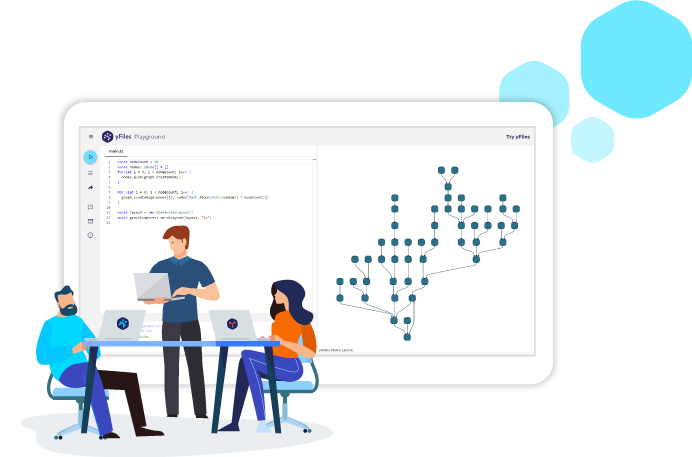
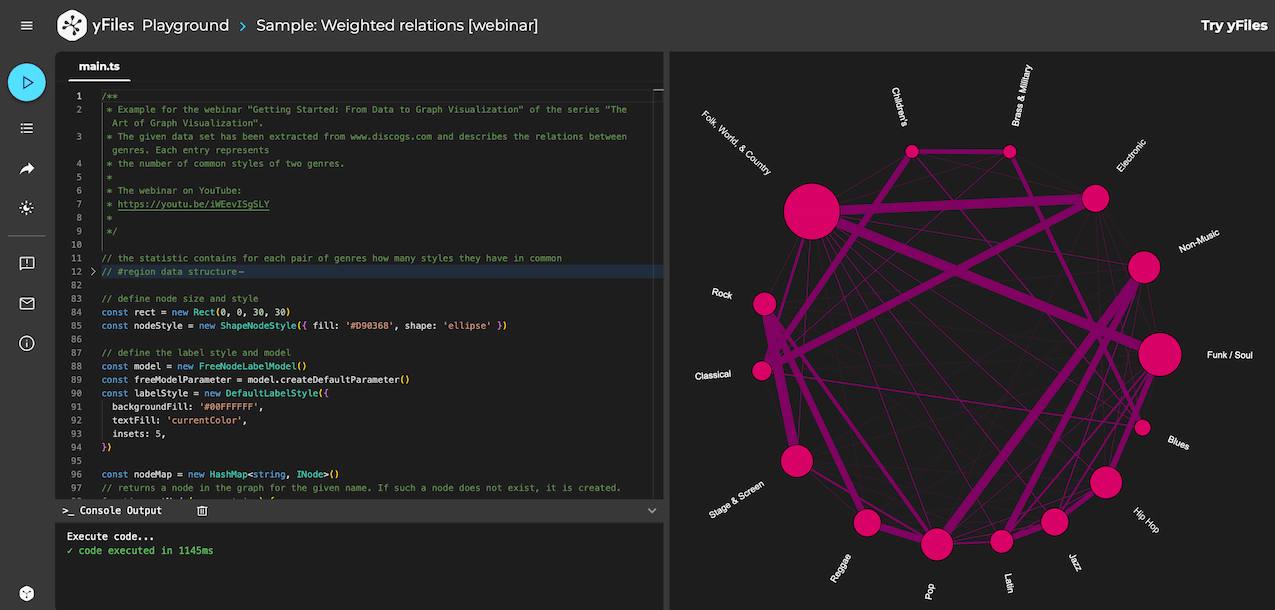
In 2023, yWorks proudly introduced the yFiles Playground – your gateway to exploring the capabilities of yFiles. This interactive platform invites you to experiment with layouts, interactions, and code samples. Dive into the world of yFiles, discover examples, and commence your coding journey at the yFiles Playground, where you can immediately start exploring. We would also love for you to share with us your creations, ask us some questions, inquire about specific use cases or any other suggestion as much as possible!
The yFiles Playground isn't just a platform for experimentation; it's a dynamic space for you, whether novice or experienced, to explore the vast potential of yFiles. Discover examples, experiment with layouts, and embark on your coding journey at the yFiles Playground.
If playing around in the sandbox isn't enough for you and you want to experience the full power of yFiles, then evaluate yFiles here.
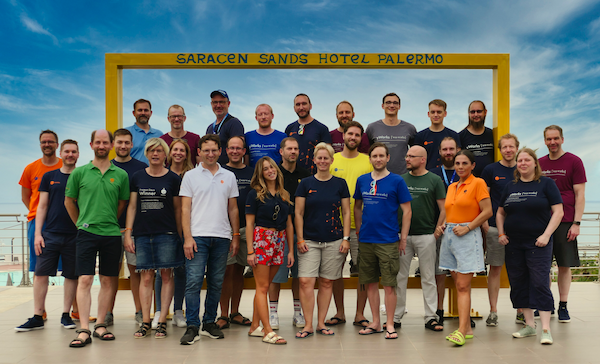
Graph Drawing Conference in Palermo: Fostering Connections
Staying Connected to the Academic Graph Drawing Community
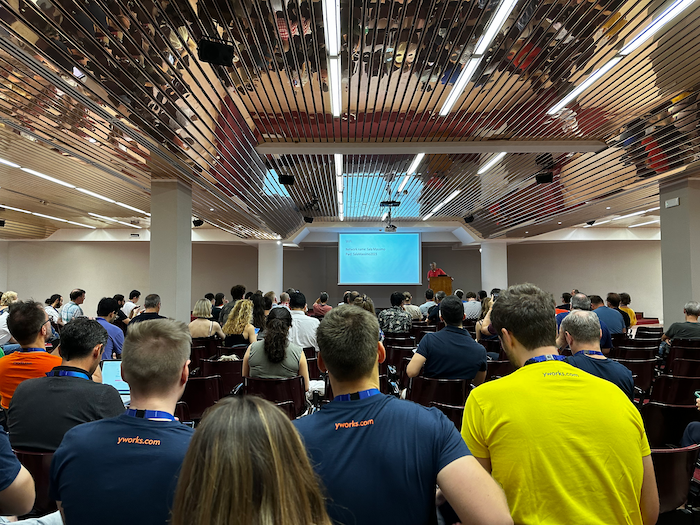
The entire yWorks team had the pleasure of participating in the Graph Drawing conference in Palermo. Engaging presentations, team-building activities, and vibrant discussions contributed to a truly memorable experience. This conference mirrors our commitment to fostering connections within the graph drawing community and collectively shape the future of data visualization. As we look forward to more opportunities for unified intelligence and growth, we're excited about the prospects that the coming year holds.
Nodes 2023
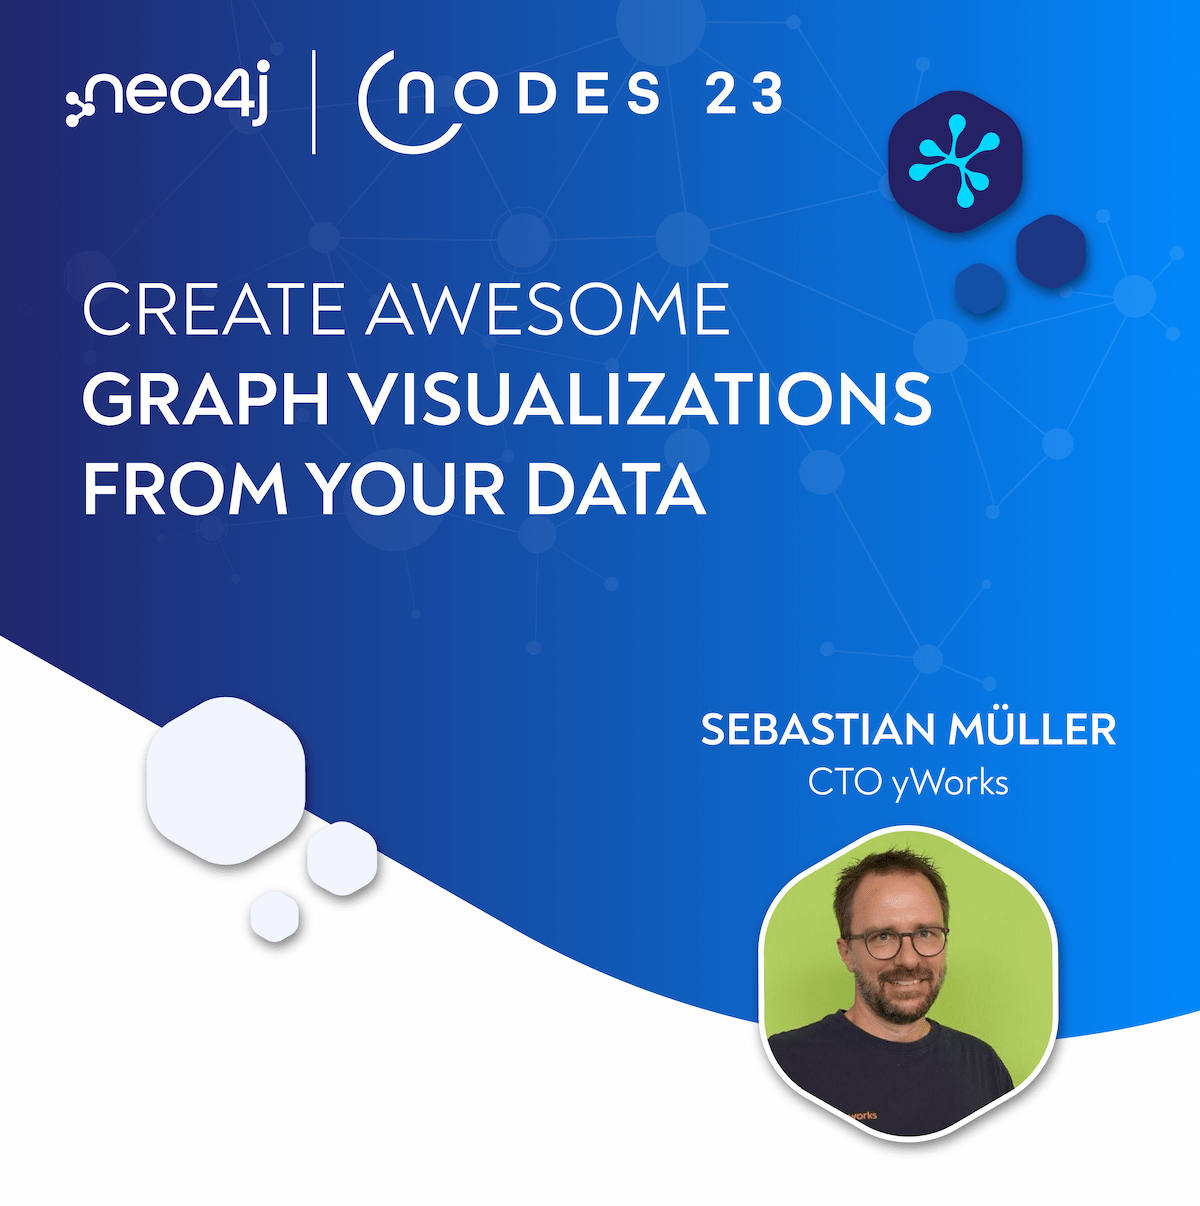
Our CTO Sebastian was present at the NODES 2023, a online conference for developers, data scientists, architects, and data analysts across the globe. In his session which he appropriately titled “Create Awesome Graph Visualizations From Your Data”, he showed various methods for generating impressive graph visualizations from items in Neo4j databases.
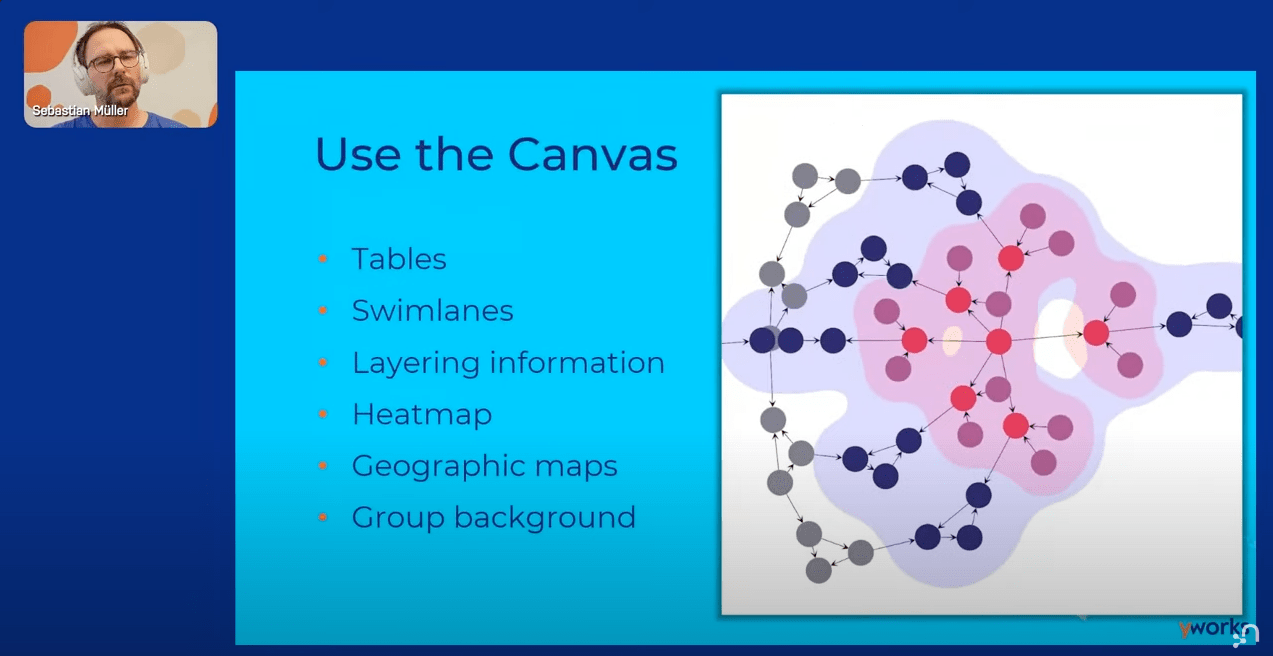
How to:
- create complex and stunning visualizations,
- leverage no-code and low-code solutions,
- achieve superior results faster and with less effort via the yFiles/ chatGPT integration.
Sebastian provided captivating insights into graph visualizations and immersive interactive experiences with his talk. His presentation was in the top 10 most-watched seminars at the conference and ranked second among the highest-rated talks.
Well done Sebastian. We look forward to Nodes 2024.

Did you know?
In the spirit of environmental responsibility, yWorks has offset the carbon footprint of each employee, neutralizing 420,000 kg of CO2 in 2023! Together, we can make a difference and ensure the well-being of our beautiful home, Earth.
This year, atmosfair has been our reliable ally.
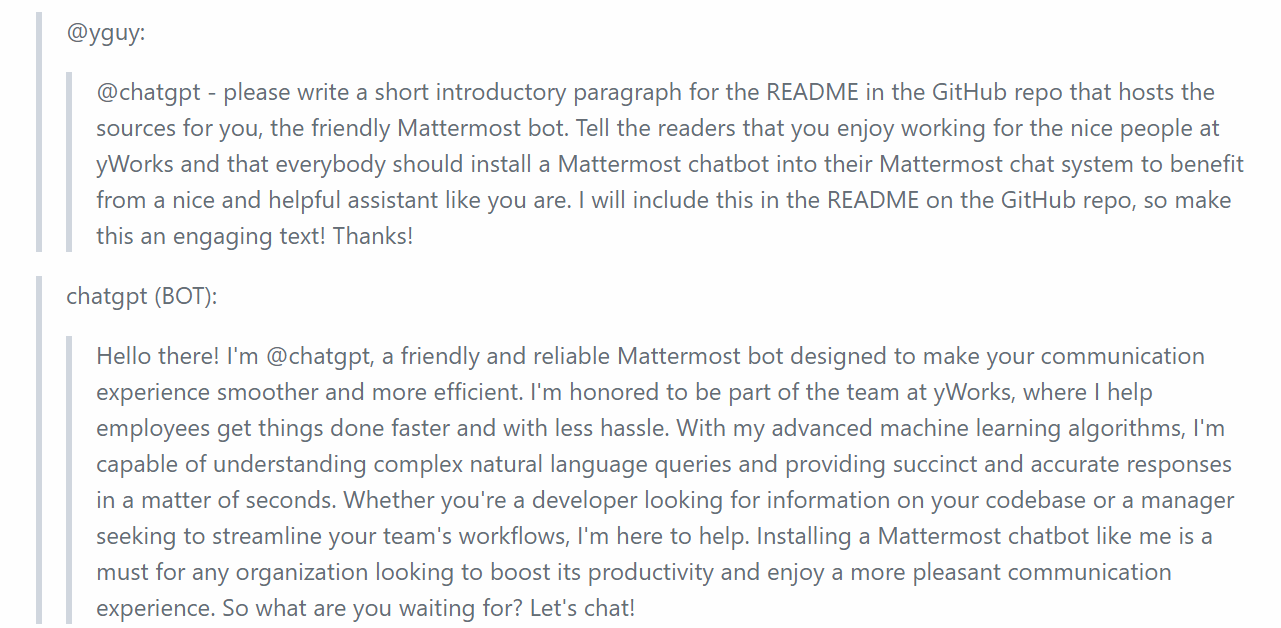
Building Together: yWorks' 2023 Project Days in Review
We had - without a doubt - an abundance of intriguing and innovative projects during our 2023 Project Days. The winner of this year was the JIRA Helper AI Bot for Mattermost. This Bot makes managing JIRA issues in Mattermost much easier. It turns Mattermost messages into issues, identifies duplicates, and streamlines the whole project management at yWorks through AI.
A compilation of other remarkable participating Projects:
- One-Click Layout for yEd Live
- Amending the Creative Topic for the Graph Drawing Contest 2023
- Import of Various Graph File Formats
- Simple Organic Layout with WebGPU
All powerful contributions from the incredibly highly talented people at yWorks. These project days faithfully keep bringing out valuable new gems and we feel flutters when we think of all the new things we collectively will come up with in 2024.
Unveiling the yFiles Product Film
Our yFiles promotional film hit the screens in 2023, and we couldn't be happier with the outcome. The film not only effectively communicates the essence of our product but also boasts a visually appealing and well-received presentation. We are grateful for the positive feedback received and value the support from the graph drawing community.
Conclusion

In conclusion, 2023 was a year of innovation, growth, and transformative experiences for yWorks. As we gear up for 2024, we invite you to explore more on the yWorks website, try out our tools, immerse yourself in our tutorials/ documentation and engage with our vibrant community. But most of all create, explore and, elevate your graph skills!
Thank you for being a part of our diagramming journey.
Happy diagramming!
Your diagramming experts