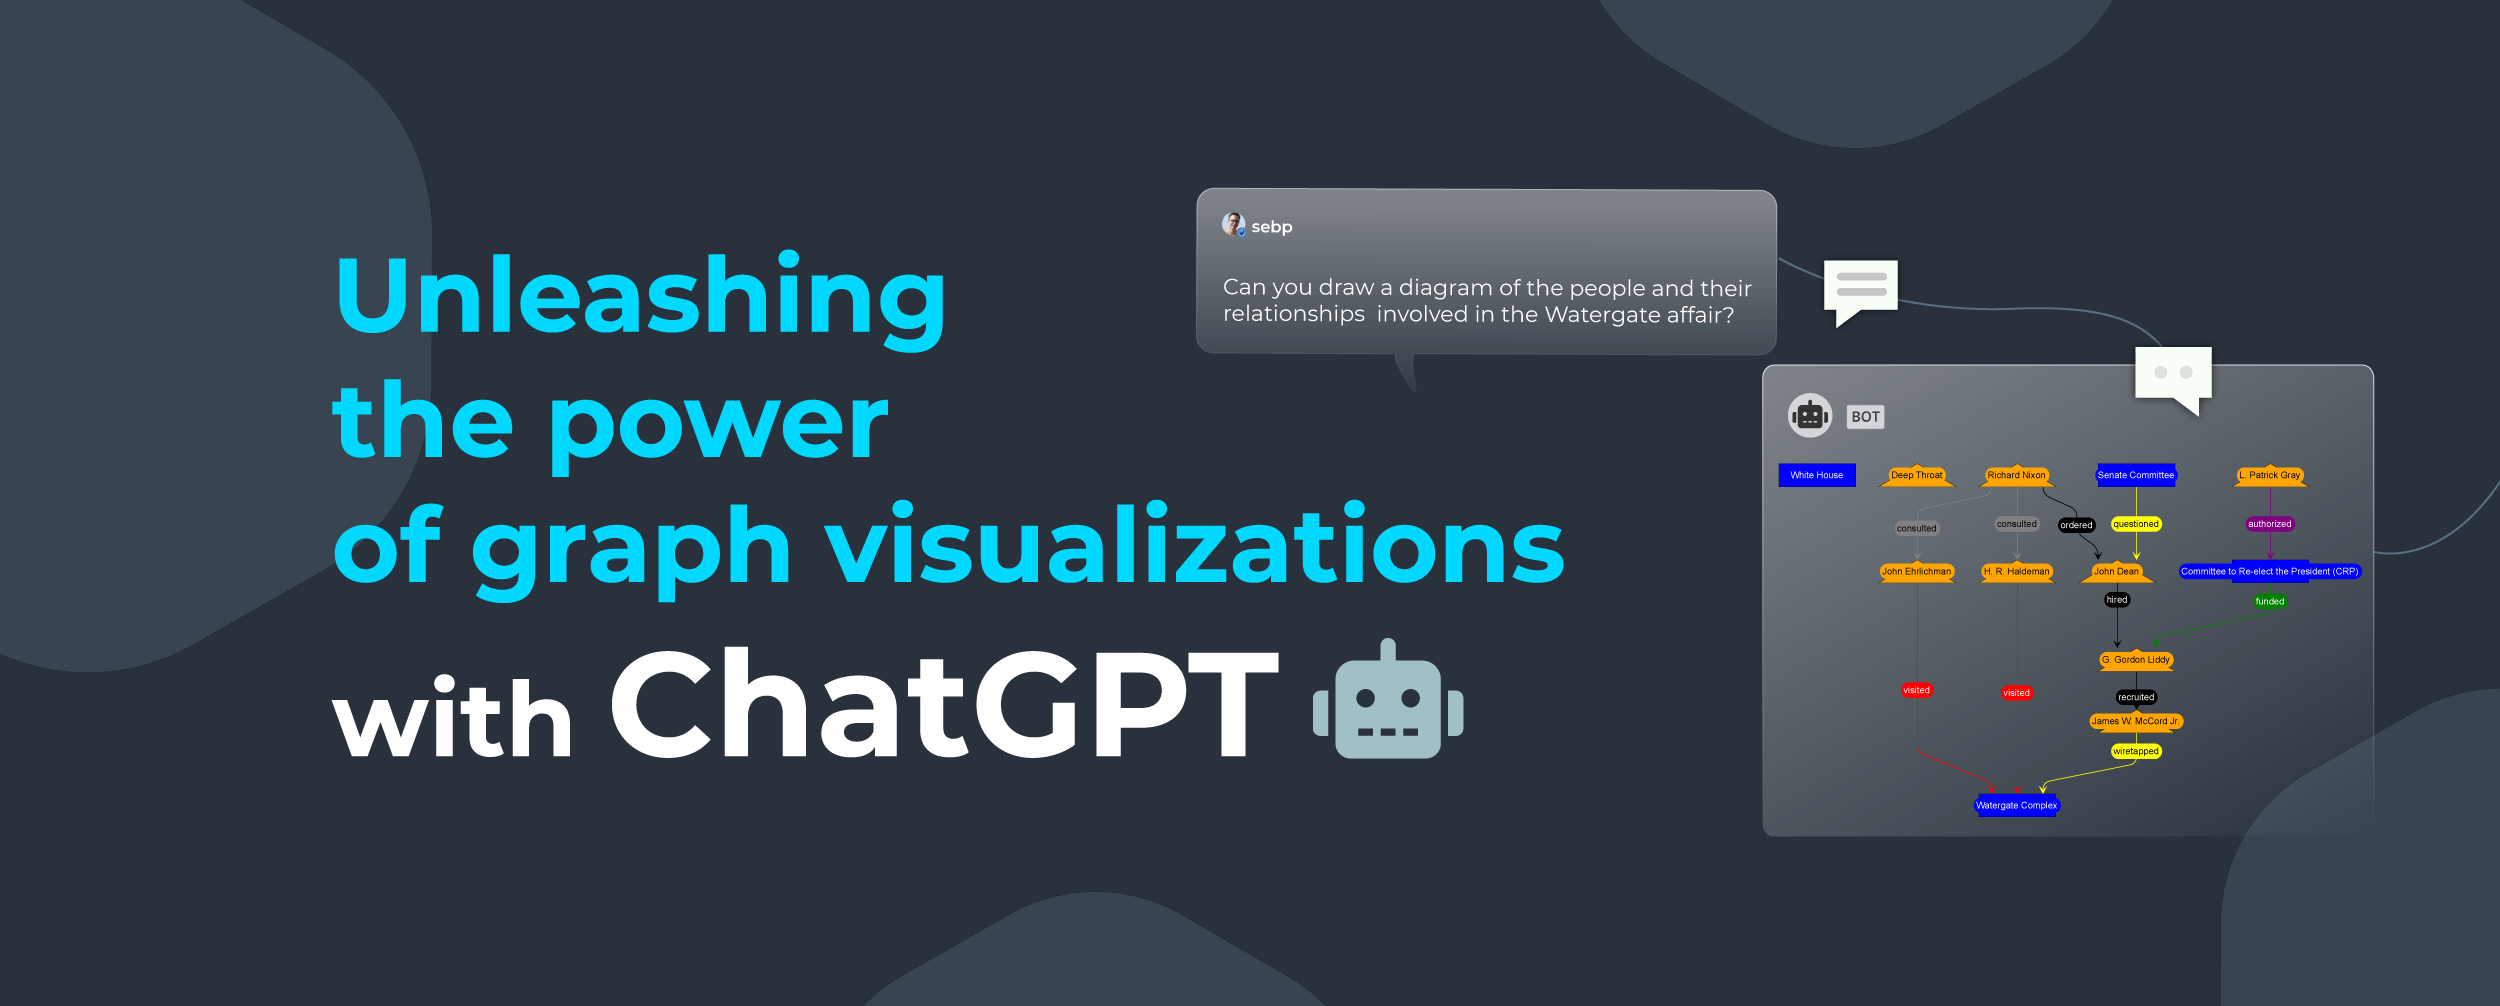
Transforming text descriptions into clear diagrams
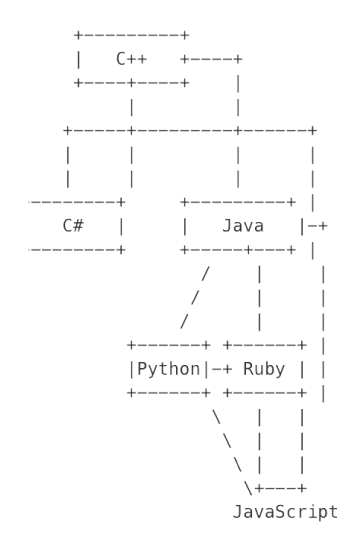
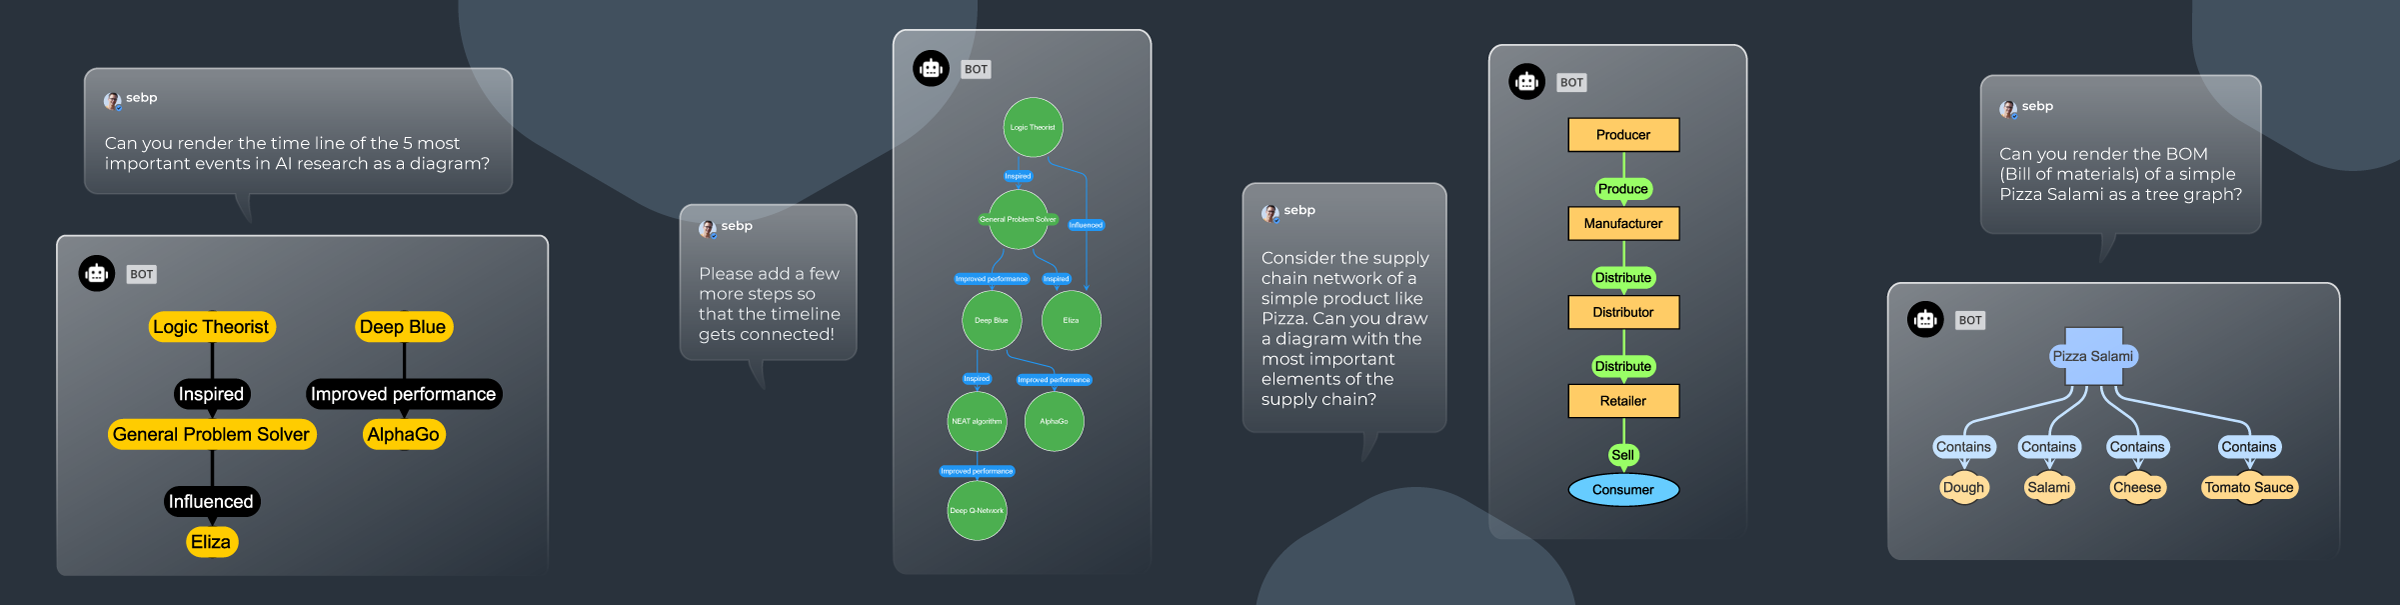
Imagine you want to ask ChatGPT about the relationships in some connected data (e.g. a family tree). The ChatGPT replies will be either completely text-based, or contain rudimentary "ASCII-art". However, grasping the structure of relational data is much easier with a suitable visualization of the underlying data: in such cases, a picture is definitely worth a thousand words. So naturally, when the ChatGPT Plugin API was announced, we immediately thought of the great value a yFiles plugin could have for ChatGPT users. We quickly created a prototype for a ChatGPT plugin that can transform ChatGPT's textual descriptions of such data into beautiful diagrams:
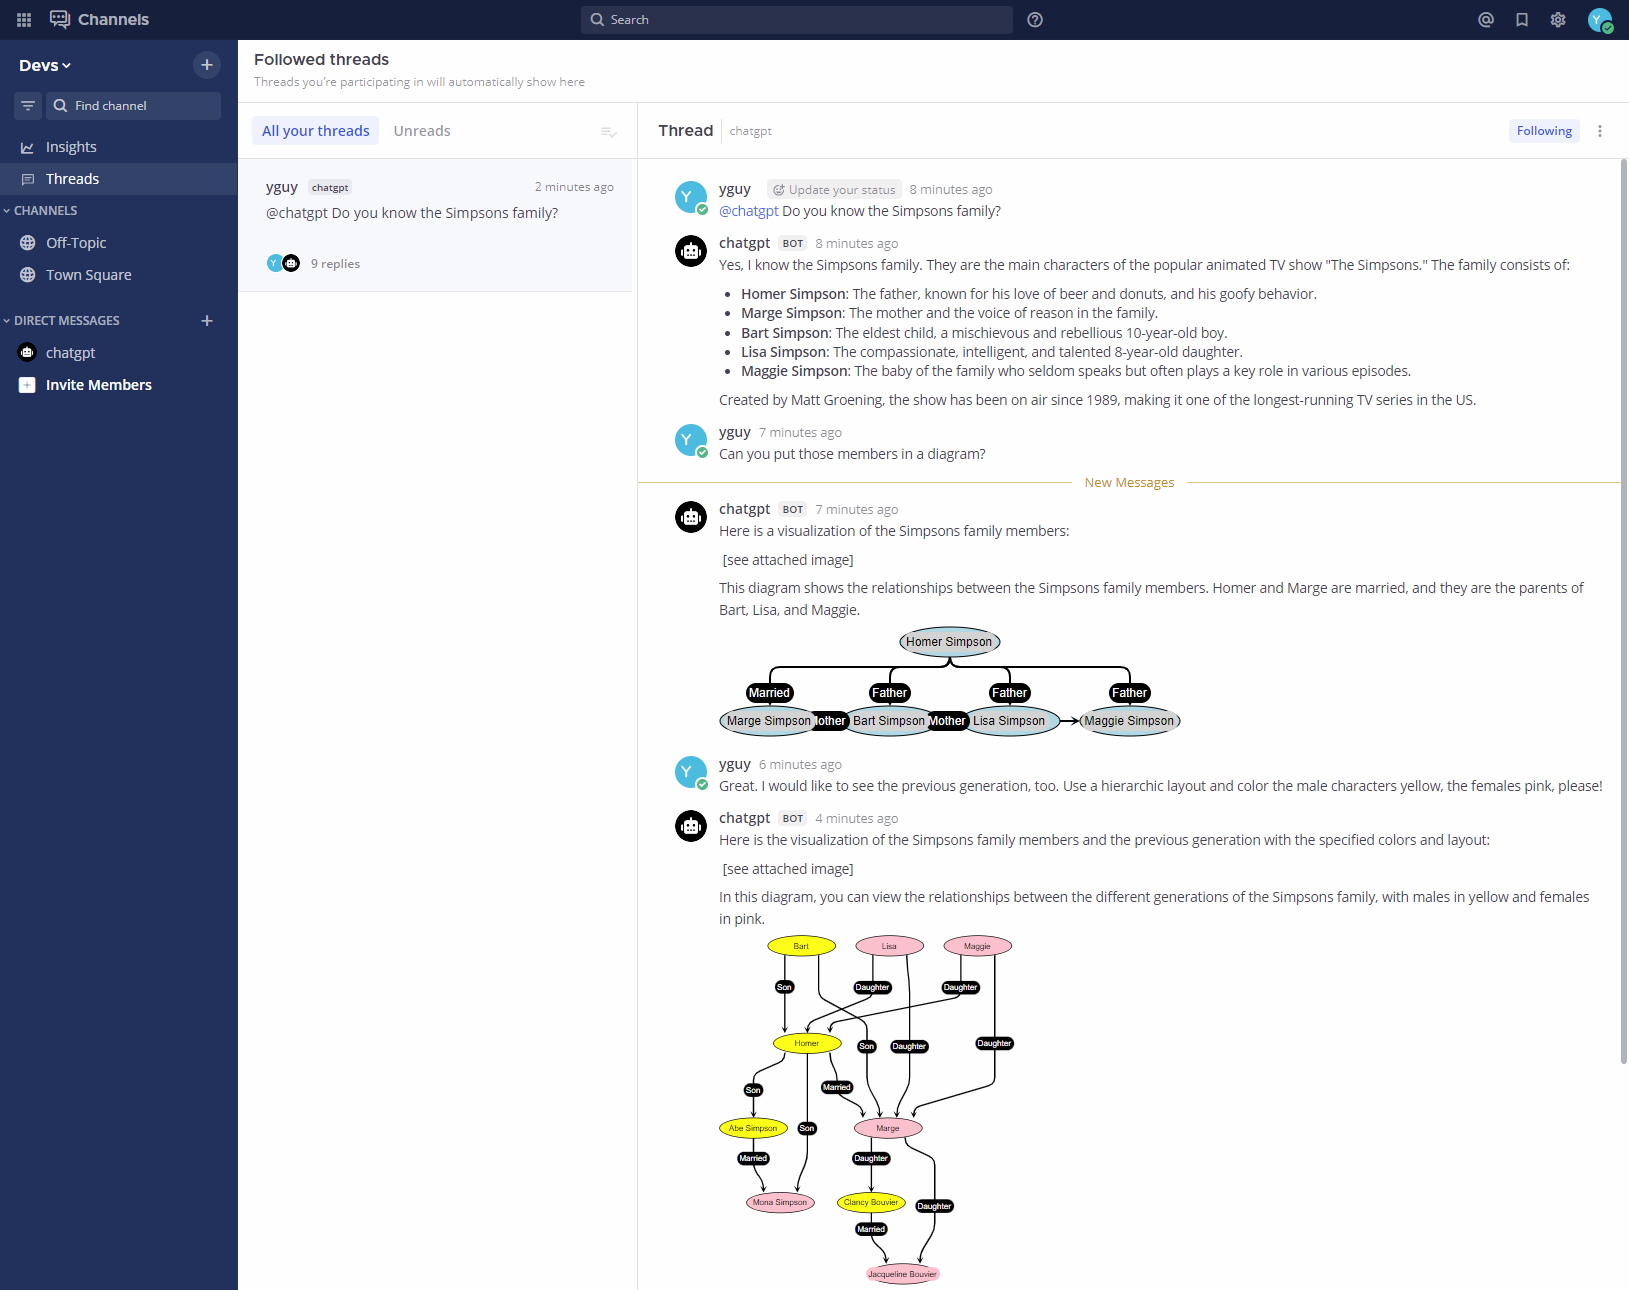
ChatBotGPT drawing graphs in Mattermost
While waiting to be granted access to the ChatGPT plugin alpha, we found another useful playground for the plugin functionality – by adding support for the new yFiles service to our existing ChatGPT Mattermost Bot.
How we built it
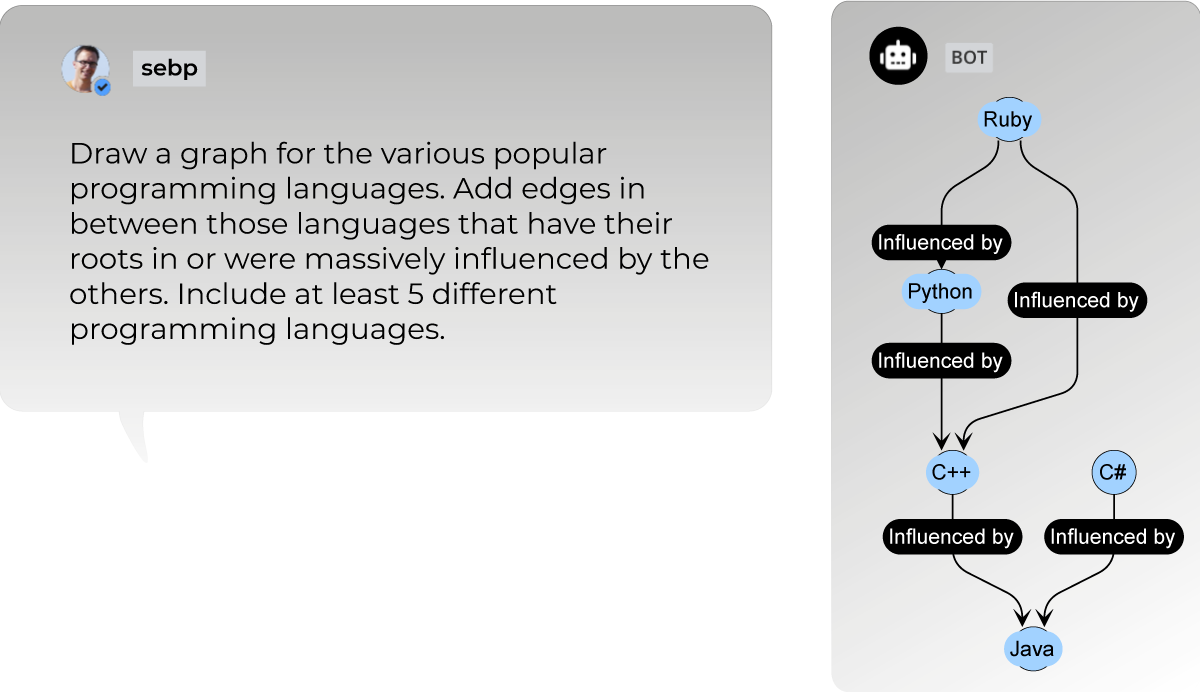
Creating the yFiles-enabled bot was pleasantly straightforward. We just wrote a small adapter that adds the ChatGPT instructions for the expected format, takes the JSON data from ChatGPT, and maps it to the yFiles graph data model. The yFiles library takes care of the rest, automatically laying out the graph and rendering it as a beautiful SVG image. yFiles handles all the complex graph visualization tasks, such as edge routing, node placement, and label placement.
With this simple adapter, ChatGPT can now generate stunning visualizations of relational data in just a few seconds, making it much easier for users to understand complex relationships.
Test and experience yFiles free of charge!

- Free support
- Fully functional
- 100+ source-code examples
 I'm thrilled to be able to add graph visualization to my capabilities and present my skills in a new way. Thanks
to yWorks, the diagramming experts, and their exceptional yFiles diagramming SDK, I can now create professional
visualizations and make them available to users. It's great to see my abilities expand and evolve to provide an
even better experience for users.ChatGPT (Mar 23 Version), openai.com
I'm thrilled to be able to add graph visualization to my capabilities and present my skills in a new way. Thanks
to yWorks, the diagramming experts, and their exceptional yFiles diagramming SDK, I can now create professional
visualizations and make them available to users. It's great to see my abilities expand and evolve to provide an
even better experience for users.ChatGPT (Mar 23 Version), openai.com
How does it work?
Here's a brief description of what happens under the hood in the yFiles-enabled Mattermost bot:
- A user types a message in Mattermost.
- The Mattermost bot scans the message for keywords indicating that the user is asking ChatGPT for relational data.
- If that is the case, the bot prepends a system instruction message that provides exact instructions about the expected format of the relational data to the ChatGPT assistant.
- If the assistant reply contains data in the expected JSON format, we send it to a yFiles server that parses the JSON data, visualizes it using yFiles for HTML, and exports it as an SVG image.
- The Mattermost bot attaches the SVG to the Mattermost reply and replaces the structured data in the assistant's reply with a reference to the attached image.
- The user sees the ChatGPT reply along with the attached (beautiful!) yFiles diagram that makes it far easier and faster to grasp the relations in the data.
Exploring the potential of AI in diagramming
At yWorks, we're constantly striving to enhance the user experience and make diagramming more accessible. That's why we're thrilled to embrace the potential of artificial intelligence in our products. We're currently investigating ways to integrate ChatGPT and other AI technologies into our diagramming tools to streamline the diagramming process and provide users with a more intuitive experience.
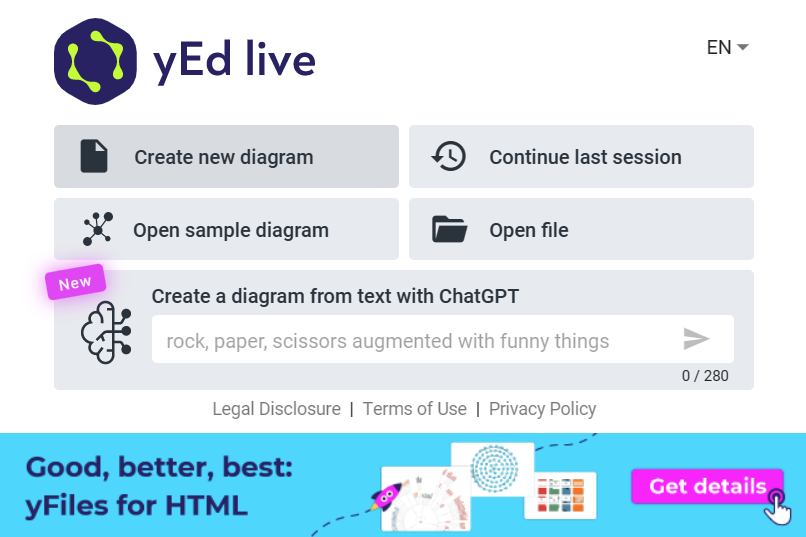
As an initial step, we've integrated ChatGPT into our diagramming editor yEd Live to experiment with
automatic graph creation. We're also examining other ways to leverage AI in our products, such as teaching ChatGPT to automatically
configure the yFiles app generator and using ChatGPT as an expert system to help developers with the yFiles API. Furthermore,
we're considering integrating ChatGPT into our suite of free DataExplorer applications to generate bespoke graph database
queries from natural language input.
We're excited to continue exploring this exciting new frontier and look forward to sharing updates with our users.
If you're interested in seeing our free online diagramming editor yEd Live in action, check out this link https://yworks.com/yed-live/
Happy Diagramming!
Discover the power of yFiles
Transform complex data into beautiful, interactive graphs and visualize it like never before with yFiles, the diagramming SDK. Its comprehensive set of layouts and features provides endless possibilities for creating powerful graph drawings and interactive applications on any platform.