The newest addition to yEd Live lets you explore your diagrams in virtual reality directly in the browser.
About the virtual reality viewer
The new feature lets you experience your graphs from a whole new perspective. Open any graph and have a 3-dimensional representation of its structure at hand. Start the 3D viewer from 'Main Menu' > 'View' > 'Show graph in virtual reality'.
Currently, it is a viewer application only and you can not yet edit the graph in virtual reality. We plan to add more features in the future and would appreciate your feedback.
Exploring the diagram in 3D
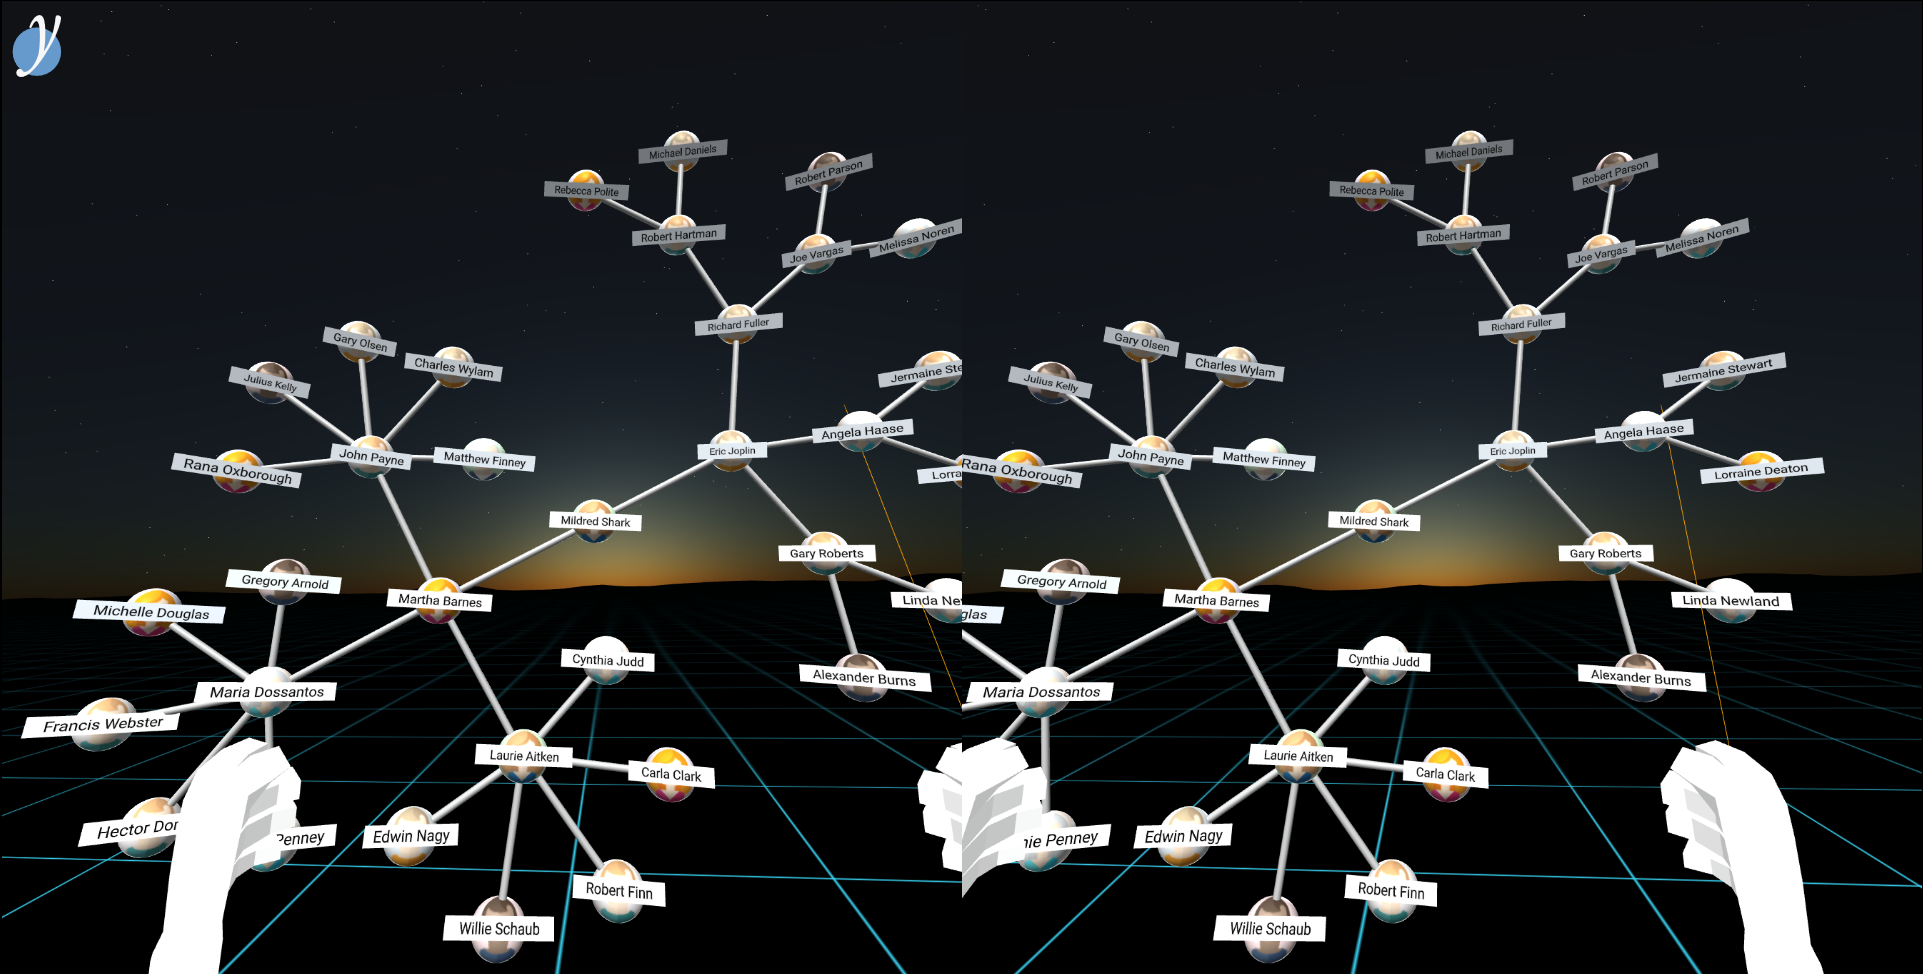
Your graph will open in a new 3D viewer tab. In the browser, you can look around by dragging the view with the left mouse button or move around with the arrow keys.
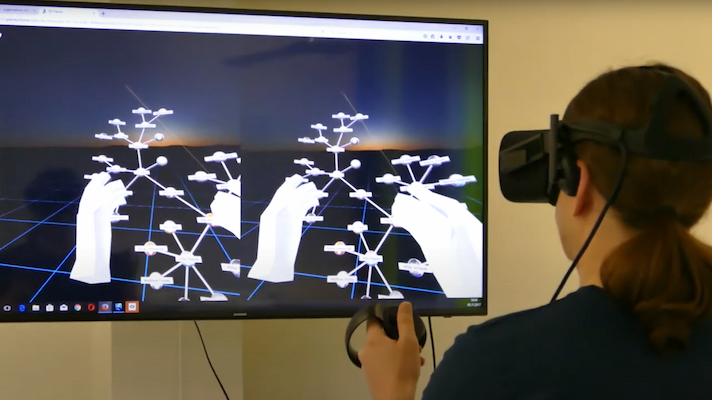
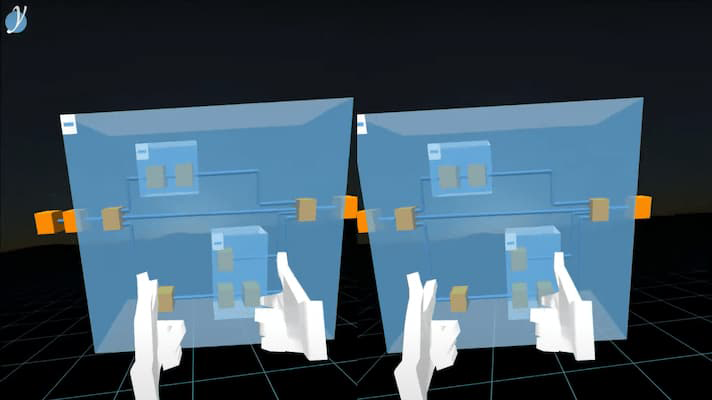
If you have a Oculus Rift or Vive or another VR headset, you can switch to the virtual reality view by clicking the glasses icon on the bottom right. In this view you can look around and use your controllers to interact with the graph. Grab the diagram with one hand to move or tilt it or you use both hands to expand or shrink the graph.
Behind the scenes
The VR viewer component is powered by yFiles for HTML, our graph visualization library for JavaScript, yEd Live, our free generic graph editor for the web, and A-Frame which is an open-source WebVR framework to build VR experiences for the browser. Initially, the diagram is converted to Entity-Components which are then rendered with WebGL by A-Frame. At the time of writing, you will need an up-to-date version of Firefox if you want to enjoy your graphs using your Oculus Rift or HTC Vive!
What features would you like to see us implement next? We are constantly improving yEd Live and its features and are eagerly awaiting your feedback!