Metro maps are a very important tool when it comes to illustrating routes of a public transport system. The history of metro maps or, more generally, transport maps, goes back to the famous 'Tube Map' created by Harry Beck in 1931 which shows the London Underground. Nowadays they exist for almost every larger urban area, making it easy for passengers to quickly gain an overview over the possible routes and reachable stations. Simply put, metro maps consist of stations or stops which are connected by lines. So we thought that they are a perfect match for the visualization using our yFiles diagramming library. Our goal was to automatically generate maps from data retrieved online and to polish the results using styles similar to the ones found in official maps. As the computation of a new metro map layout is quite CPU intensive, the goal was not to create maps in real time.
The automatic computation of metro maps is very CPU intensive.
Getting data
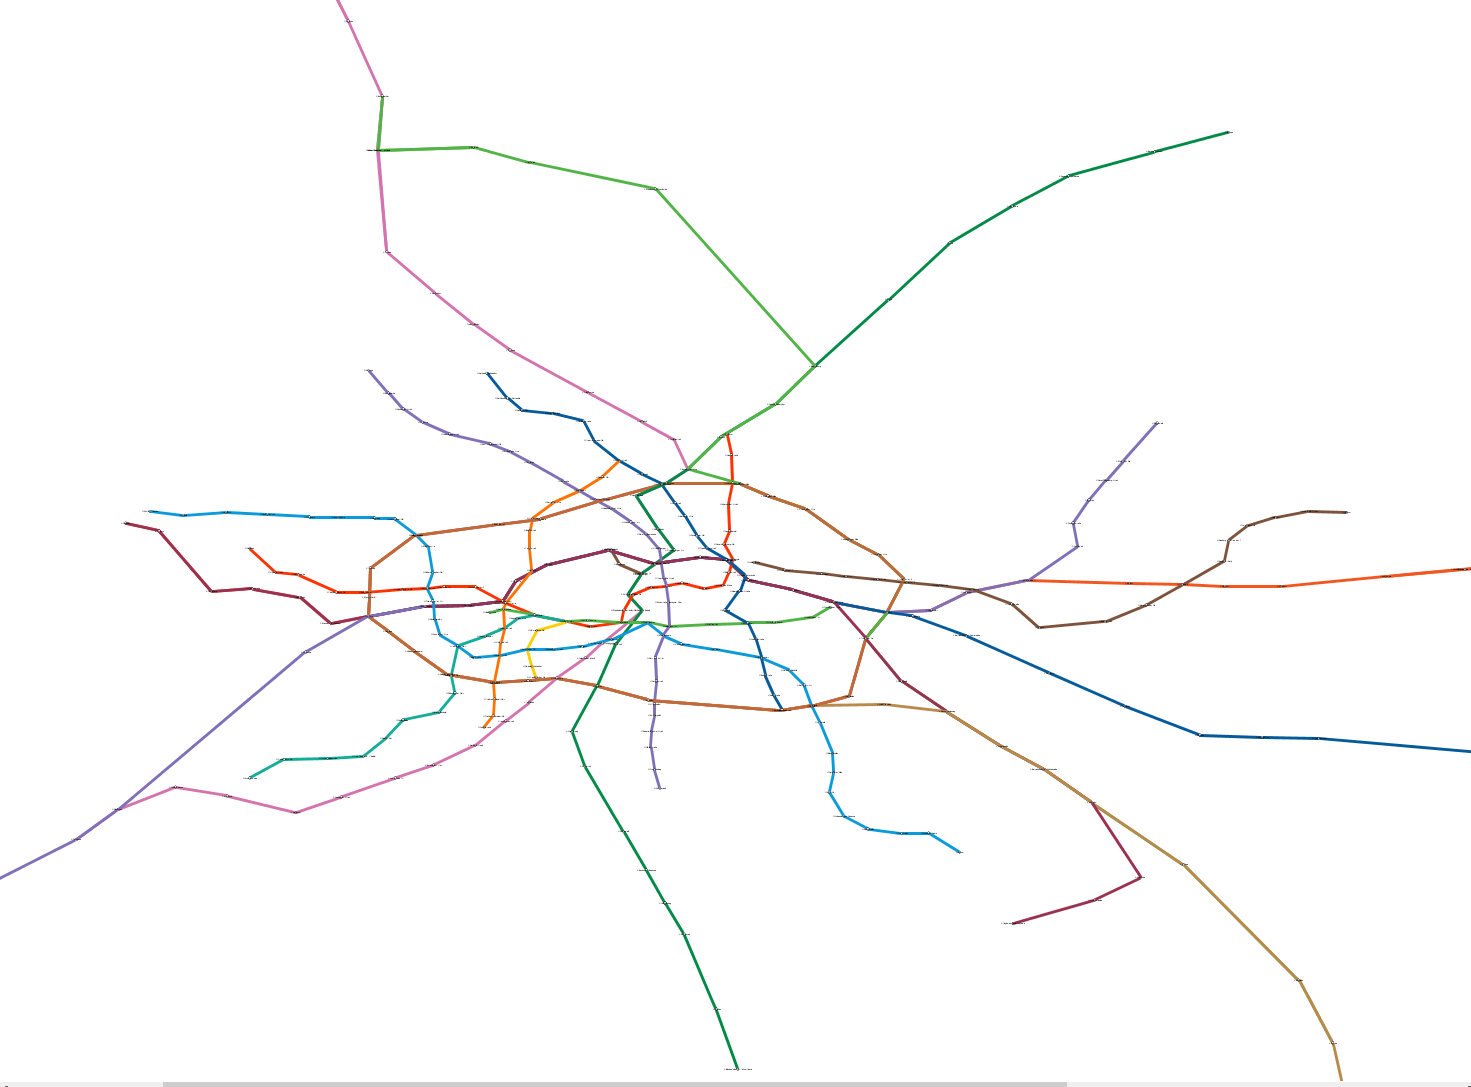
First, we needed to get the transport line data. We solved this by using OpenStreetMap and overpass-turbo which uses the Overpass-API to query data from OpenStreetMap. It allowed us to quickly and automatically query data for public transport systems of any desired area, parse it, and create a yFiles diagram from it. What we got is basically a diagram that shows the transport system in a geographically precise way:
Modeling and solving the problem
Our maps should satisfy a few general visualization rules, shared by most of the official maps, too. The lines should only be either horizontal, vertical, or diagonal at 45 degrees. Such a line layout is referred to as octilinear. Metro maps must preserve the main geographic character, like the relative location of stations, but they do not need not to be geographically precise. Generating metro maps following these rules is a rather well-researched topic. Our solution follows the approach from Martin Nöllenburg ('Automated Drawings of Metro Maps', 2005). Shortly put, the approach models the problem using a mixed-integer linear program (MIP). The solution of the problem yields the coordinates of the stations.
Metro maps preserve the main geographic character, but do not need to be geographically precise.
In our implementation we mainly created constraints as proposed by Nöllenburg and applied an MIP solver (via API) to get a solution to the problem.We tried both lpsolve and the CPLEX Optimizer. The latter provided us with good results a lot quicker than the former. The solution of the MIP program is then interpreted and transferred to the yFiles diagram created in the first step, yielding a metro map layout. To improve the runtime and results we applied some additional heuristics, too.
Visualizing the results
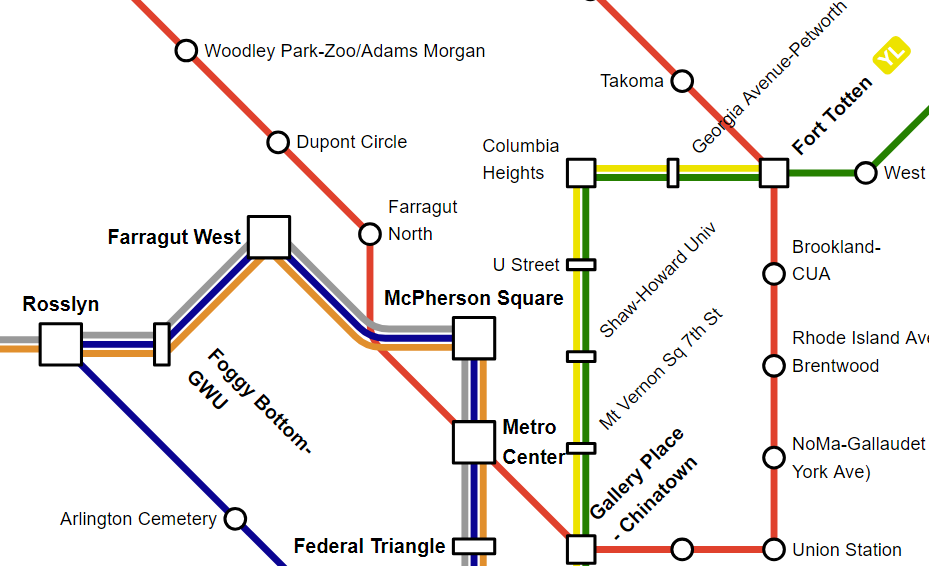
Now we already had a metro map drawing, but we also wanted to make it look great. Here, our powerful yFiles visualization API came into play and made it fun to style the metro map diagram. For the lines we use the colors from the OpenStreetMap data, if available. Station nodes are automatically drawn smaller or larger, depending on the number of adjacent metro lines.

The last challenge was the labeling of the metro stations (modeled as node labels). This is quite a difficult problem by itself, because in larger maps, there is often little space available for sometimes long label texts. With the help of the generic labeling algorithm (available out-of-the-box from the layout library) this challenge became manageable. To make results more similar to real-world maps, we tried to place labels as uniformly as possible and automatically used word-wrapping if there is little space available for a label.
Labeling of the metro stations was a challenge, but easy with yFiles.
Looking at our final results, we think that the maps can already keep up with some of the official metro maps! And clearly, the results of our automatic approach could be the base for a designer to further fine-tune the maps in some aspects. But have a look yourself: below you will find some of our results. Click the images to see the complete gallery of scrollable and zoomable high-quality vector graphics metro maps for more than a dozen cities!

What do you think? Is this something we should include as an algorithm in yFiles? Let us know! Just leave us a message in the social media or using our contact form.
The complete algorithm we implemented here is not currently part of the yFiles library. The labeling and visualization part is included in yFiles, but the linear programming part currently depends on third party software. If you are interested in using the algorithm for your own diagrams, please contact our support team for options.