The series of new releases in 2020 of the yFiles family of diagramming software libraries starts with the 2.3 release of yFiles for HTML. With this release, once more, yWorks shows that it's the leading provider of professional high-quality graph diagramming software libraries. The 2020 set of releases contain break-through features that have not been available to software developers before. They enable both existing yFiles customers and software developers new to the product to create stunning new diagram visualization applications that have not been possible before.
I'll show you some of the highlights of the 2020 releases in this post. If you are new to yFiles and interested in a more general introduction to the product and also want to learn more about the many other features that have been part of the library for the previous releases, I highly recommend visiting the yFiles overview page, first.
A new visualization technique will enable the creation of apps that weren't possible before.
As with every yFiles release, we make sure that there are improvements and new features across the product: Developers will be delighted that we were able to again improve their development productivity, but many of the new features, of course, will be visible to end-users, too. Most notably new graph analysis features and improved automatic diagram layout. One particular game-changing new visualization technique and other viewer and interactivity API improvements will enable new and existing yFiles customers to create applications that weren't possible before. The 2.3 release is a stable API release, almost completely backward compatible with older releases. New and hugely improved migration tools will help with updating to the new version, even for users switching from the old 1.x branch.
New Source Code Demos
As with every new release, we have added a set of interactive online demos that show the new functionality in action.
Interactivity and Visualization
The new releases include two major new features in the area of visualization and interaction:
Editing Diagrams in Isometric Views
For some kinds of technical diagrams, people have been using isometric views where the users see the diagram from an angle from above in a 3D-like perspective. yFiles had a demo of how to render these diagrams for a couple of releases, now. But users where not able to use the full editing convenience that yFiles usually provides, and which are especially important for editing isometric diagrams: Snapping and orthogonal editing, as well as orthogonal edge creation, are just a few examples which need to take into account the isometric projection to create properly looking isometric visualizations.
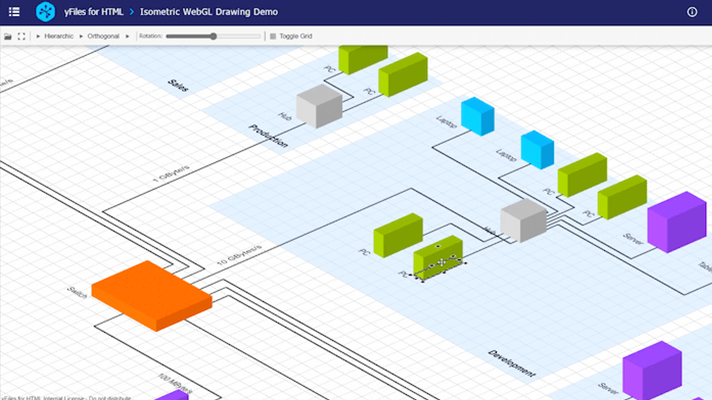
With the new release, developers can let their users not just view and explore, but also create and edit their diagrams in an isometric view and yFiles doesn't just support one isometric view, but any isometric projection transform can be employed and end-users may switch seamlessly between isometric and regular 2D view.
Bezier Edge Style Visualization and Editing
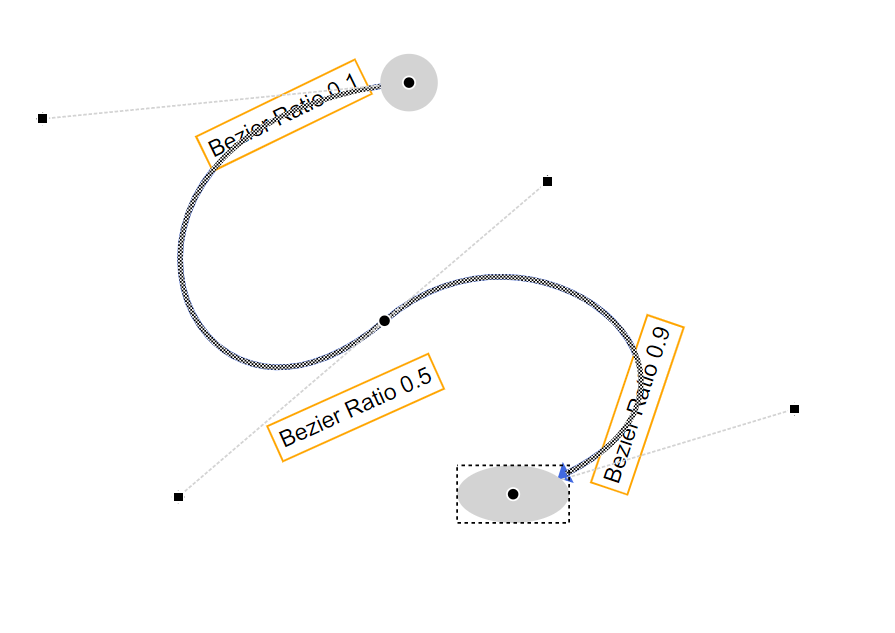
The 2020 releases contain a new Bezier Edge Style implementation that works perfectly with the new curved layout edge routing algorithms. It renders smooth spline curves efficiently and makes intuitive editing gestures possible. A new matching label model allows for dynamically placing and aligning labels on these curved edges.
Explicitly User-defined Z-Order Editing
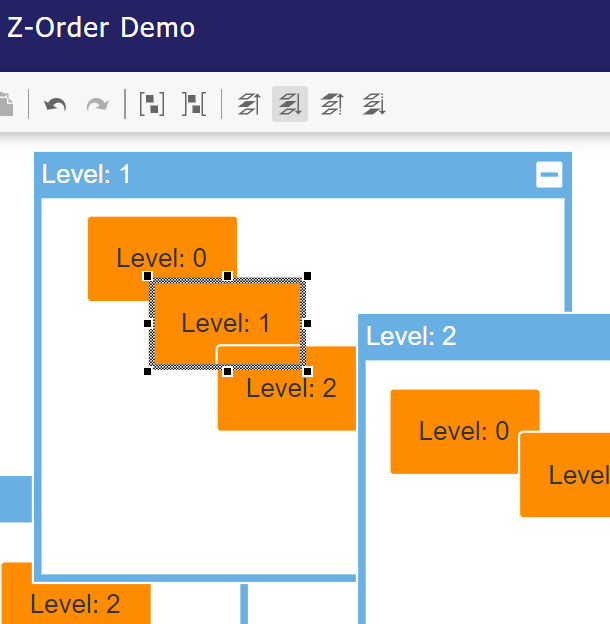
yFiles usually automatically handles the rendering order of elements, but sometimes end-users want to have manual control over the ordering. This release contains a demo that shows how to adjust and modify z-order in the context of a clipboard, serialization, and undoability.
Using Markup for Rendering Labels
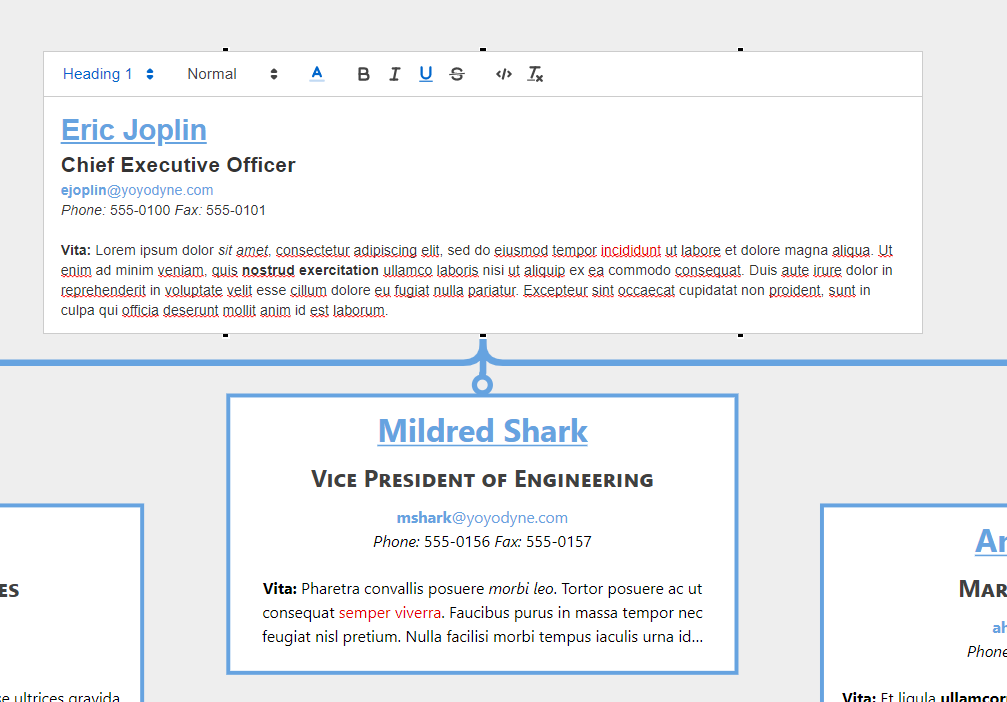
While developers have always been able to use the full power of the SVG, HTML5 Canvas, and WebGL engine to render labels, yFiles for HTML did not contain a convenient style for rendering and editing labels with a rich-text editor. The 2.3 release now comes with a style for rendering labels that support Markdown and HTML syntax.
Improvements for Graph Analysis
The existing suite of graph analysis algorithms now also contains efficient implementations for these additional graph clustering algorithms:
- Page Rank algorithm
- Louvain Modularity
- Label Propagation
- Eigenvector Centrality
- detecting cliques, chains, cycles, stars, and trees
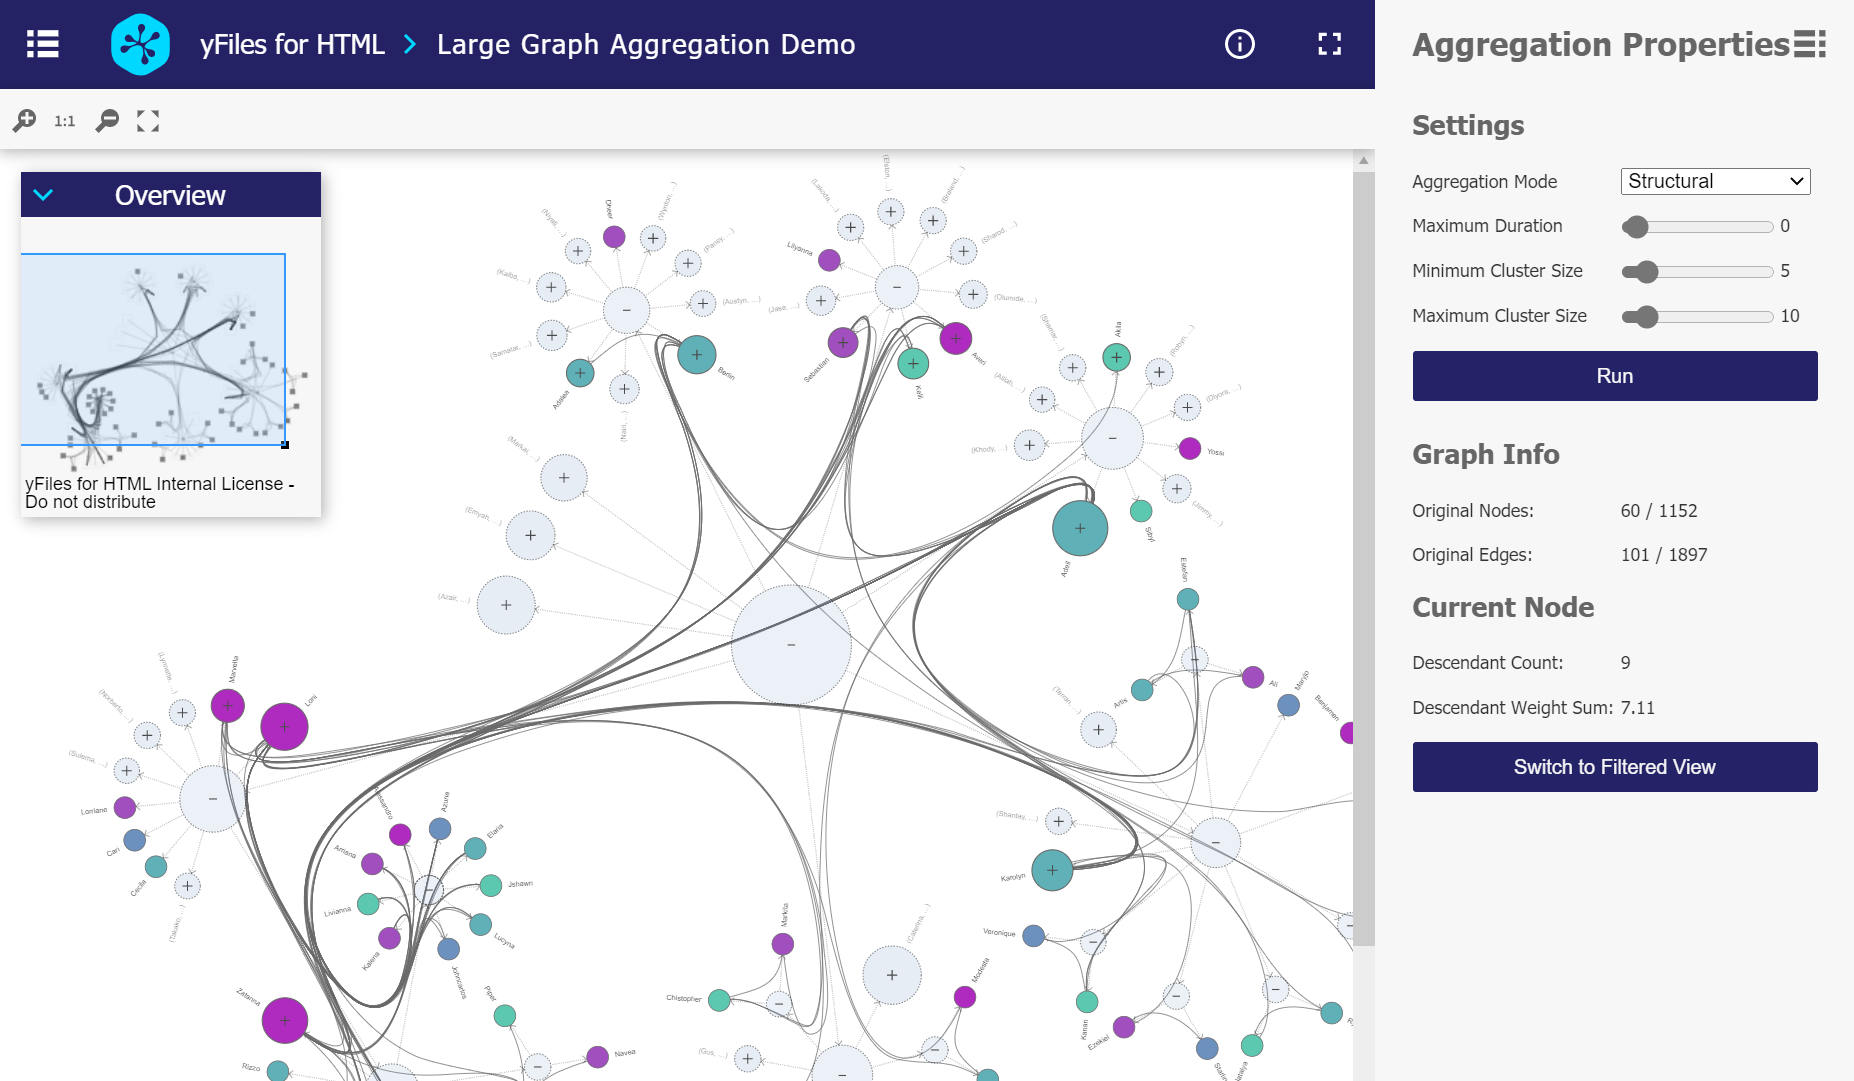
We believe that the biggest improvement to graph analysis algorithms, however, was the inclusion of an algorithm that makes all of these rather academic or special purpose algorithms usable for developers: The new node aggregation algorithm automatically analyzes the structure of the graph, testing various clustering and centrality algorithms to find the one that can best be used to hierarchically nest and aggregate the graph so that it can be intuitively explored by end-users who usually don't know the meaning of the raw values and implications of using the various graph analysis algorithms.
Finally, developers can easily unleash the power of graph algorithms for clustering their networks.
Finally, we can provide developers a tool to deal with even large datasets and create helpful visualizations for data for which there is no inherent structure in the data that allows for intuitively drilling into the data.
Support for Analyzing Subgraphs
yFiles comes with a wide range of efficient graph analysis implementations. Often, graphs contain items that should not be considered when calculating the results. E.g. in case you need to calculate centrality values for only a subset of the elements, ignoring nodes and edges of a certain type or with a certain attribute.
For this release we added support for easily restricting the calculation of analysis results to a subset of the graph. Developers may explicitly declare which elements to consider and which ones to exclude, using both sets and convenient predicate functions.
// Calculate centrality values
const centrality = new EigenvectorCentrality({
  subgraphNodes: {
    // only for the nodes that are currently visible on the screen
    includes: node => node.layout.toRect().intersects(graphComponent.viewport),
    // but not for group nodes
    excludes: node => graph.isGroupNode(node)
  }
})
const result = centrality.run(graph)
Improvements for Automatic Layout
There has never been a release of a new yFiles version that did not contain many improvements or even new algorithms in the area of automatic layout. The 2020 releases are no exception to this rule. To the existing graph layout and edge routing algorithms, we added the following new features, mostly around the topic of rendering smoothly curved bezier edge styles.
Bezier Routing for the Hierarchic Layout
In less technical diagrams, rendering edges without sharp bends helps to remove visual clutter from a diagram visualizations. There are fewer places in the diagram that will attract attention to the eye and intersections between edges can be seen more easily. To the orthogonal (90-degree bends), octilinear (45-degree bends), and polyline (bending points with varying angles), we have now added built-in support for routing edges with smooth bezier curves.
These types of edge visualizations lend themselves very well for example for the visualization of state-machines, but Sankey-diagrams, Mind-maps, and similar visualizations also benefit a lot from this style. Of course, as always the various routing styles may be mixed and match with each other in the same diagram if required.
Advanced Edge Routing for Circular Layout
The circular layout style is a style that highlights clusters and communities in networks. Closely connected groups of nodes are rendered in separate, interconnected circles.
Just because a cluster is tightly connected, though, doesn't mean that every node is connected to every other node in the same circle. Therefore seeing which node is connected with which other nodes in a cluster can still be very important. The new advanced edge routing options for the edges within a cluster in a the circular layout now make it a lot easier to understand the connectivity between the elements. And it sure looks nice, too!
Clear Area Layout and Fill Area Layout
We implemented an algorithm that clears a user-specified area by moving away intersecting elements while minimizing the changes in the given layout. This helps users to keep their mental map of the layout and works just as well with automatically generated layouts as with manually or semi-automatically arranged diagrams.
Applications for this type of layout utility are manifold:
- Expand collapsed groups of nodes in place without causing overlaps or destroying the mental map of the diagram
- Interactively make room for inserting new elements from a palette in a given diagram
- Let the user resize an element while avoiding the creation of new overlaps with existing elements
We also added the inverse variant of the clear-area-layout that will automatically compact a diagram when there is abundant space available, e.g. after elements have been removed or resized to smaller sizes.
Generic Bezier Edge Routing
The generic edge routing algorithm can be used in those situations where the locations of the nodes are fixed and where there is no layout algorithm that has an integrated edge routing along. Starting with this release, the integrated edge router now also supports the routing of bezier style edges and edges can be routed with curves as a post-processing step with other existing layout algorithms:
New Features for Developers
It would not be a typical yFiles for HTML release if we had not spent a lot of energy in yet again improving the productivity of the developers working with the library and the new features. Of course, we make sure that yFiles works well with all the major frameworks, browsers, and new APIs in the ever-changing web development world, but we are also improving the way our APIs work and how the features work together in customer applications. We want to make it a pleasure for the software developers to create awesome, use-case specific apps that make use of the existing and new features in yFiles.
New ways for loading your data into yFiles
The new API contains completely rebuilt classes for loading data from multiple sources into your diagrams. We added convenient APIs that allow for connecting to different data-sources in a declarative way to populate your diagrams. Binding visual styles, node sizes and locations, and any number of labels, has never been easier. Perfectly working TypeScript bindings will provide code completion down to the custom data-level.
Loading complex data from multiple sources into your diagrams has never been easier.
const graphBuilder = new GraphBuilder(graph)

// any number of sources can be used to create nodes
const nodesData = await getNodesData()
const nodesSource = graphBuilder.createNodesSource(
  nodesData, // nodes data
  nodeDataItem => nodeDataItem.nodeId // node id provider
)
nodesSource.nodeCreator.defaults.style = new ShapeNodeStyle({
  fill: 'lightYellow',
  shape: 'roundRectangle'
})
// change the style with a binding
nodesSource.nodeCreator.styleBindings.addBinding('stroke', employee =>
  employee.position.contains('Chief') ? 'darkRed' : 'darkOrange'
)

// ... and edges
const edgesData = await getEdgesData()
const edgesSource = graphBuilder.CreateEdgesSource(
  edgesData,
  edgeDataItem => edgeDataItem.sourceNodeId,
  edgeDataItem => edgeDataItem.targetNodeId
)
Developer and Production Builds
Our customers quickly adopted the convenient npm-packaging of yFiles for HTML, which made integrating the
library into modern build tool-chains like Angular CLI, Vue CLI, ReactJS and more
as easy as calling npm install.
The new release builds upon that functionality but this time adds the convenient runtime-type checking and
debugging facility right into the package without having the user to manage an extra script import.
The npm package automatically detects whether it is run in a production or development build and dynamically
includes the debugging and runtime type checking mechanisms in the bundle.
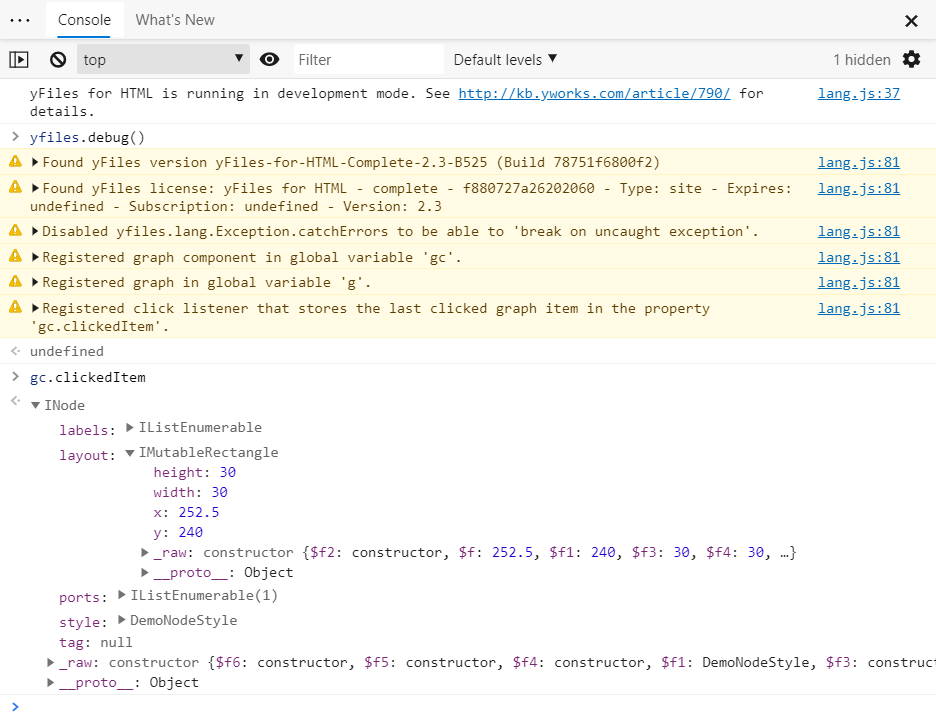
Formatting Objects in the Console and Debugger
Debugging and inspecting objects at runtime is a task that many developers need to frequently do. yFiles works with complex objects which provide various utility methods and many properties that sometimes make it hard to find the important properties in a debugger. Properties are usually simply sorted by name rather than importance and private state is also visible in the debugger and console view.
The new built-in developer mode now solves this problem by hooking into a mechanism that is part of modern browsers to help developers quickly see important information about the objects they are looking at.
Collection-like objects automatically unfold and the most important properties are listed first for easy inspection. This dramatically improves debugging performance when IDEs and code-completion cannot help.
More TypeScript Demo Sources
yFiles for HTML comes with more than 250 source code demos examples that developers can use to learn about the API and features. Most of them are explicitly implemented to make it easy to copy the functionality into custom applications.
While most of these sources are agnostic to the framework that will be used by our customers, the majority of the sources are provided as modern EcmaScript 2015+ sources. Many of our customers in larger corporations, however, use TypeScript and although JavaScript easily and seamlessly integrates with TypeScript and modern tool-chains, modifying our demo sources forces them to switch the programming languages.
Many of the demos are provided both as TypeScript and JavaScript versions.
With the 2.3 release of yFiles for HTML we are now providing many of the demos both as TypeScript and JavaScript versions and we will convert more of the existing demos to TypeScript in the following minor releases.
Find a complete list these and many more new features in the yFiles for HTML release notes.
If you want to see some of the features explained in more detail and in action, feel free to check the recording of our webinar What's new in 2020? on YouTube:

If you haven't played with yFiles for HTML, before or want to try out the new version, we invite you to try yFiles for HTML, today! Happy diagramming!