There are two major use-cases for the visualization of data in graph databases like Neo4j:
Visualization can help database administrators and developers understand their Neo4j database schema as well as browse the contents and verify their queries using tools like Cypher and the Neo4j Desktop.
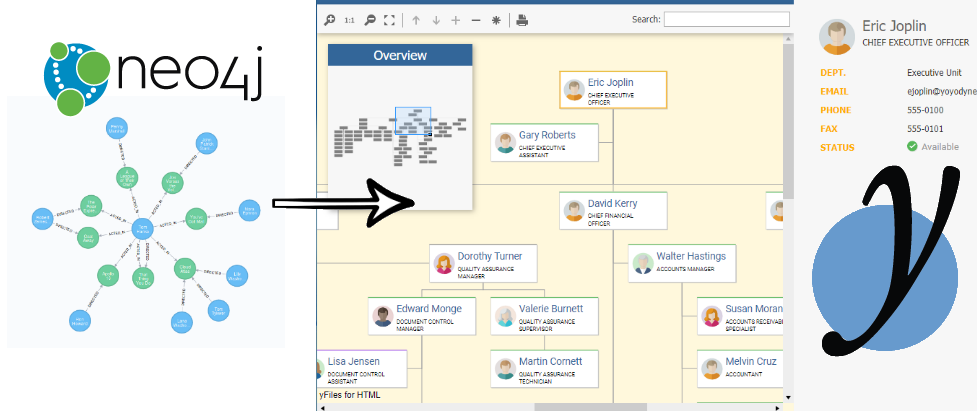
But not only developers and backend devs can benefit from visualization: Many end-user applications that let the users work with data that is stored in graph databases also benefit a lot from a more visual interface to their data:
End-user applications that let the users work with data benefit a lot from visual interfaces
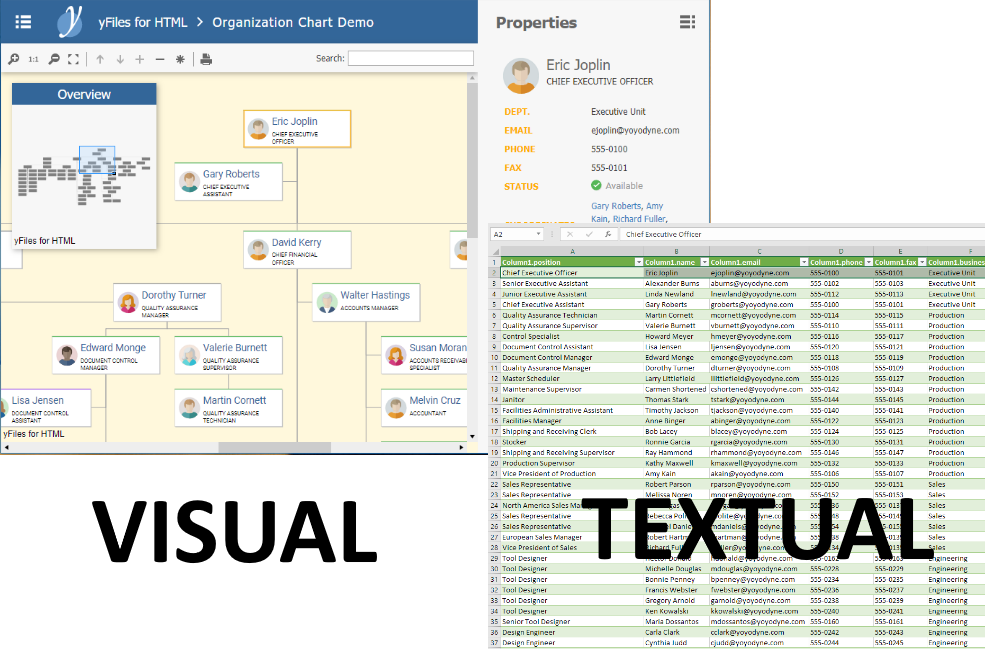
Creating a user-friendly, well-performing, and informative visualization for end-users is all but trivial and the simple visualizations that developers use for their tools often simply don't cut it.
In this post I am going to present a tool that can help you with that task. With it, you can create high-quality graph and diagram visualizations for end-user applications, that perfectly convey the information contained in your database to the end user.
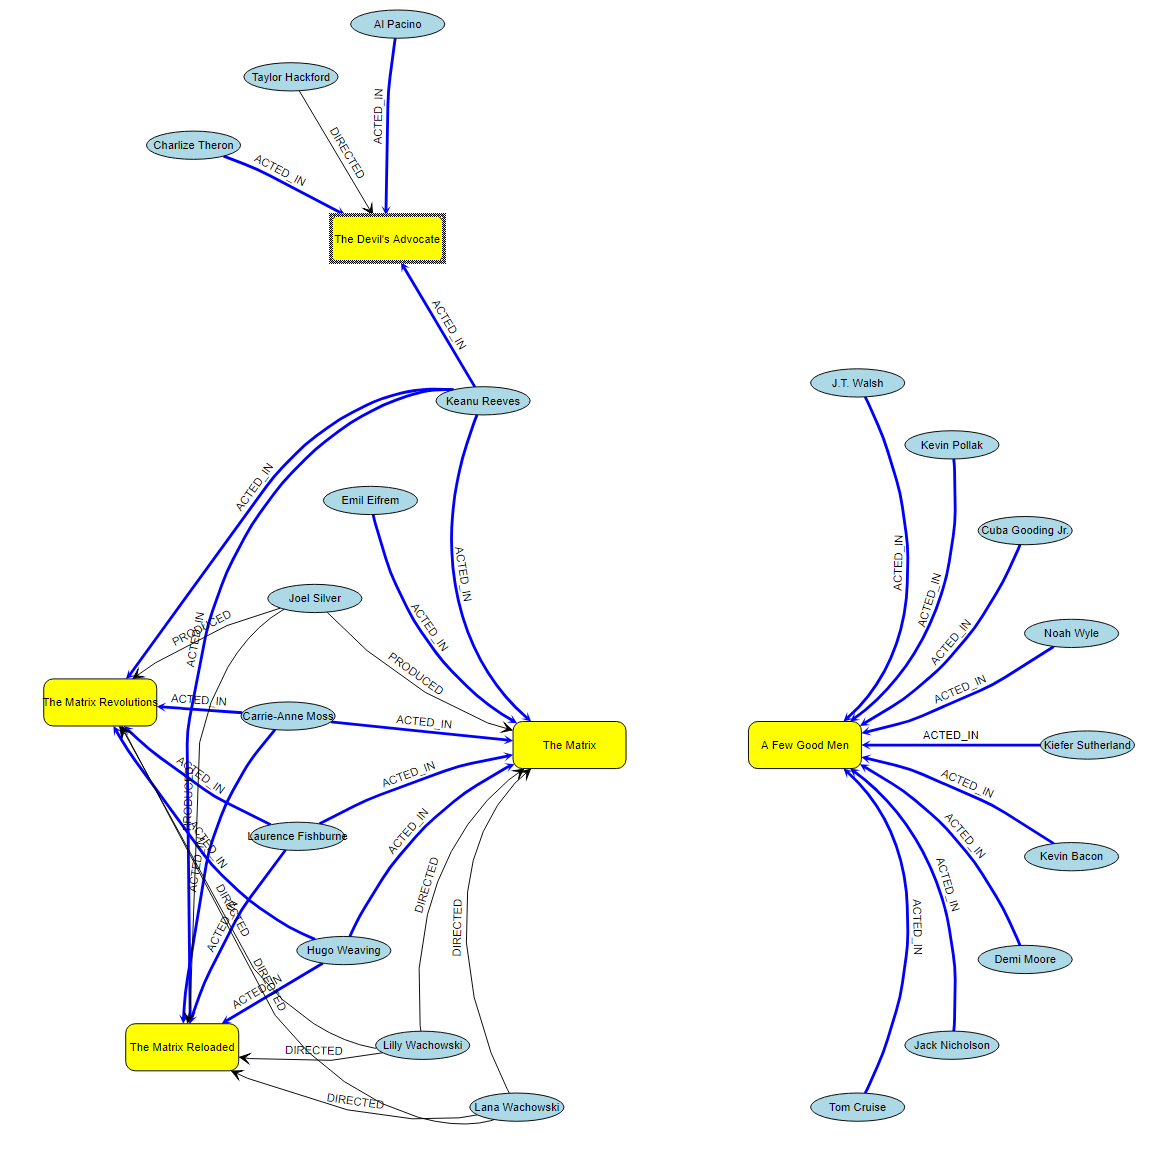
With only slightly more than 60 lines of code we will create an interactive web application that renders a unique diagram of your data. This is what it will look like when used with the movie sample database:
Professional Diagramming: yFiles for HTML
The tool I am using for this is yFiles for HTML - a generic graph visualization programming library for the web platform that can help you realize those last ten or twenty percent of your requirements that you won't be able to implement with other tools: yFiles is a whole family of graph visualization programming libraries that have been available commercially for various target platforms for more than 15 years now and which are used by companies and corporations around the world coming from a wide range of diverse industries.
The variant for the web platform is not exclusively meant to be used as a visualization front-end for Neo4j, however in this post I will show you how well yFiles for HTML and Neo4j play together.
yFiles for HTML can help you realize those last 20% of your requirements that you won't be able to implement with other tools
The single-page web app that we are about to build uses yFiles for HTML and the Neo4j JavaScript Bolt driver to query your very own Neo4j database. The query results will be displayed in a graph visualization with a unique automatic layout, customized item visualizations and user interactions.
To follow the instructions in this post, you can download a free evaluation version of the yFiles for HTML software package and you should have a Neo4j database running that you can use for testing.
In this post we are only going to briefly touch the surface of the yFiles API and vast array of possibilities and features that yFiles offers, so if you are interested in learning more, be sure to look at the various demos and online resources, too, or see this YouTube Playlist on that topic.
Also, as an existing Neo4j user, be sure to check out the free online Neo4j Explorer web application that will help you visualize your database without all the coding!
Let's start coding!
We begin by scaffolding a bare minimum WebPack powered ES6-sources-based yFiles for HTML application
that does not depend on any third-party software at runtime.
We could also be using UI frameworks like Angular, React, VueJS, or anything similar,
but for the sake of simplicity we are going to use plain vanilla HTML, here.
After unzipping the yFiles for HTML library to some directory in our computer we can use npm or yarn
and yeoman to scaffold the application. More detailed instructions are available in a separate screencast. On the console we do:
> npm install -g generator-yfiles-app
> yo yfiles-app
And yeoman will ask you some questions. Here are the answers I chose for this task:
? Application name Neo_post
? Path of yFiles for HTML package C:\Path\to\your\yFilesForHTMLPackage
? Path of license file (e.g. 'path/to/license.js') C:\Path\to\your\yFilesForHTMLPackage\demos\resources\license.js
? Which kind of yFiles modules do you want to use? ES6 Modules
? Which modules do you want to use? yfiles/algorithms, yfiles/layout-hierarchic, yfiles/view-component, yfiles/view-editor, yfiles/view-layout-bridge
? Which language variant do you want to use? ES6
? Which webpack version would you like to use? 4.x
? What else do you want? WebStorm/PHP-Storm/Intellij IDEA Ultimate Project files
? Which package manager would you like to use? yarn
Then yeoman will do its magic and after a few seconds it will have scaffolded a shiny new web application that uses yFiles for HTML and Webpack 4 with ES6/EcmaScript2015 to load, layout, and render a trivial graph that you can edit interactively with the mouse, keyboard, and on touch devices.

And this is what the app will look like when we use `npm start` or `yarn start` to compile, serve, and run the code in our browser:
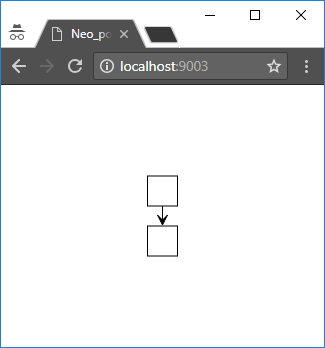
You will agree with me that this is not really an outstanding visualization, yet, and what we really want to do is inspect our Neo4j database contents!
Introducing Cypher and Bolt
To connect Neo4j with yFiles for HTML, we first add the JavaScript Bolt driver to our application.
On the console we do:
> yarn add neo4j-driver
Then in the code we simply load the Neo4j driver by adding the following import statement at the top of the file:
import neo4j from 'neo4j-driver/lib/browser/neo4j-web'
Make sure you have the credentials and IP address available for the Neo4j database that you would like to explore, because with the next line of code, we can already connect to the database:
const neo4jDriver = neo4j.driver("bolt://1.2.3.4", neo4j.auth.basic("theusername", "theS3cr3t"))
(Of course, you will need to adjust the IP address, the user name and the password.)
We are now going to simplify the scaffolded code first that yeoman created for us. Strip it down so that it looks like this:
const neo4jDriver = neo4j.driver("bolt://1.2.3.4", neo4j.auth.basic("theusername", "theS3cr3t"))
const graphComponent = new GraphComponent('#graphComponent');

loadGraph();

async function loadGraph() {
  let nodeResult = await runCypherQuery("MATCH (node) RETURN node LIMIT 25");
}

async function runCypherQuery(query, params) {
  const session = neo4jDriver.session('READ');
  try {
    return await session.run(query, params);
  } finally {
    session.close();
  }
}
This will result in a boring empty graph view, because we only queried the database for the nodes, but we are not doing anything with the results, yet. At this point it is important to understand that the core yFiles for HTML library does not know how to interpret the results of a query returned by the Neo4j Bolt connector. However, there are utility convenience classes that will help us with the import of any kind of structured data that we have access to in our JavaScript environment. The data could be fetched from a file, from the network, via REST, WebSockets, or created dynamically on the client and of course, the Neo4j data works with this, too: All we need to have is some understanding of the way the Neo4j response data is structured.
For the simple query above the resulting JavaScript object looks like this:
{
  "records": [{
    "keys": ["node"],
    "length": 1,
    "_fields": [{
        "identity": {
          "low": 0,
          "high": 0
        },
        "labels": ["Movie"],
        "properties": {
          "title": "The Matrix",
          "tagline": "Welcome to the Real World",
          "released": {
            "low": 1999,
            "high": 0
          }
        }
      }
    ],
    "_fieldLookup": {
      "node": 0
    }
}
We can use the following Bolt JavaScript API to obtain an array of all the nodes queried:
const nodes = nodeResult.records.map(record => record.get("node"))
Now that we have the nodes, we can use the convenience class GraphBuilder from yFiles to get the graph onto the screen:
graphBuilder.nodesSource = nodes
graphBuilder.buildGraph()
That was easy! But the result still leaves a lot to be desired from a visual and interactive perspective:
Let's improve that: we assign a nicer style for the node visualization and a simple label mapping: If the node has a property named "title" or "name" we use this for the label.
And instead of leaving all nodes at the default location, we apply an automatic layout algorithm to arrange the nodes nicely on the screen.
import {GraphBuilder, GraphComponent, ShapeNodeStyle} from 'yfiles/view-component'
import 'yfiles/view-layout-bridge'
import {RadialLayout} from 'yfiles/layout-radial'
graphBuilder.graph.nodeDefaults.style = new ShapeNodeStyle({shape:"ellipse", fill:"lightblue"})
graphBuilder.nodeLabelBinding = node => node.properties && (node.properties["title"] || node.properties["name"])

graphBuilder.buildGraph()

await graphComponent.morphLayout(new RadialLayout())
The graph looks nicer, now, but we still don't see any relations.
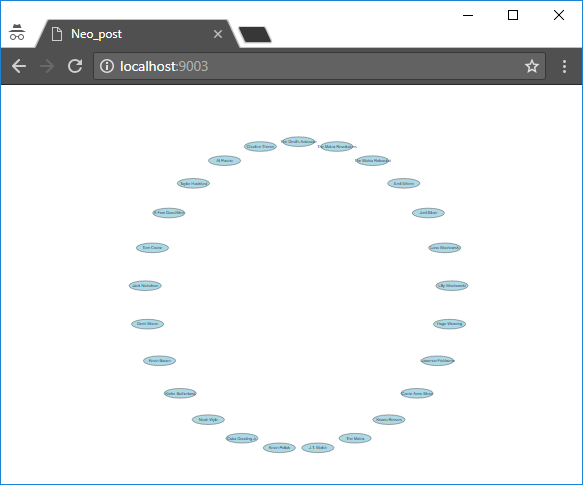
Let's change that with another query to the database!
We query all the edges between the nodes that we have queried before using this code:const nodeIds = nodes.map(node => node.identity)
const edgeResult = await runCypherQuery(
`MATCH (n)-[edge]-(m)
WHERE id(n) IN $nodeIds
AND id(m) IN $nodeIds
RETURN DISTINCT edge LIMIT 100`, {nodeIds})
This is what a result looks like in JSON form:
{
"identity": {
"low": 7,
"high": 0
},
"start": {
"low": 8,
"high": 0
},
"end": {
"low": 0,
"high": 0
},
"type": "ACTED_IN",
"properties": {
"roles": ["Emil"]
}
}
As you can see, the relationships reference their source and target nodes via the
identity
property that was attached to the nodes.
We can use the toString function provided by Bolt,
to obtain a representation of the identities that can be consumed easily by GraphBuilder.
We tell the helper class to use this information to resolve the connections end points and build the in-memory graph for the display:
const edges = edgeResult.records.map(record => record.get("edge"))
graphBuilder.edgesSource = edges
graphBuilder.sourceNodeBinding = edge => edge.start.toString()
graphBuilder.targetNodeBinding = edge => edge.end.toString()
graphBuilder.nodeIdBinding = node => node.identity.toString()
Putting it all together this is what we have now in our loading function:
async function loadGraph() {
let nodeResult = await runCypherQuery("MATCH (node) RETURN node LIMIT 25")
const nodes = nodeResult.records.map(record => record.get("node"))
const nodeIds = nodes.map(node => node.identity)
const edgeResult = await runCypherQuery(
    `MATCH (n)-[edge]-(m)
            WHERE id(n) IN $nodeIds
            AND id(m) IN $nodeIds
RETURN DISTINCT edge LIMIT 100`, {nodeIds});
const edges = edgeResult.records.map(record => record.get("edge"))
const graphBuilder = new GraphBuilder(graphComponent.graph);
graphBuilder.graph.nodeDefaults.style = new ShapeNodeStyle({shape:"ellipse", fill:"lightblue"})
graphBuilder.nodesSource = nodes
graphBuilder.nodeIdBinding = node => node.identity.toString()
graphBuilder.nodeLabelBinding = node => node.properties && (node.properties["title"] || node.properties["name"])
graphBuilder.edgesSource = edges
graphBuilder.sourceNodeBinding = edge => edge.start.toString()
graphBuilder.targetNodeBinding = edge => edge.end.toString()
graphBuilder.edgeLabelBinding = edge => edge.type
graphBuilder.buildGraph()
await graphComponent.morphLayout(new RadialLayout())
}
And this is what the visualization looks like in the browser:
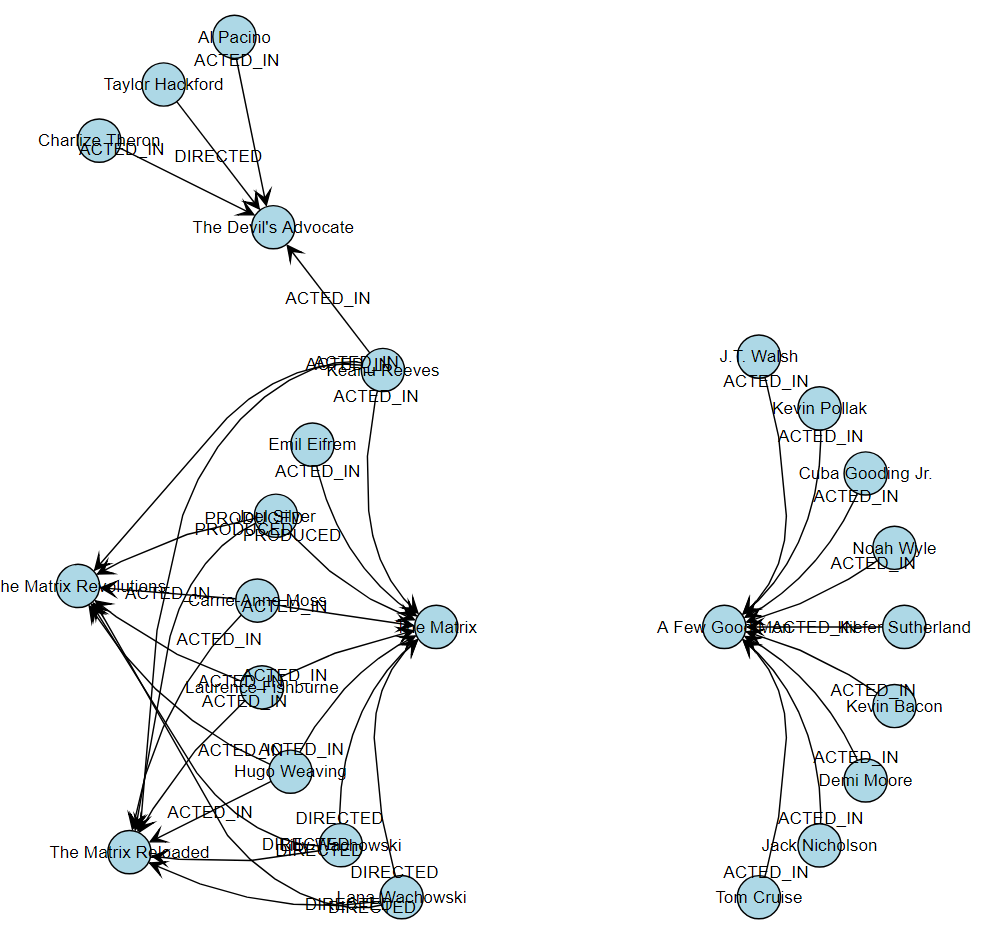
We still need to work a little on the interactivity, the layout, and the visualization. Right now, we are hardly any better than most other tools.
Let's say we want to show some details in a tool-tip, let the user select elements and react to clicks in the graph.
For this we add the so-called GraphViewerInputMode to our component:
const inputMode = new GraphViewerInputMode()
graphComponent.inputMode = inputMode
This enables the user to select elements, pan around conveniently, and use the keyboard to navigate the graph.
We can now also easily specify rich tool-tips for our elements: For this we use the information that the database provided us with and we list all the properties in a very simple HTML list:inputMode.addQueryItemToolTipListener((sender, args) => {
if (args.item && args.item.tag && args.item.tag.properties){
args.toolTip =
`<ul>
${Object.entries(args.item.tag.properties).map( e => '<li>' + e[0] + ' : ' + e[1] + '</li>').join('')}
</ul>`
}
})
And in order to better understand the structure of the graph, we add the option for the user to center the layout around a given item that she double-clicks:
inputMode.addItemDoubleClickedListener(async (sender, args) => {
  if (INode.isInstance(args.item)){
    args.handled = true;
    const radialLayoutData = new RadialLayoutData()
    radialLayoutData.centerNodes.items.add(args.item)
    const radialLayout = new RadialLayout()
    radialLayout.centerNodesPolicy = "custom"
    await graphComponent.morphLayout(radialLayout, "0.5s", radialLayoutData)
  }
})
That's it. Check out the final code, again:
I guess you can see that with only very little customizations you are now able to adjust the Cypher queries to your specific databases and create rich, interactive, visualizations of your data!
That's it already for this very short introduction on how to use yFiles for HTML to visualize your Neo4j databases. You will find a commented version of the sources for this demo on GitHub.
What next?
Of course, there is a lot more functionality that has not yet been covered in this post. Take a look at the many online demos for yFiles for HTML to get an idea what else you could do with the yFiles libraries and Neo4j!
I leave it as an exercise for you to improve the visualization to look like this :wink::
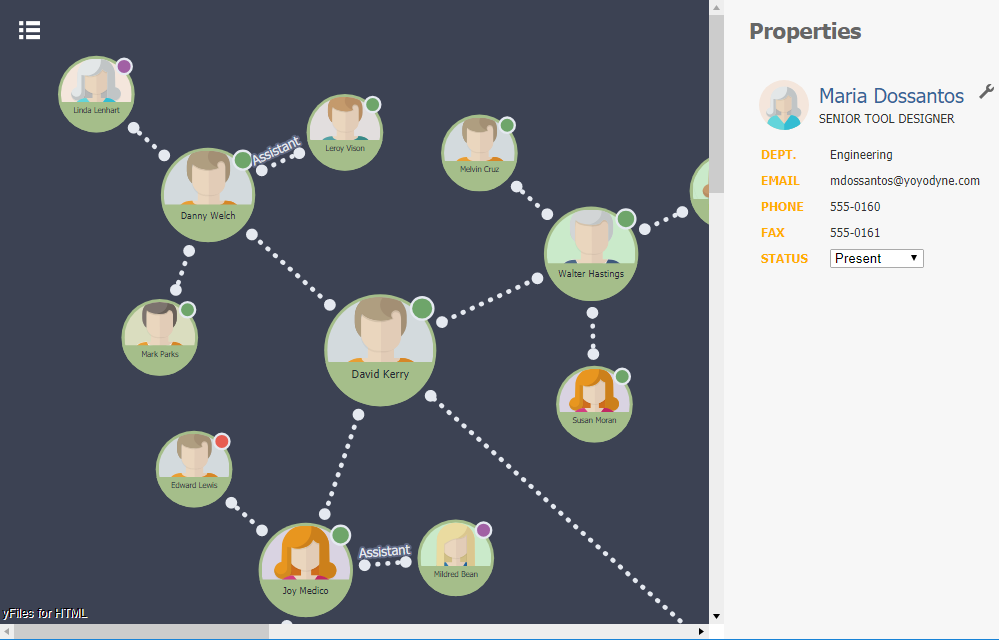
And to give you more ideas about the possibilities, with some coding, yFiles for HTML, and Neo4j you can:
- use WebGL, Canvas, and SVG together with templating and databinding to create richer visualizations with animations and just the right information your users require
- connect to third-party data-sources and services to enhance your visualization with live data and let the user trigger actions in remote systems when interacting with the visualization
- embed the graph visualization as a white-label component into your very own apps, possibly using Angular, ReactJS, VueJS, or whatever framework you prefer
- interactively explore the database and incrementally add new elements to the visualization using incremental automatic layouts
- use different, more compelling layout styles and provide more sophisticated layout constraints to highlight certain structures, components, or elements in your dataset in the visualization
- use nesting, filtering, and drill-down techniques to let your users interactively explore your data
- enable users to edit your graphs using the mouse, keyboard, pen, and touch devices
So, what are you waiting for? Go and visualize your Neo4j database like a pro!
Happy diagramming!
This post was originally posted on Medium in cooperation with our friends at Neo4j.
There is a screen-cast available on YouTube that goes through the steps in this post.