Life is what happens when you’re busy making plans — this holds especially true for the past year! In retrospect, we found lots of bright moments among the challenges. Let’s revisit the highlights together. Surprises await…
New options, bigger graphs, even more intuitive use
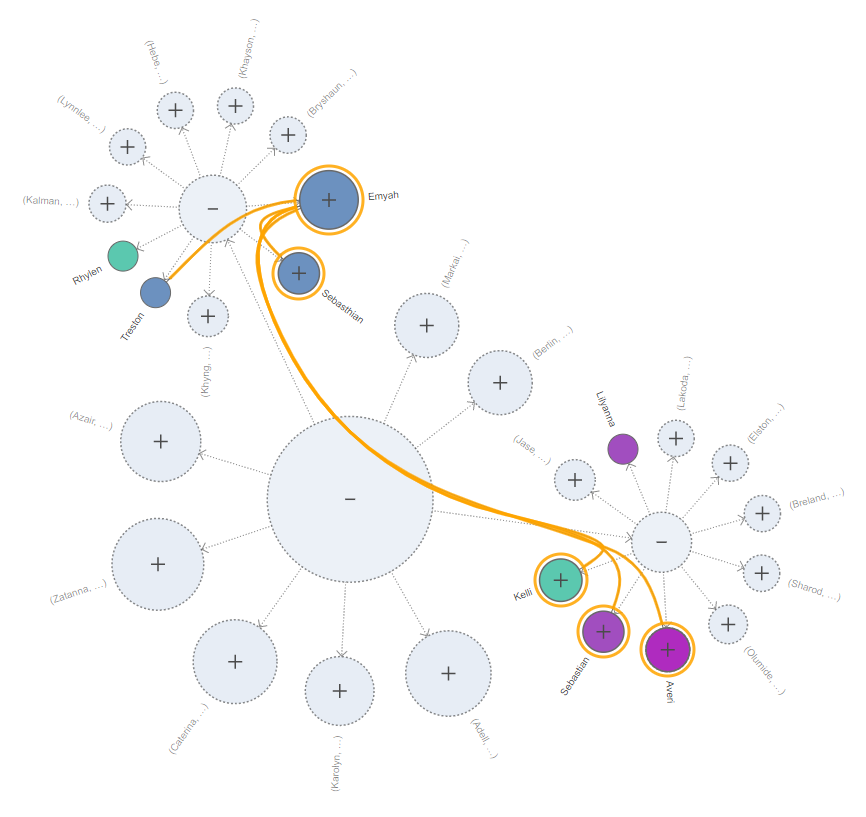
Our flagship product, the yFiles diagramming SDK, grew by leaps and bounds last year. Many new graph analysis algorithms were incorporated: from detecting clusters, to aggregating sub-graphs, to calculating centrality values. The Large Graph Aggregation Demo shows how to use the various clustering algorithms to automatically analyze and explore even very large graphs. Keeping things classy, the new built-in BezierEdgeStyle uses smooth Bézier curve paths to render edges. For intuitive interactive editing, this style features the familiar control points (handles) also used in other vector graphic applications. Last but not least, check out the Isometric Drawing Demo on how to display data isometrically and adjust the projection to rotate the graph in 3D. This feature alone will change the way users see the data in their diagrams. As with every major release, many other details were optimized, too.
Would you believe it?
In the latest yFiles release, there are more than 522 easy ways to configure the over 15 different layout algorithms. That’s at least 1,160,310,760 possibilities for displaying your graphs!
Good news about our diagram editors yEd Live and Graphity: We decided to keep yEd Live free of charge, and Graphity became available for Confluence Cloud — just in time for Atlassian’s announcement that they will discontinue server licensing.
Did you know?
Graphity provides more than 70 node icon palettes with a total of over 2,000 individual icons.
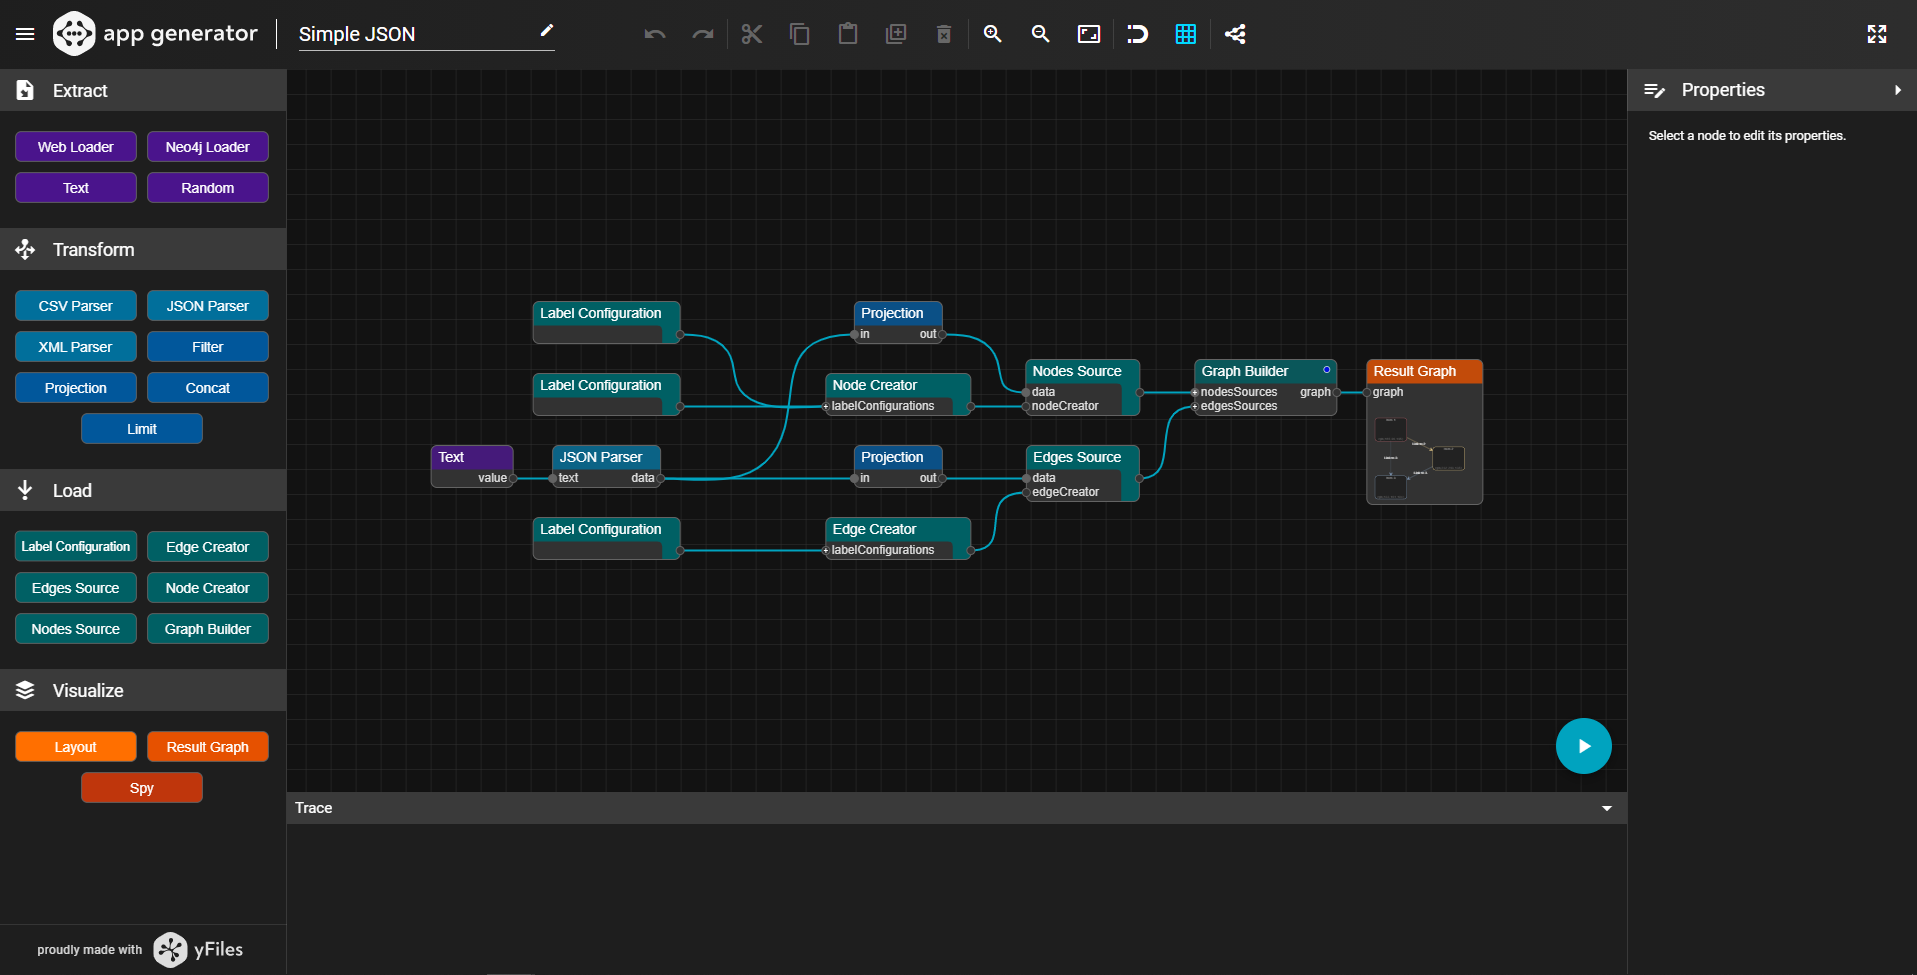
For developers and data scientists, the brand-new App Generator puts low-code programming at your fingertips, making it very easy to rapidly build a prototype, or even whole yFiles apps, for data visualization.
We redesigned the Data Explorer for Neo4j, and equipped it with an improved UI on a technical level, this paves the way for 2021, when the Data Explorer will become available for other graph database systems.
Our developers are already busily working on the next yFiles major release, also scheduled for 2021. This release will provide more developer goodies and a tighter integration with the App Generator. Automatic layouts will be able to distinguish between (and automatically respect) the different semantic types of elements. Plus, as usual, we’ll be adding lots of features in the areas of automatic layout, data binding, and framework integrations. Stay up to date on our Twitter or LinkedIn!
“These guys know what they’re doing! This is what a really well-designed API should look like."Roger Bjärevall, CEO DbVis Software AB, customer since 2000

Responding to crises as a team

Prior to the pandemic, yWorks employees almost always commuted, many on their company-issued e-bikes. Remote work was rare. After all, our headquarters on the west side of Tuebingen are spacious and bright, and everyone enjoys the benefits of teaming up. From feasting on large pizzas at our big dining table, testing our mettle in the Mario Kart “lunchbreak league”, or joining colleagues for a brisk walk to the food truck, we all had many reasons to come to work every day. And, beginning in March, one reason to stay home: Covid-19.
The managing directors took action early on, setting up stable infrastructure for remote collaboration. So before Germany went into lockdown, the first colleagues were already working from home. It was
exciting to see how quickly our terrific team responded to the challenges that arose.
Our face-to-face events also had to go digital. One example: The Neo4j GraphTour, sponsored by yWorks and originally planned as a road trip through Europe, morphed into an online event
mid-March.
Combating Covid
…by putting our talents to work!
In 2020, we supported 7 projects to fight Covid that are using yFiles and donated 39 Graphity licenses to help companies and institutions #FightCorona. Each of us can make a difference. Get the details here.

People have the power
Our passion for diagramming is powered by people: colleagues, customers, and the graph and data enthusiasts we normally meet at events, customer sites, and our headquarters. This year, we enjoyed connecting with the graph community digitally, sponsoring major digital events like NODES 2020, as well as the annual Graph Drawing Symposium.
Our customers around the world
Thanks to our tools, we are present in almost every country on Earth. Our diagramming SDK yFiles is visualizing data on every inhabited continent — and who knows, maybe Antarctic researchers use it, too?
Our customers worldwide helped make 2020 a successful year on the books. What makes us especially proud is when people recommend our products and services to workmates and friends. Again and again, we hear how much institutions and companies value the support we provide.
“We’ve added custom diagraming templates, diagram exports, node grouping, line snapping and angle constraints, and a slew of other features. These have made the tool much easier to use, and are only possible because of the advanced features of yFiles.”Travis Collins, CTO Connect Our Kids, customer since 2020

Summing up, looking ahead
It looks like we made the best of a very challenging year. And we couldn’t have done it without our loyal customers, colleagues, and partners. yWorks extends a heartfelt THANK YOU to all who supported our
products and initiatives. We hope to see you next year — online or in person — at our y20 anniversary. Join us in celebrating our first two decades!
Stay safe and be well in 2021,
your diagramming experts
yWorks