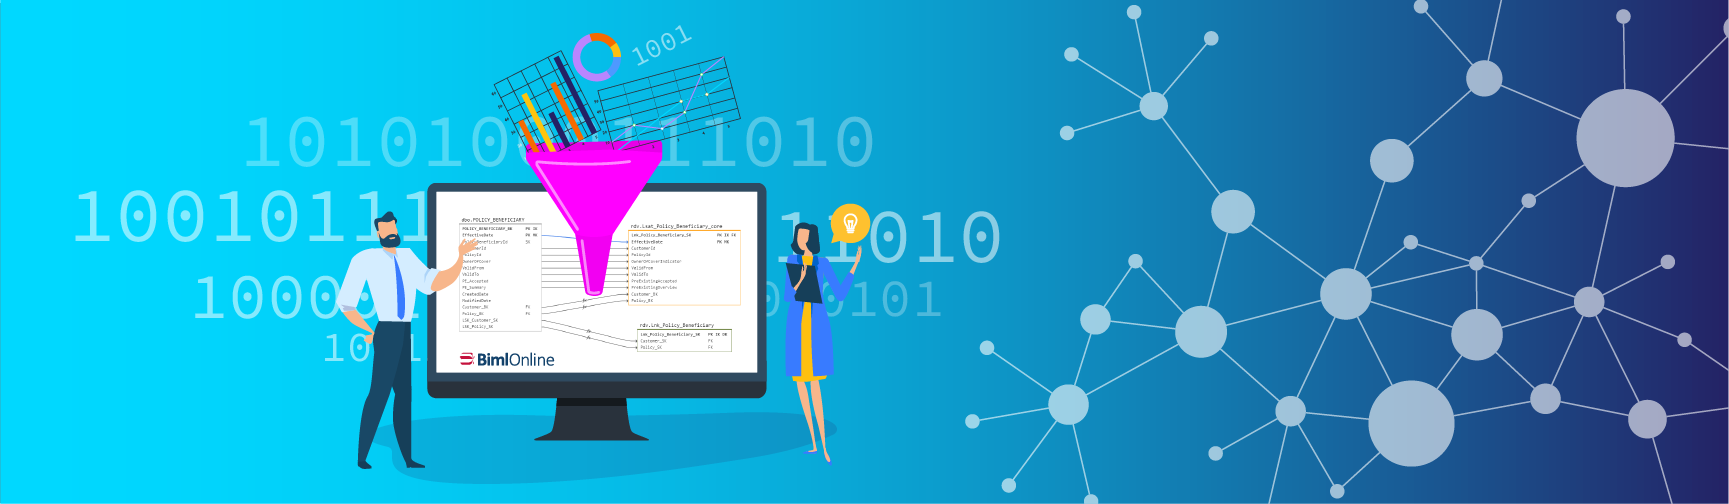
How data solution automation vendor Varigence uses diagrams to enhance the benefits of data.
Creating a data solution (such as a data warehouse) often means integrating data from various disparate systems into a holistic representation of the company’s business and its data.
Data solutions are inherently complex. To produce meaningful results, data typically passes through many small "steps" that are defined in a layered solution architecture.
By way of these data logistics processes — traditionally referred to as Extract, Transform and Load (‘ETL’) — the data is gradually morphed into its target interpretation, that is, the intended (data) model from which consumers can access the data for a variety of use-cases.

Diagramming for data management
Read moreData solutions can easily contain thousands of data logistics processes that each require development, classification, maintenance, and monitoring. Delivering and managing so many data logistics processes by hand can be extremely time consuming.
This effort is compounded by the relentless pace of change and technology innovation in any given organization – both in terms of new requirements for data interpretation, as well as the introduction of new IT systems that require data integration.
Varigence is a company that specializes in Data Solution Automation, and addresses this challenge by providing software that automates the development of data logistics processes – as well as the various frameworks that are required to operate and maintain them.
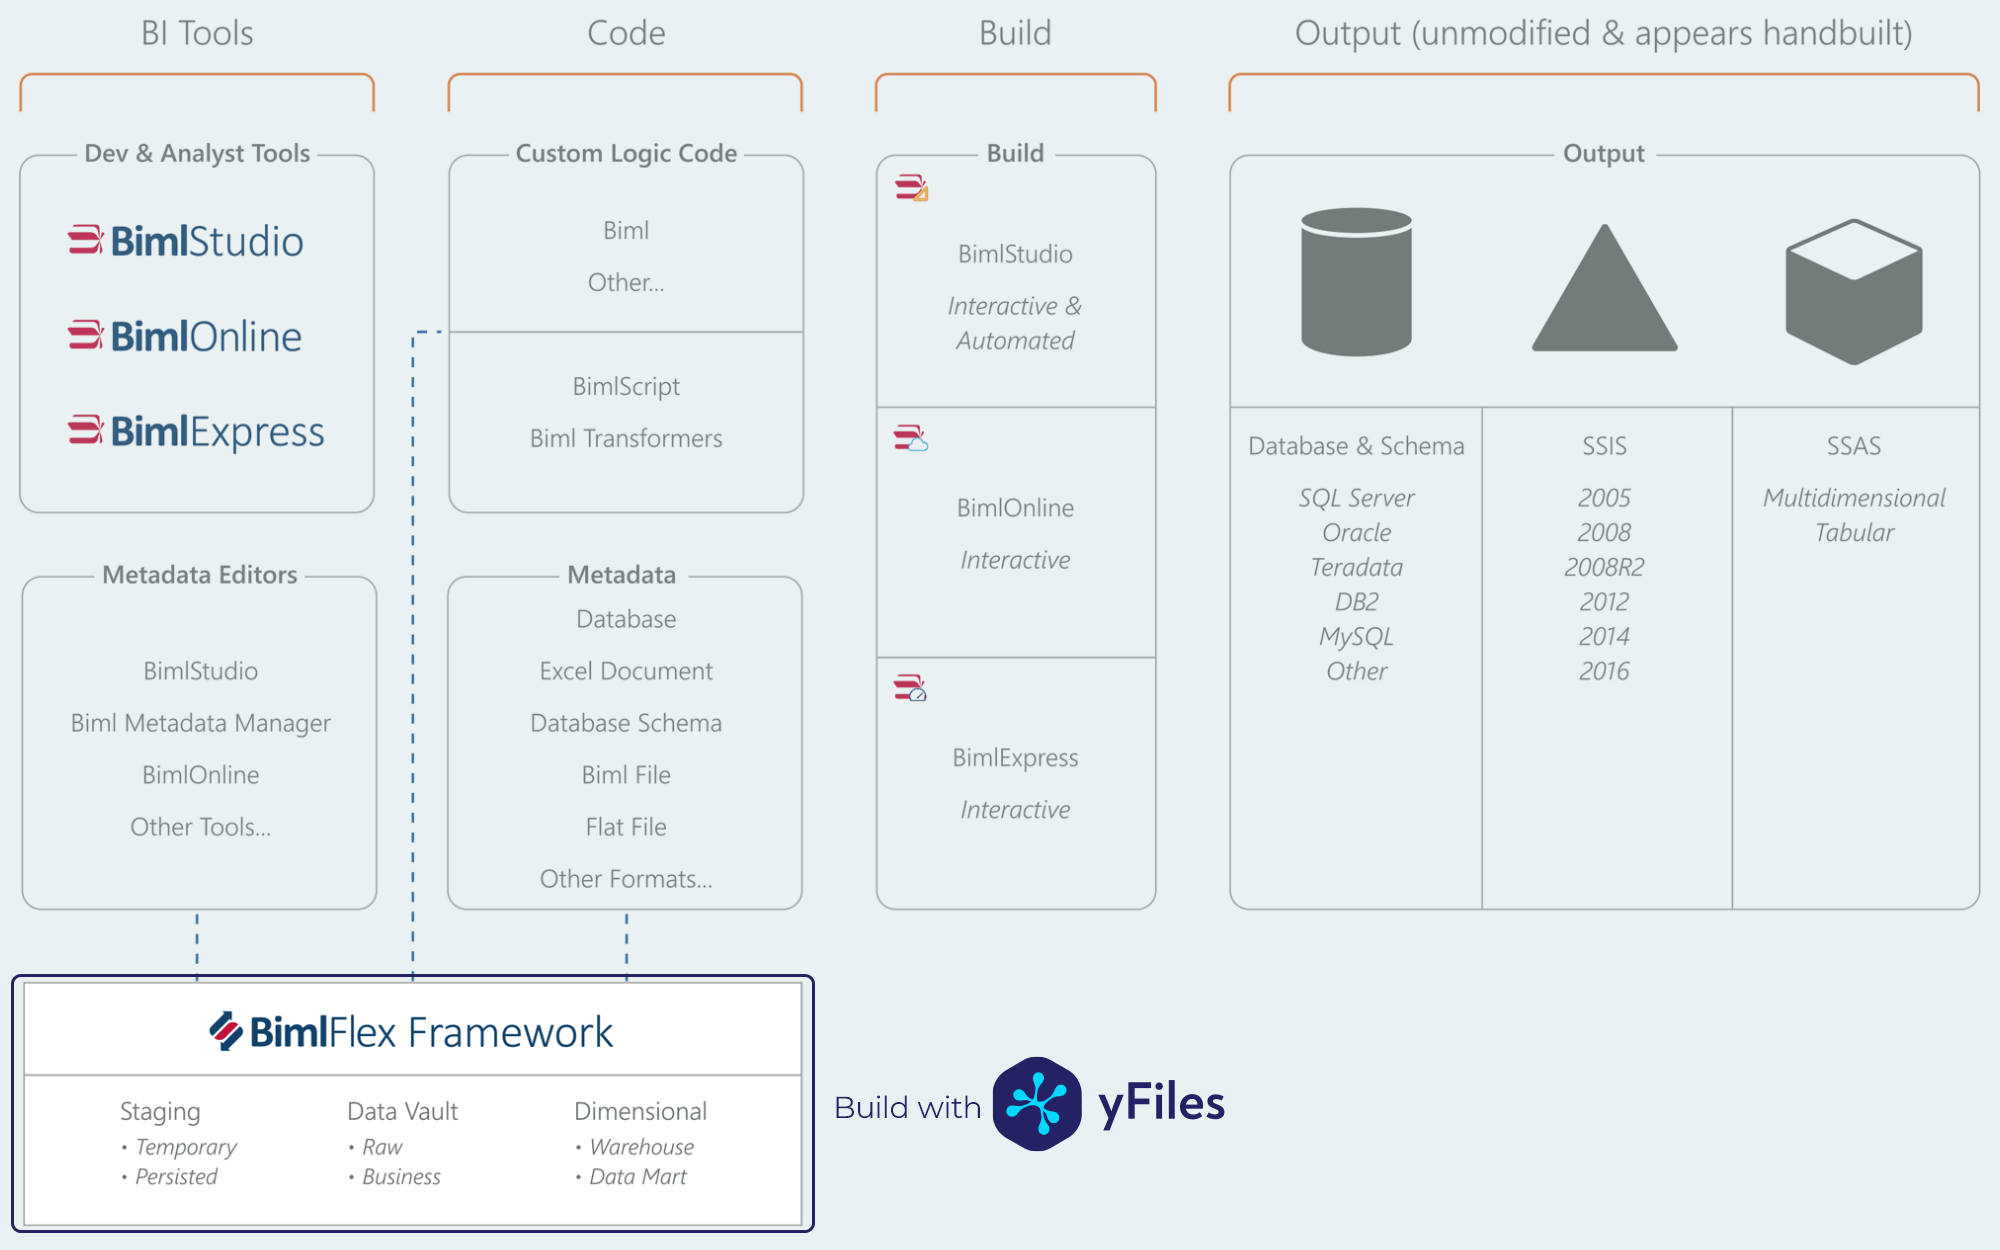
Varigence’s flagship product "BimlFlex" allows you to define a data solution and generate (forward-engineer) all the code, scripts and artefacts to deploy and run the solution.
Needs & objectives
Needs analysis
- Provide various user interactions with the graph objects
- Strong auto-layout features
- Great visuals
Objectives
- Provide an immersive design experience for data logistics
- Display the lineage relationships between data sets
- Easily adjust the level of abstraction, to look at the big picture, or certain details
More than visualization
At the basis of data automation lies the concept of "source to target" mappings between one or more data sets. This "mapping" relationship can be generated as data logistics processes for various types of data infrastructure, such as database views, stored procedures, Databricks notebooks, Azure Data Factory (ADF) pipelines, SQL Server Integration Services (SSIS) packages, and various scripting languages.
To understand the flow of data, being able to display the lineage between the source- and target data sets in a meaningful way is a crucial requirement.
However, as a design and development product, it is important to not only visualise the definition of data and its relationships, but also to define them.
Varigence requires a graphical user interface that allows users to interact with the design in a variety of ways. This is where yFiles comes in.
 At the heart of our application lies a powerful data visualization component, and
yFiles has been the key to its success. With yFiles, we've been able to leverage
decades of expertise and advanced technology in data visualization, freeing us up to
focus on our core competencies.Scott Currie, CEO at Varigence, Creator of Biml
At the heart of our application lies a powerful data visualization component, and
yFiles has been the key to its success. With yFiles, we've been able to leverage
decades of expertise and advanced technology in data visualization, freeing us up to
focus on our core competencies.Scott Currie, CEO at Varigence, Creator of Biml
An interactive graph
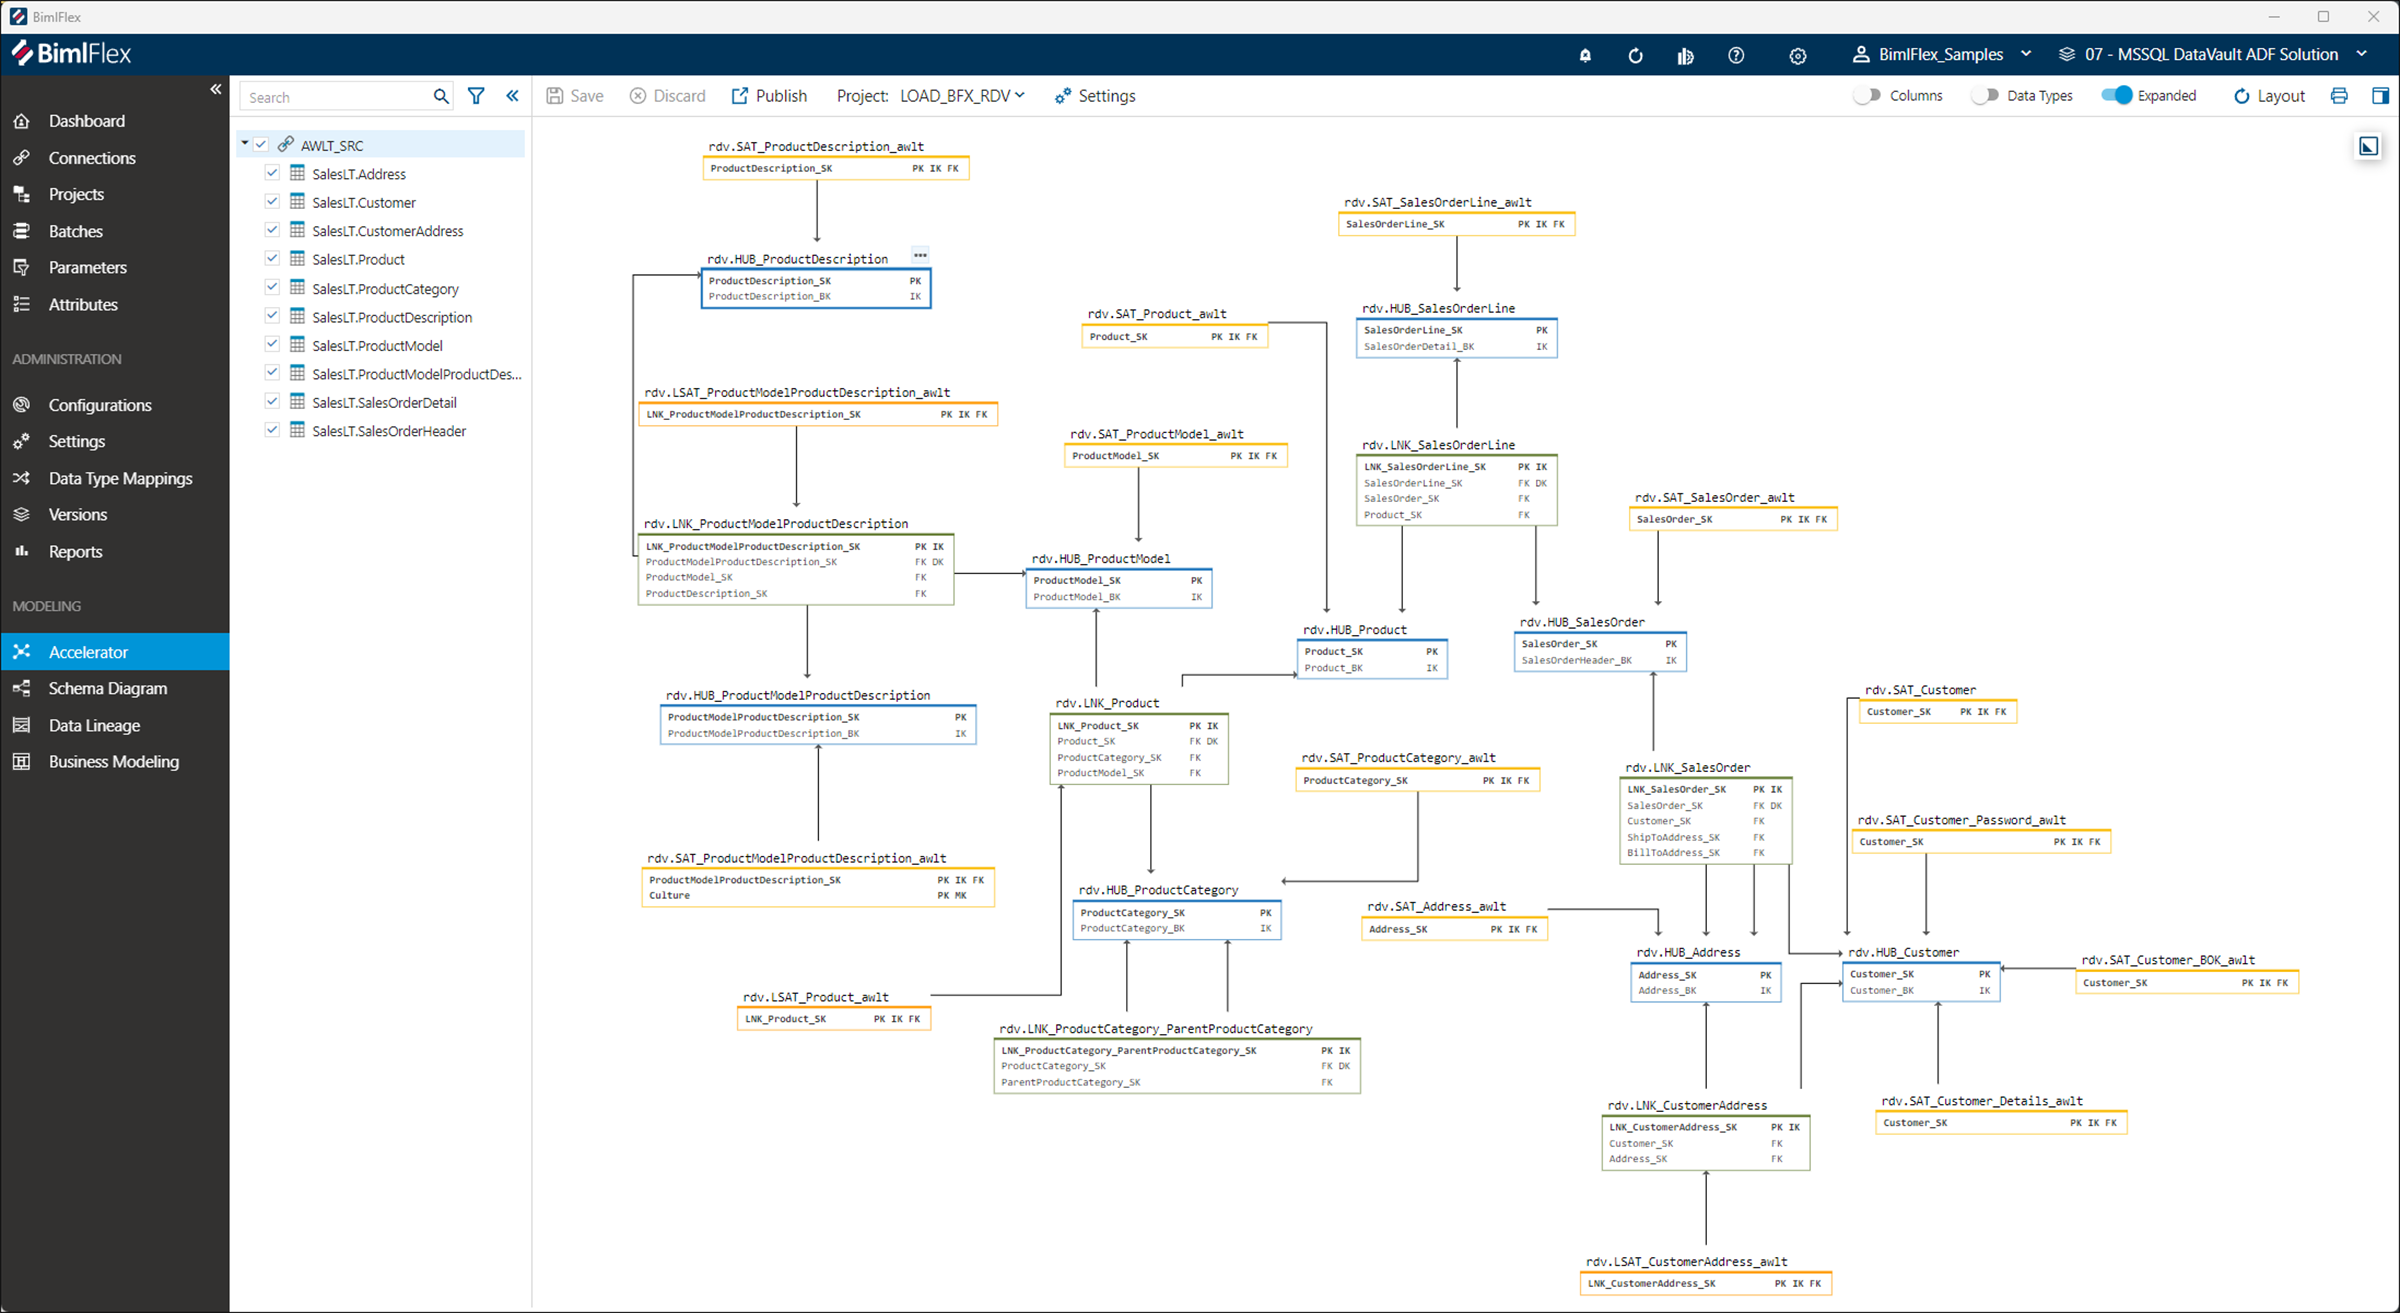
One of the main features of BimlFlex is called the "Accelerator." After pointing BimlFlex to systems from which to integrate data, the Accelerator infers an initial data model from imported (source) data structures, including the lineage from the data source to the target model.
This is one of the key features for which yFiles is used, as it is possible to directly interact with the suggested model and tweak it to match the data requirements.
In the interface, users can add, modify, or remove relationships and apply various conventions that alter the model to meet the intended outcome. Results are immediately visible so users can review the effects of their customisation, and adjust accordingly if required.
Improving user experience
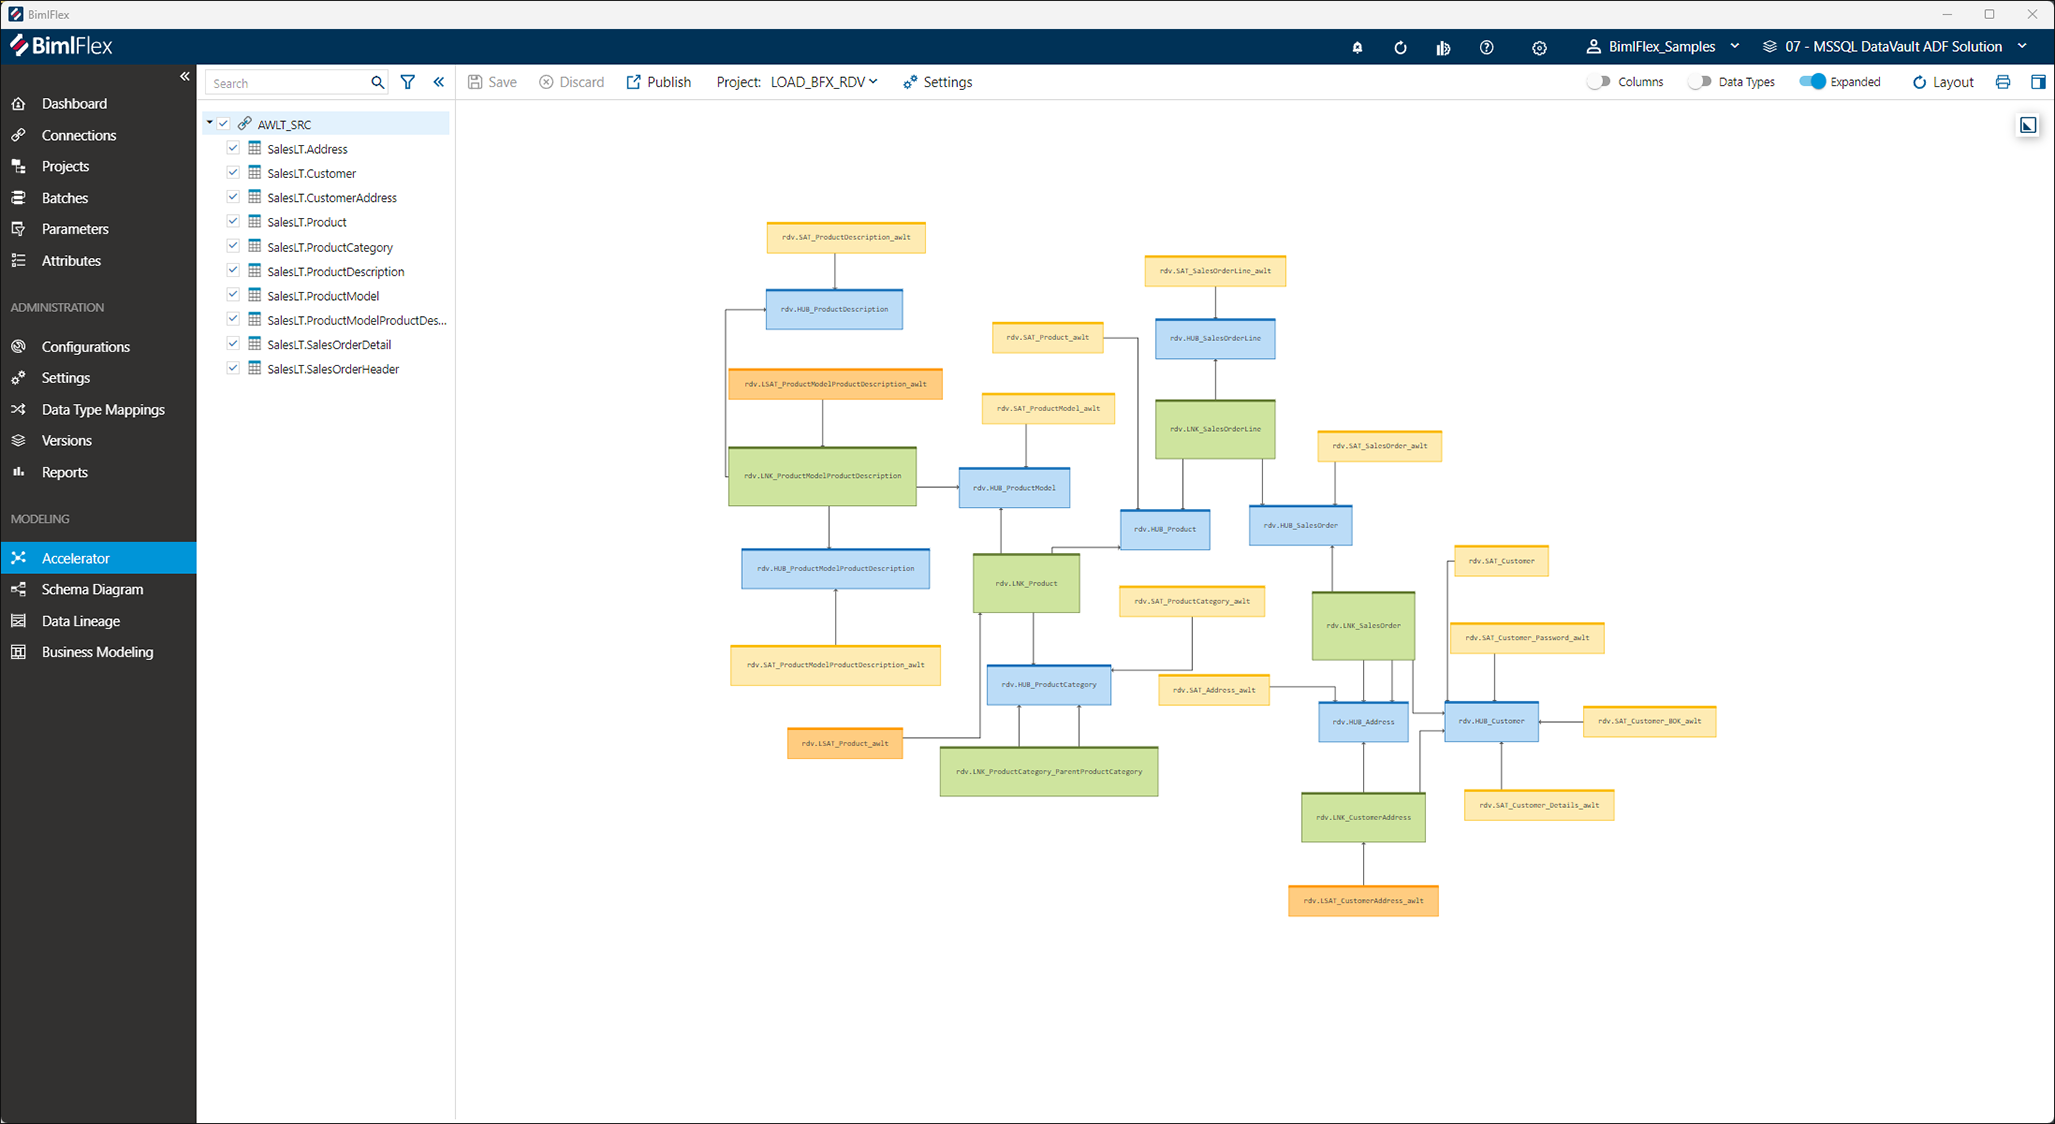
yFiles provides Varigence with a modern, fast and feature-rich ability to implement many kinds of relationship and object visualisations in a way that is easy for its users to work with.
When working with the BimlFlex data solution automation suite, the software will provide a first version of the target data model and lineage based on metadata available in the systems that provide the data. Users can directly interact with the generated objects, such as database tables or relationships, and add modifications to the way the data needs to be interpreted when loading from the designated source to the new target structure.
Test and experience yFiles free of charge!

- Free support
- Fully functional
- 100+ source-code examples
Building our prototype was made simple with the help of yFiles and its numerous source code demos.Scott Currie, CEO at Varigence, Creator of Biml
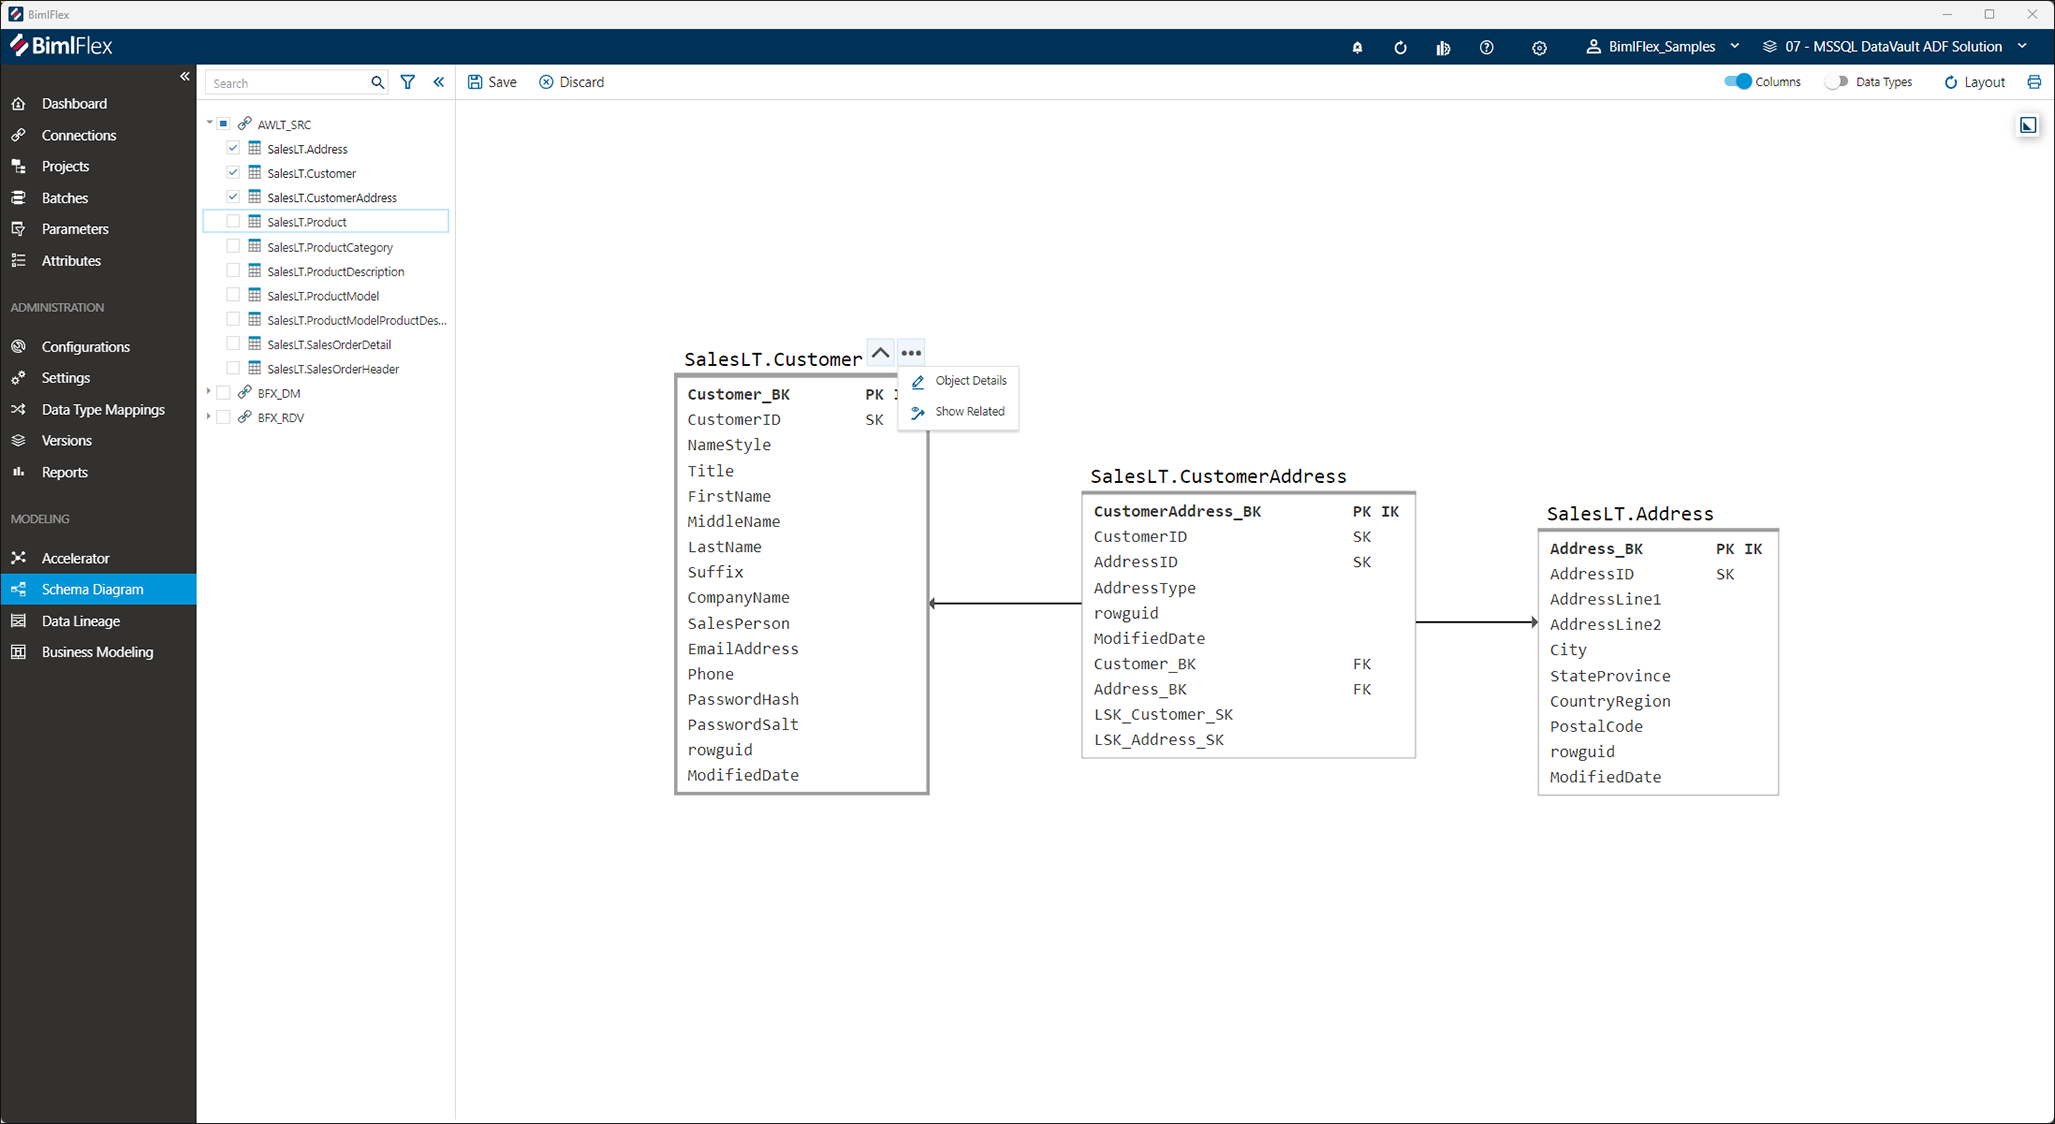
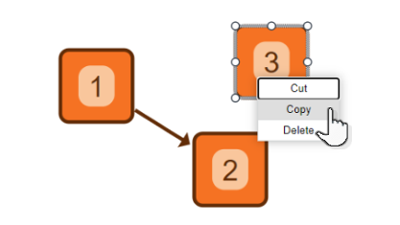
For example, proposed data warehouse tables can be modified through the context menu. This way, the purpose or definition of a table can be changed, including selecting if certain properties should be included in code generation, or interpreted differently. This is how users of BimlFlex "tweak" the data model into what it needs to be to meet the intended data requirements.
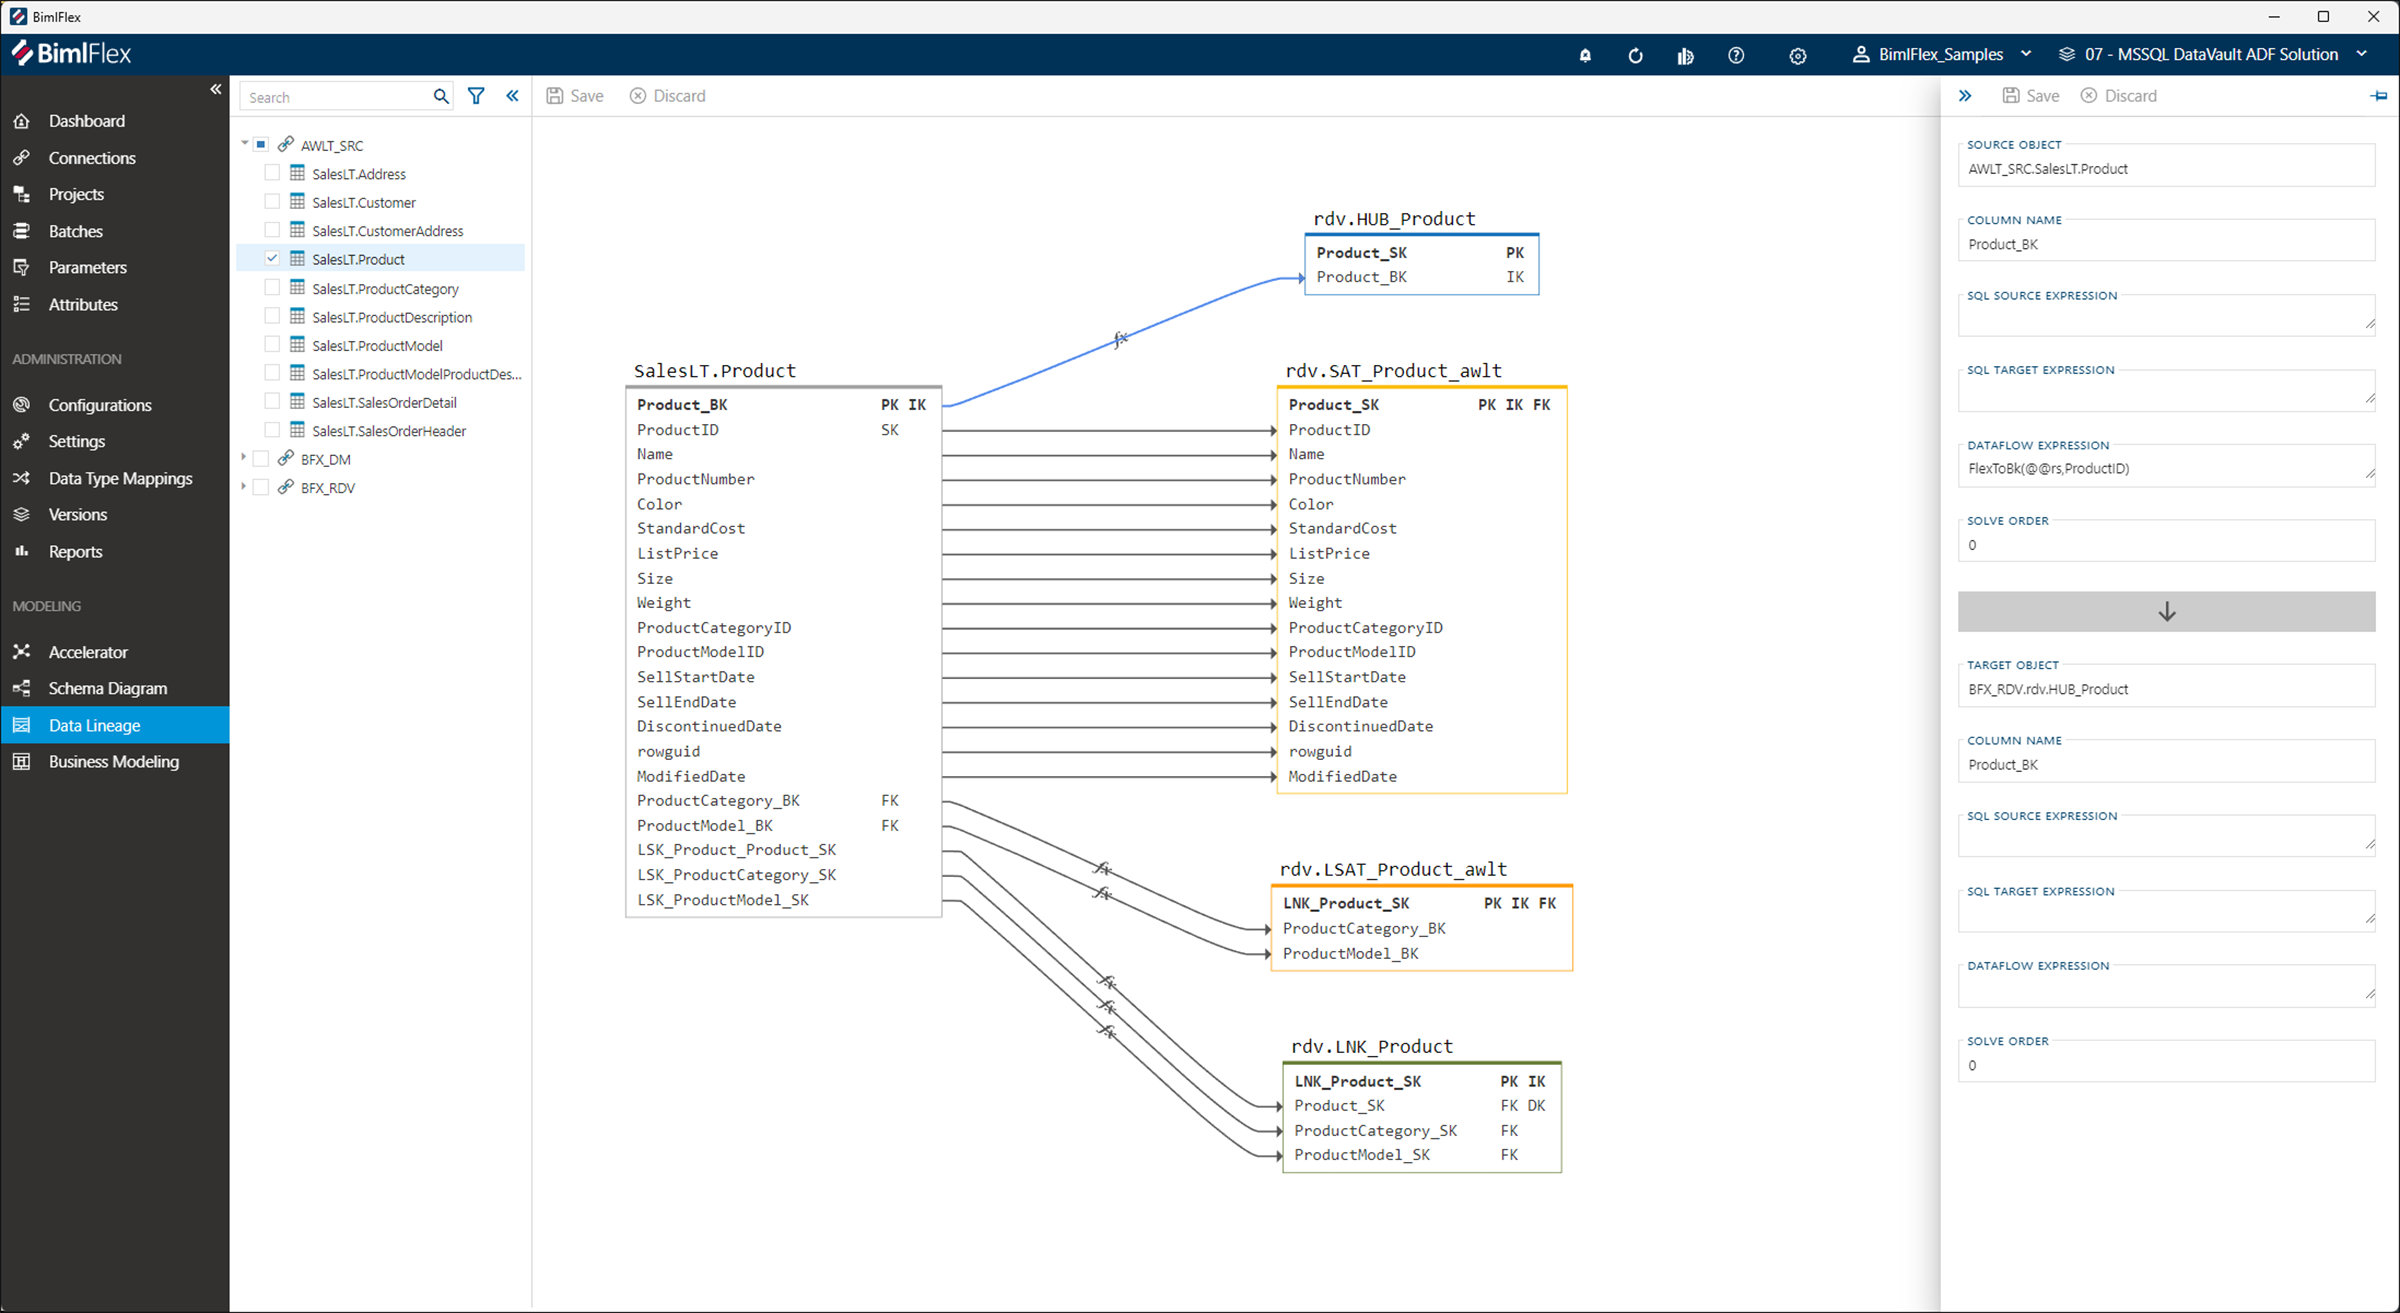
This also extends to implementing complex transformations, which are defined as part of the mapping between a source and target column. Each column mapping can contain logic that transforms the data, and this is represented as an ‘edge’ in yFiles which allows for a variety of interactions. This mapping is then used to generate native code for the target infrastructure.
Defining the target (data) model and using it to forward-engineer the corresponding data logistics processes, is where the users of Varigence’s products spend the most time – so having a great experience in this area is a top priority.
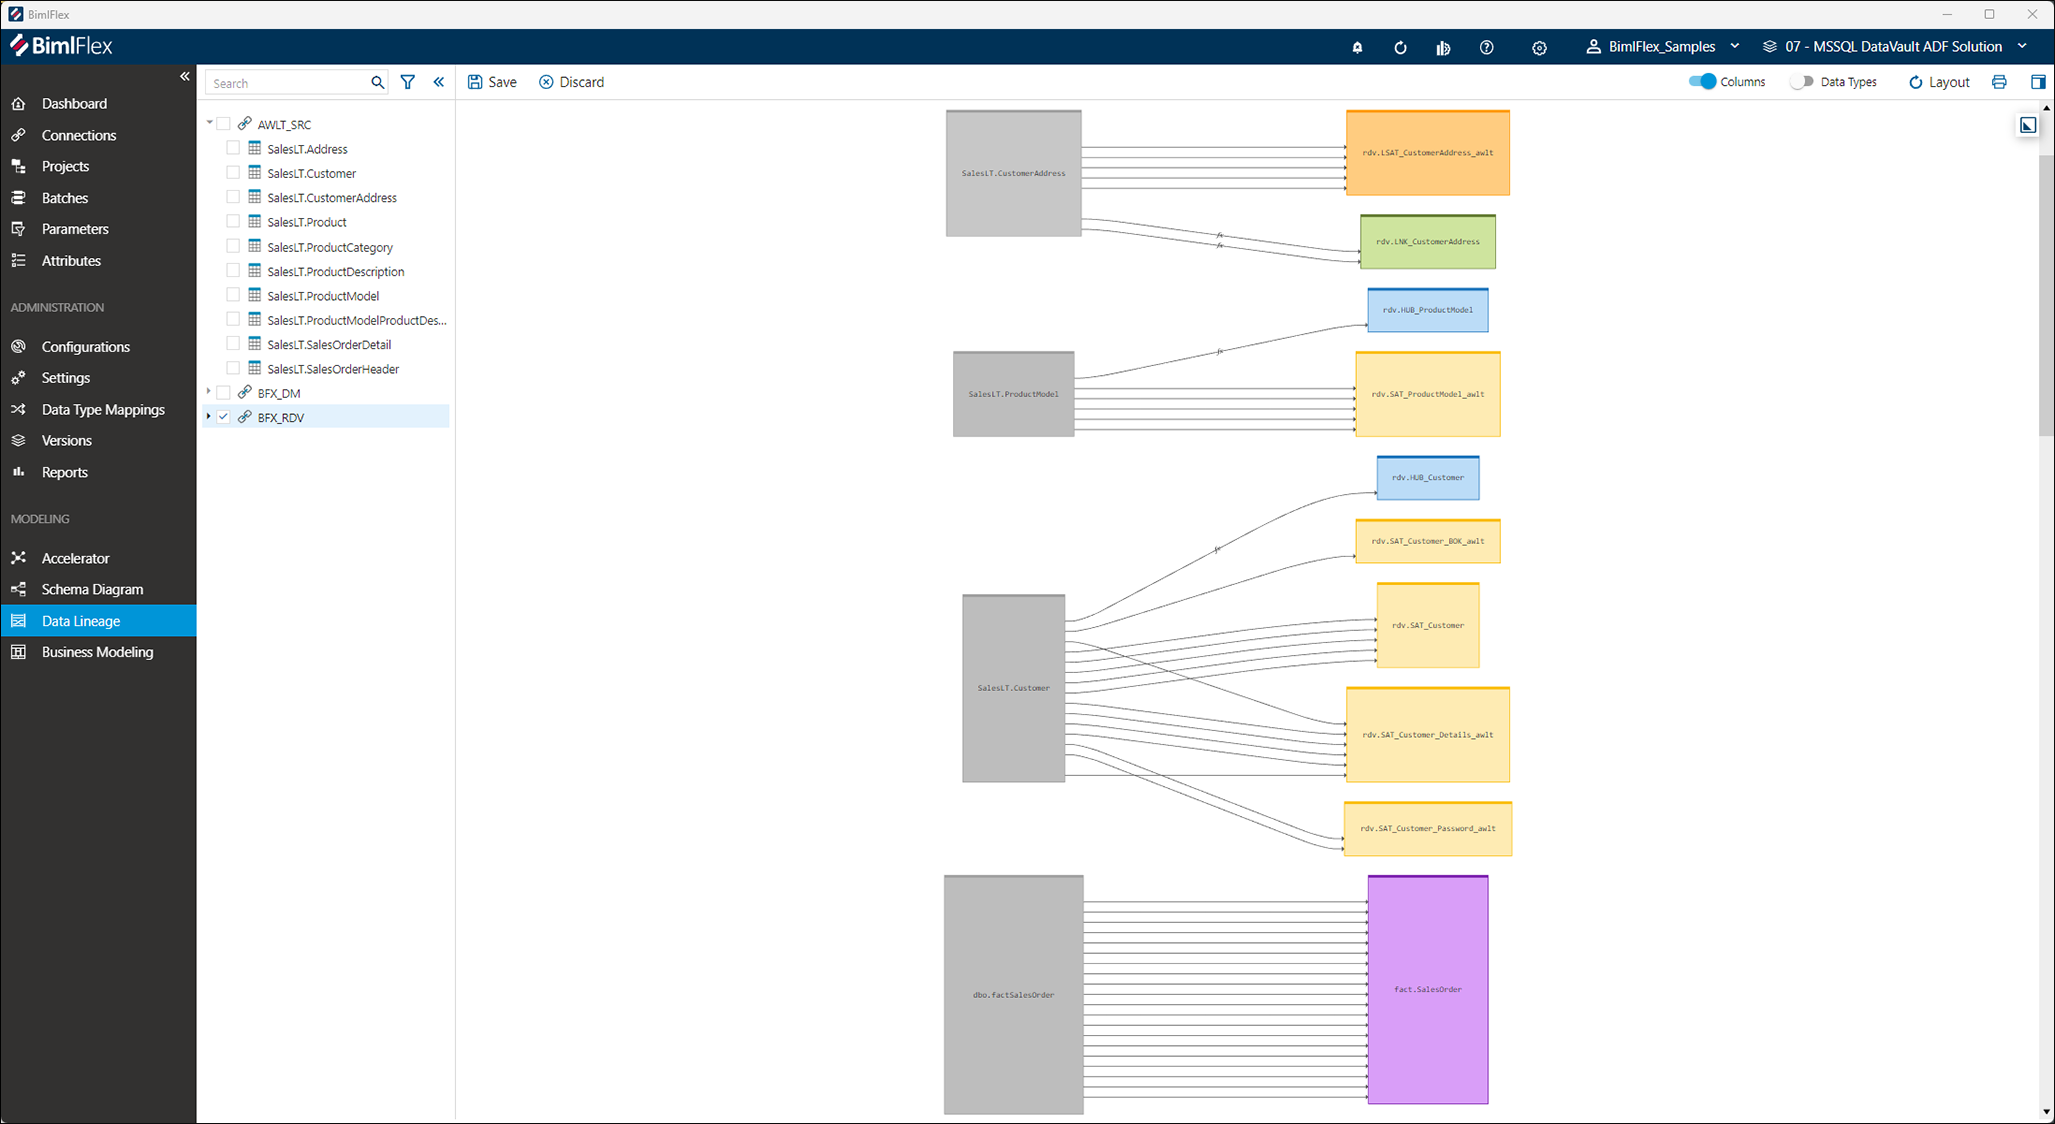
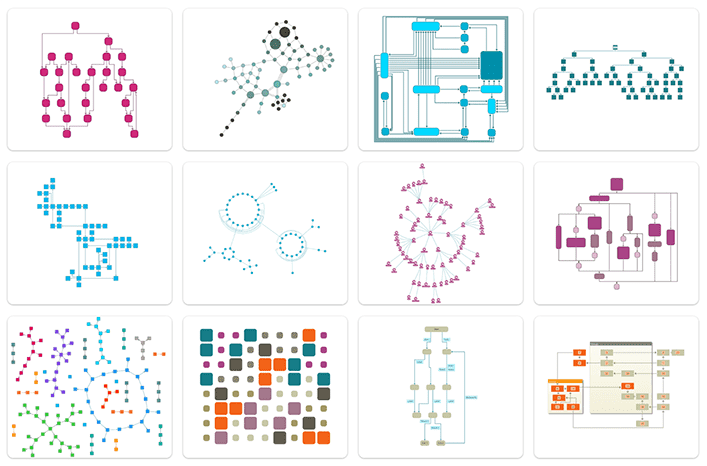
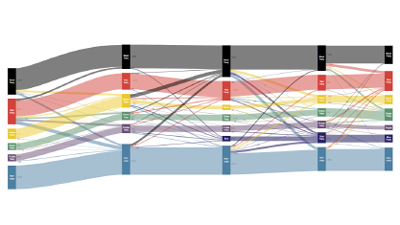
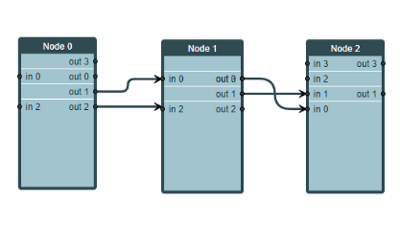
The utilization of yFiles source code demos proved to be highly valuable for Varigence. The Sankey demo was used in the lineage view to clearly show the mapping of columns to different targets. The List Node demo was used to create relationships between tables and columns, providing a detailed and easily understood visualization.
The Context Menu demo allowed for efficient and intuitive modeling operations, such as splitting tables and adding keys.
Helpful source-code demos
These demos helped Varigence to effectively utilize the full potential of the software, streamlining their processes and improving overall efficiency.
Scalability and new diagramming features
Varigence has developed an innovative solution for data modeling and integration by utilizing the powerful yFiles graph visualization and layout library. This integration has not only improved the performance and scalability of Varigence's data management platform, but has also enabled new plans and features to be seamlessly implemented. The incorporation of yFiles has opened up additional possibilities for Varigence, allowing the company to better serve its customers and meet the demands of the rapidly evolving data landscape.
About Varigence
Varigence is a software company founded in 2009 that helps businesses and organizations manage and integrate data. The company offers a variety of products and services, including tools that automate the creation of data solutions and support for different data platforms. Varigence's products, including BimlFlex, BimlStudio, and BimlExpress, allow users to define, generate, and deploy data solutions for a variety of platforms, including the Microsoft data stack, Synapse, Delta Lake, Databricks, and Snowflake. In addition to its software products, Varigence also offers professional services, including training, consulting, and support, to help customers effectively implement and use its products.
Varigence has offices in the United States, South Africa, and Australia and has received numerous awards and accolades for its products and services. The company is committed to continuously evolving to automate data solutions employing the latest technologies and industry trends and works with a wide range of customers around the world, including Fortune 500 companies, small and medium-sized businesses, and government agencies.