Ever since we released our commercial graph drawing library for HTML5 and JavaScript/Typescript, we have been working hard to get the best possible performance that is available on the HTML5 platform: Our initial implementation six years ago only supported SVG, because we found it to be the most flexible, most widely available and easy to work with API for us and our customers, who are also developers. At that time (when Internet Explorer 9 was still in wide use), it already was the best performing technology, at least if you wanted to render high-quality, non-trivial, large-scale graphics.
Over the years the situation with SVG actually improved: since most of the rendering logic takes place in native code and may even benefit from hardware acceleration, performance went up and cross-browser support improved even for the more advanced features like hardware accelerated filters and CSS3 transitions and animations for SVG elements.
SVG was and is the best option for rendering high-quality vector graphics
Still, with the second major release of our library about four years ago, we decided to also add HTML5 Canvas as a possible rendering technique to our programming library. This meant that developers could use SVG or Canvas for rendering their visualizations and even mix both techniques in the same visualization. Why did we do that? For the technical kind of drawing, SVG is actually far superior over Canvas: it's easier to import graphical assets and performs better for non-trivial graphics. The reason was that for the very simple kind of graphics, where only simple lines and a few rectangles or maybe simple circles are required, the performance of Canvas is actually better if you have lots and lots of elements on the screen at the same time. Our component uses "virtualization" and does not render those elements which are currently scrolled off-screen, but if users want to display thousands of elements on the screen at the same time, SVG still could not compete with the performance of Canvas if the number of drawing primitives is high and the rendering is very simple. The DOM that is required for the rendering gets too big if thousands of elements are rendered using SVG on slower devices. That's where Canvas actually really shines and that's why we added Canvas rendering as an option.
Canvas is faster for simple graphics
Today most of the time we recommend a hybrid-approach, which we call level-of-detail rendering: Once the user zooms into the visualization and only few elements are visible on the screen, we use SVG to display crisp, high-quality, complex vector graphics. But if the user zooms out to get an overview of the network or diagram, we seamlessly switch to Canvas rendering and use simpler visualizations of the elements that require fewer JavaScript calls to the Canvas API. For export, even for the zoomed out variant, we recommend sticking with SVG to get crisp, high-quality SVGs and PDFs that look great on large-scale print-outs and high-dpi screens. In this scenario it doesn't matter whether the export takes more than a few milliseconds, because you will only export the image once, whereas in an interactive scenario you might have to re-render the whole image 60 times per second to get the best possible experience for the end-user.
Introducing WebGL rendering
With the 2.1 version of yFiles for HTML, among other things, we added yet another option to our rendering stack: WebGL is now also available to developers to choose from and just like with Canvas it is possible to mix all three technologies in the same diagram at the same time to get the best of all three worlds: WebGL rendering absolutely outperforms both Canvas and SVG when it comes to even simpler renderings that mostly consist of simple polygons. It doesn't work nearly as well with high-quality text-rendering and rendering complex graphics most of the time is even slower. But it does work fabulously well for the very high-level views of very large network visualizations! Even with the simple built-in on-chip graphics card adapters of today's desktop CPUs it is possible to render tens of thousands of elements on the screen at the same time with perfect frame rates. With medium class graphic card adapters on desktops more than one hundred thousand elements on the screen with great frame-rates is absolutely feasible. All ever-green browsers (Chrome, Firefox, Edge, Safari, and derivatives) support this technology and with WebGL, even mobile devices that are a lot slower than desktops CPU-wise can render a huge number of items with great frame rates using their built-in GPUs.
Our recommendation
So what is our recommendation today? If you really need to display tens of thousands of elements on the screen at the same time, WebGL can be a real life-saver: Even for the typical hair-ball visualization you can achieve buttery-smooth 60 fps and once you zoom in more closely, you can add Canvas rendering to render the labels and for close-ups you can switch again to SVG to get high-quality, interactive, renderings and crisp graphics at great performance even on very high-DPI devices with hardware accelerated CSS effects and filters!
And why did it take us so long to add WebGL to our rendering stack? WebGL at its core is a beast to work with. Without third-party libraries (which developers can use, if they want to program WebGL with our library), programming low-level WebGL that performs great is very hard. From a developer usability point of view, WebGL is certainly the least desirable of the three technologies, at least in the context of those types of visualizations that we deal with.
WebGL is a beast to work with
So in a way we wanted to keep that complexity away from our customers, the developers. With the new release we added a number of default visualizations that they can use just like they were using the default SVG and Canvas visualizations. In this case, the complexity of WebGL is hidden behind an abstraction layer, so they don't need to deal with the complexity if they don't want to, but still get the good performance. As usual we still make it possible for developers to get their hands dirty: If they want to, they get the possibility to access the low-level APIs directly and program against SVG, Canvas, and WebGL without any layers in between or even with the third party library of their choice to help them with their tasks.
Still, the main reason for us to wait with the release was a completely different one: We actually did not believe that it should be necessary to use WebGL: Even now that we have it in the stack, we still recommend not even trying to display networks and diagrams of that size, because of the (usually) rather poor user experience this results in: Many of these huge diagrams that you may have seen before do look great at first sight, however this is mostly from an artistic point of view. There is often very little real value in these diagrams: Sometimes simply printing the number of elements as a string would provide more information than the picture. It just wouldn't have that cool, super-complex look...
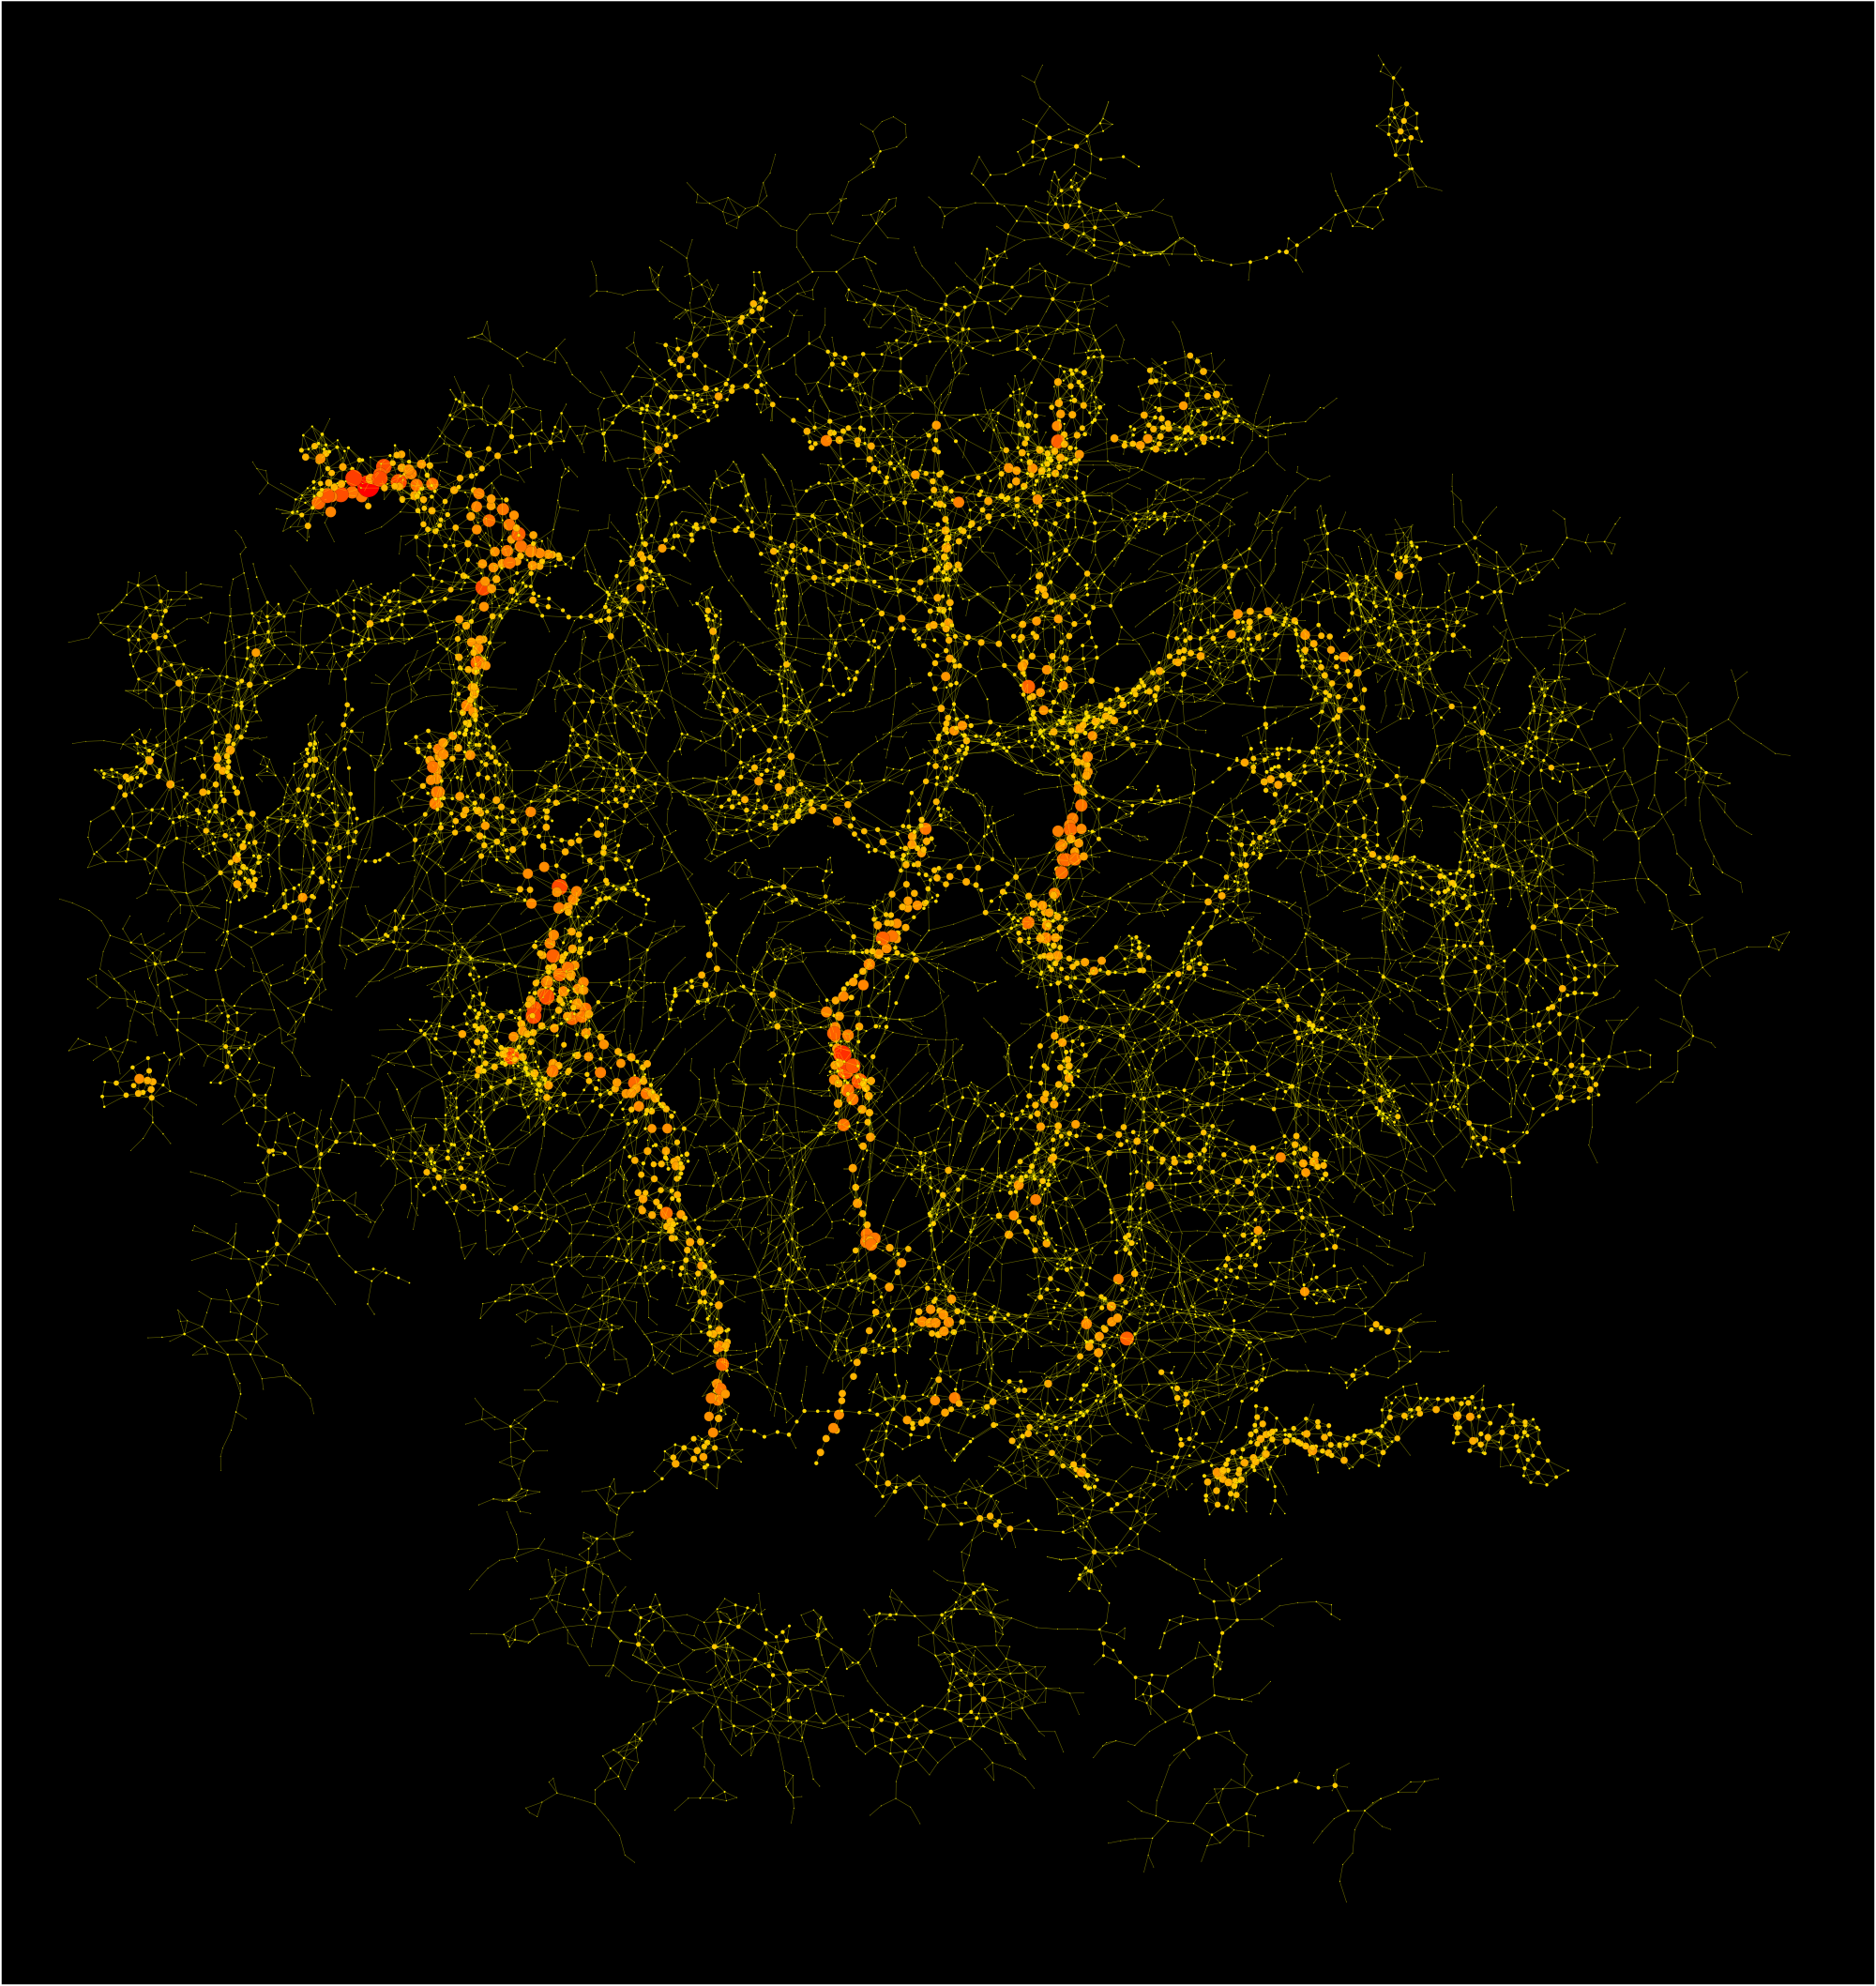
Sometimes simply printing the number of elements would provide more useful information than the picture. It just wouldn't look that cool.
Usually we recommend applying filtering techniques in order to reduce the number of elements in the diagram to become a low three figure number at most. Ideally only a few dozen elements should be on the screen, because this is what the average human brain can best work with. This can be achieved using drill-down techniques, expand/collapse operations, master-detail views and simple filtering. The difficulty here lies in finding the right rules for the data-set. Only with a good domain-knowledge of the graph structure it is possible to come up with meaningful filter sets and groupings. Using generic structural-only graph analysis, often does not suffice, here, but domain-knowledge and graph analysis algorithms need to be combined.
But once we get to these low numbers of items on the screen, SVG really is the best choice, today, and it will probably stay the best choice for a long time to come. Still, if developers want to present a nice and well-performing rendering of a "hair-ball graph" to their customers, with the inclusion of WebGL in yFiles for HTML, this is now possible.
We have implemented a demo that shows the various pros and cons of the different rendering techniques. Everyone can try the demo online and switch between the various implementations to compare the performance of the three rendering techniques for diagrams at different sizes.
Give it a try and if you're a developer, we invite you to evaluate the software and start hacking away, today.
And the winner is...
So who is the winner? SVG, Canvas, or WebGL? For graph visualization clearly the combination of the three technologies is the winner!
In the tables below you can see how the various technologies compare for different classes of devices. Values are in frames per second and 'NR' stands for 'not recommended'. We compared a moderately new desktop PC (2016) which performs well for reasonable graph sizes and any rendering technology against a set of quite old tablet devices. Even with the fairly outdated devices WebGL allows for smooth visualizations of even larger networks and you get fine performance for regularly sized diagrams. Our tests of more recent (2016/2017) small notebook devices shows that you can get smooth high-quality SVG visualizations with reasonable graph sizes and perfect performance for large networks using WebGL technology.
| PC Core i7-6700 | Simple SVG | Complex SVG | Simple Canvas | Complex Canvas | Simple WebGL | Optimized, static WebGL |
|---|---|---|---|---|---|---|
| N = 100, M = 150 | 60 | 60 | 60 | 60 | 60 | 60 |
| N = 1k, M = 1k | 60 | NR | 60 | NR | 60 | 60 |
| N = 2k, M = 2k | 50 | NR | 53 | NR | 60 | 60 |
| N = 5k, M = 5k | 23 | NR | 23 | NR | 46 | 60 |
| N = 10k, M = 11k | 10 | NR | 11 | NR | 20 | 60 |
| iPad Air 2013 | Simple SVG | Complex SVG | Simple Canvas | Complex Canvas | Simple WebGL | Optimized, static WebGL |
|---|---|---|---|---|---|---|
| N = 100, M = 150 | 55 | NR | 60 | 9 | 60 | 60 |
| N = 1k, M = 1k | 17 | NR | 24 | NR | 40 | 60 |
| N = 2k, M = 2k | 7 | NR | 8 | NR | 20 | 60 |
| N = 5k, M = 5k | NR | NR | NR | NR | 10 | 60 |
| N = 10k, M = 11k | NR | NR | NR | NR | NR | 60 |
| Galaxy Tab 2014 | Simple SVG | Complex SVG | Simple Canvas | Complex Canvas | Simple WebGL | Optimized, static WebGL |
|---|---|---|---|---|---|---|
| N = 100, M = 150 | 22 | NR | 26 | NR | 35 | 35 |
| N = 1k, M = 1k | 7 | NR | 7 | NR | 10 | 35 |
| N = 2k, M = 2k | NR | NR | NR | NR | NR | 35 |
| N = 5k, M = 5k | NR | NR | NR | NR | NR | 30 |
| N = 10k, M = 11k | NR | NR | NR | NR | NR | 20 |
| MacBook 12" 2015 | Simple SVG | Complex SVG | Simple Canvas | Complex Canvas | Simple WebGL | Optimized, static WebGL |
|---|---|---|---|---|---|---|
| N = 100, M = 150 | 60 | 18 | 60 | 19 | 60 | 60 |
| N = 1k, M = 1k | 40 | NR | 55 | NR | 60 | 60 |
| N = 2k, M = 2k | 20 | NR | 28 | NR | 44 | 60 |
| N = 5k, M = 5k | NR | NR | 11 | NR | 20 | 60 |
| N = 10k, M = 11k | NR | NR | NR | NR | 12 | 60 |
| Surface i7-6650U | Simple SVG | Complex SVG | Simple Canvas | Complex Canvas | Simple WebGL | Optimized, static WebGL |
|---|---|---|---|---|---|---|
| N = 100, M = 150 | 60 | 28 | 60 | 15 | 60 | 60 |
| N = 1k, M = 1k | 40 | NR | 55 | NR | 60 | 60 |
| N = 2k, M = 2k | 23 | NR | 28 | NR | 50 | 60 |
| N = 5k, M = 5k | 9 | NR | 12 | NR | 24 | 60 |
| N = 10k, M = 11k | NR | NR | NR | NR | 14 | 60 |