Human minds grasp visual data much better than numerical data. Graphs and diagrams make it possible to depict, analyze, design, and refine relationships between thousands or even millions of data points. But large visualizations pose their own challenges…
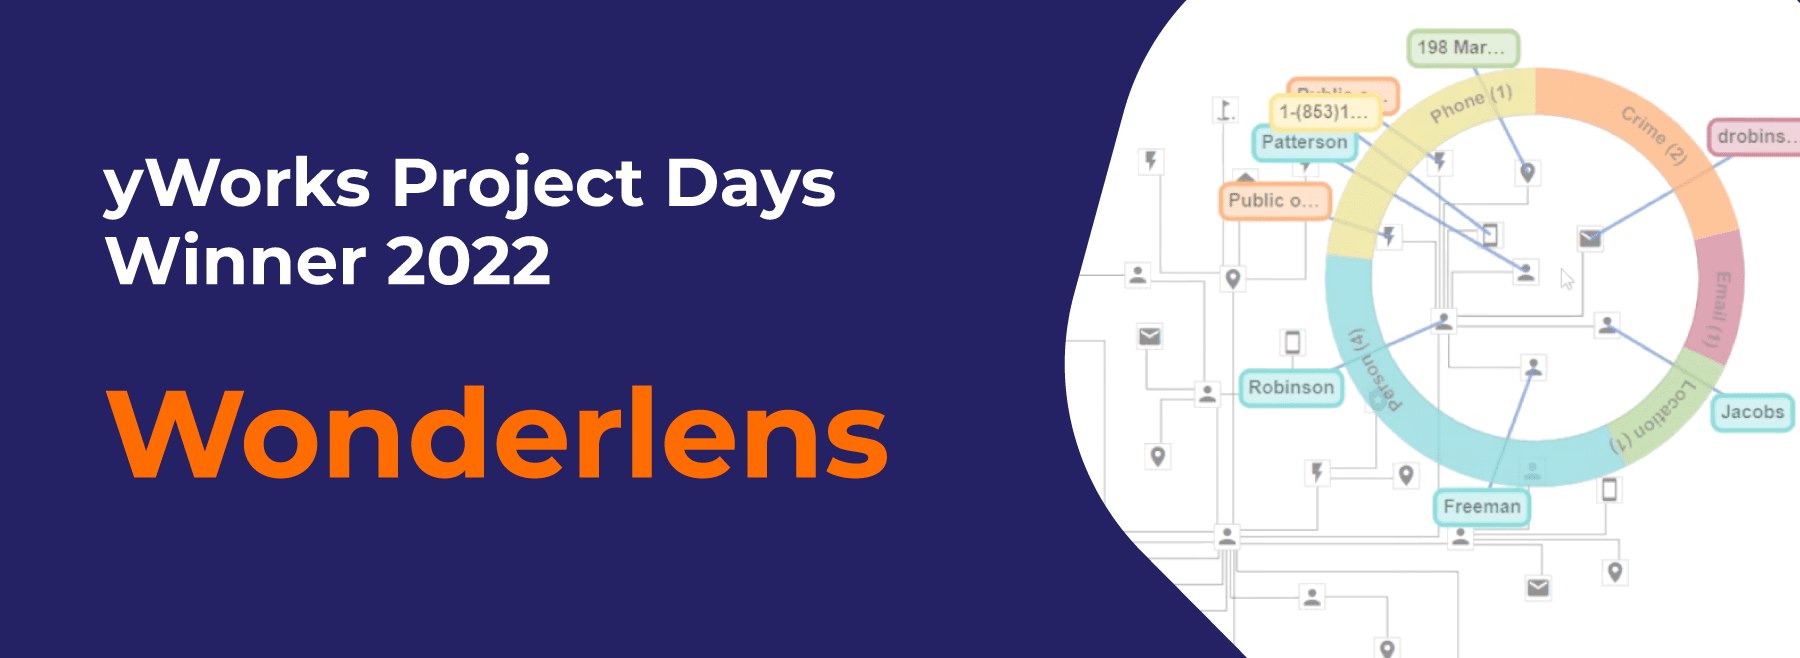
Wonderlens: 2022 winner of the yWorks Project Days contest
Project Days at yWorks
The office hums with excitement for 1–2 weeks a year as we dive into “Project Days,” our annual incubator. Small cross-disciplinary teams generate and explore ideas not necessarily connected to our core products, like yFiles or our diagramming editors. Discover previous “Project Days” innovations here and here.
During the yWorks Project Days, six experts from web development, algorithm engineering, and UX design gathered together to tackle some of these challenges by developing a tool for the interactive exploration of graph visualizations. In the first phase of the project, exploration techniques were discussed and elaborated based on multiple use cases. In the project's second phase the focus was on implementing the newly acquired ideas. In daily meetings, the current state of the exploration techniques was critically discussed and improved, taking into account the different perspectives of all experts. The result of this iterative process is the interactive sneak-peek graph explorer Wonderlens.
In the following, read more about the motivation, use cases, and implementation of the Wonderlens project. If you just want to try out the Wonderlens tool for exploring network visualizations, then have a look at our live demo.
Context versus detail
Exploring and analyzing large graphs typically requires repetitive zoom operations. To retrieve details from a large visualization, a user usually zooms in on specific details. When zooming in, the information within the focus area becomes legible, but large parts of the visualization disappear from the user’s view. Zooming out lets them appear again, but then details are lost. These sequences of zoom operations tend to destroy the user’s mental map and impede the interactive exploration of graphs.
Use cases
At the very beginning of the project, we only had rough ideas of how a lens tool could look and how it could be applied. We, therefore, created several mock-ups for possible use cases. As these greatly helped us to discuss and elaborate our ideas, we do not want to withhold them from you.
1. Simple lens shows additional information for focus node, e.g., all connections for a specific airport.
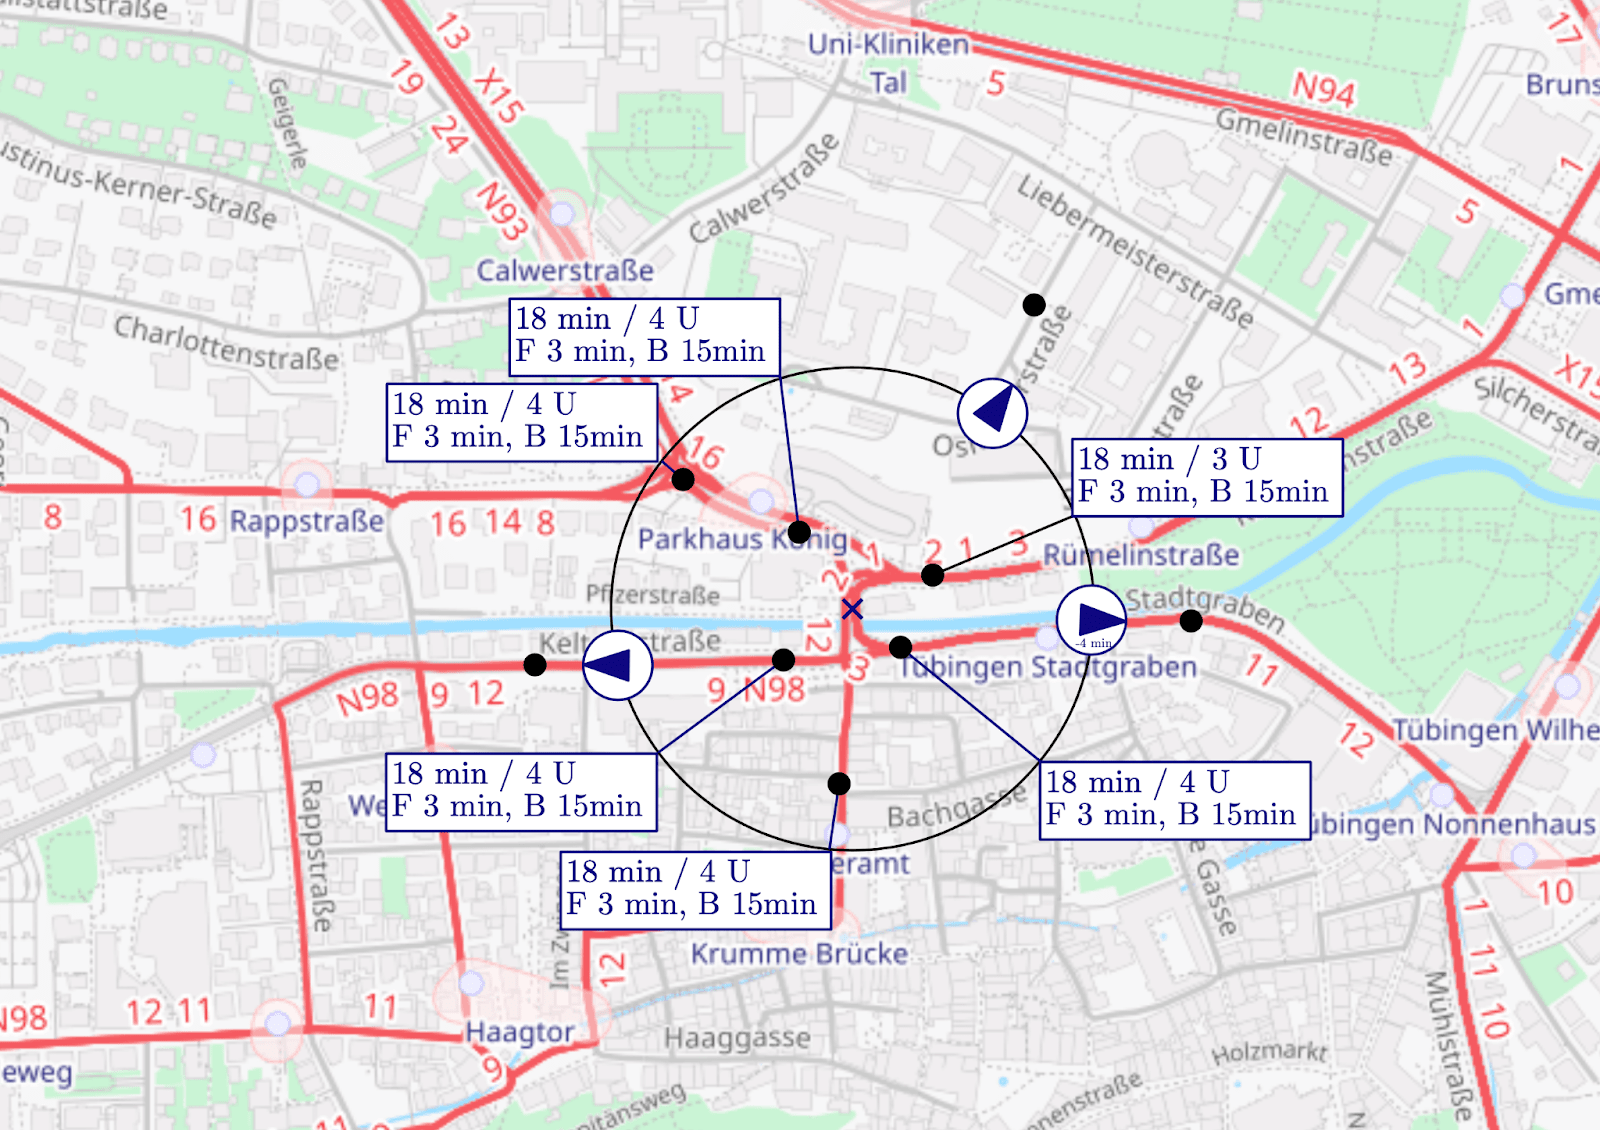
2. Meta lens supplies detailed information for focus node in relation to user coordinates: distance to bus stops, restaurants, other points of interest, etc.
3. Process lens lets you explore what happens between nodes. Track the flow of data, energy, goods, and vehicles.
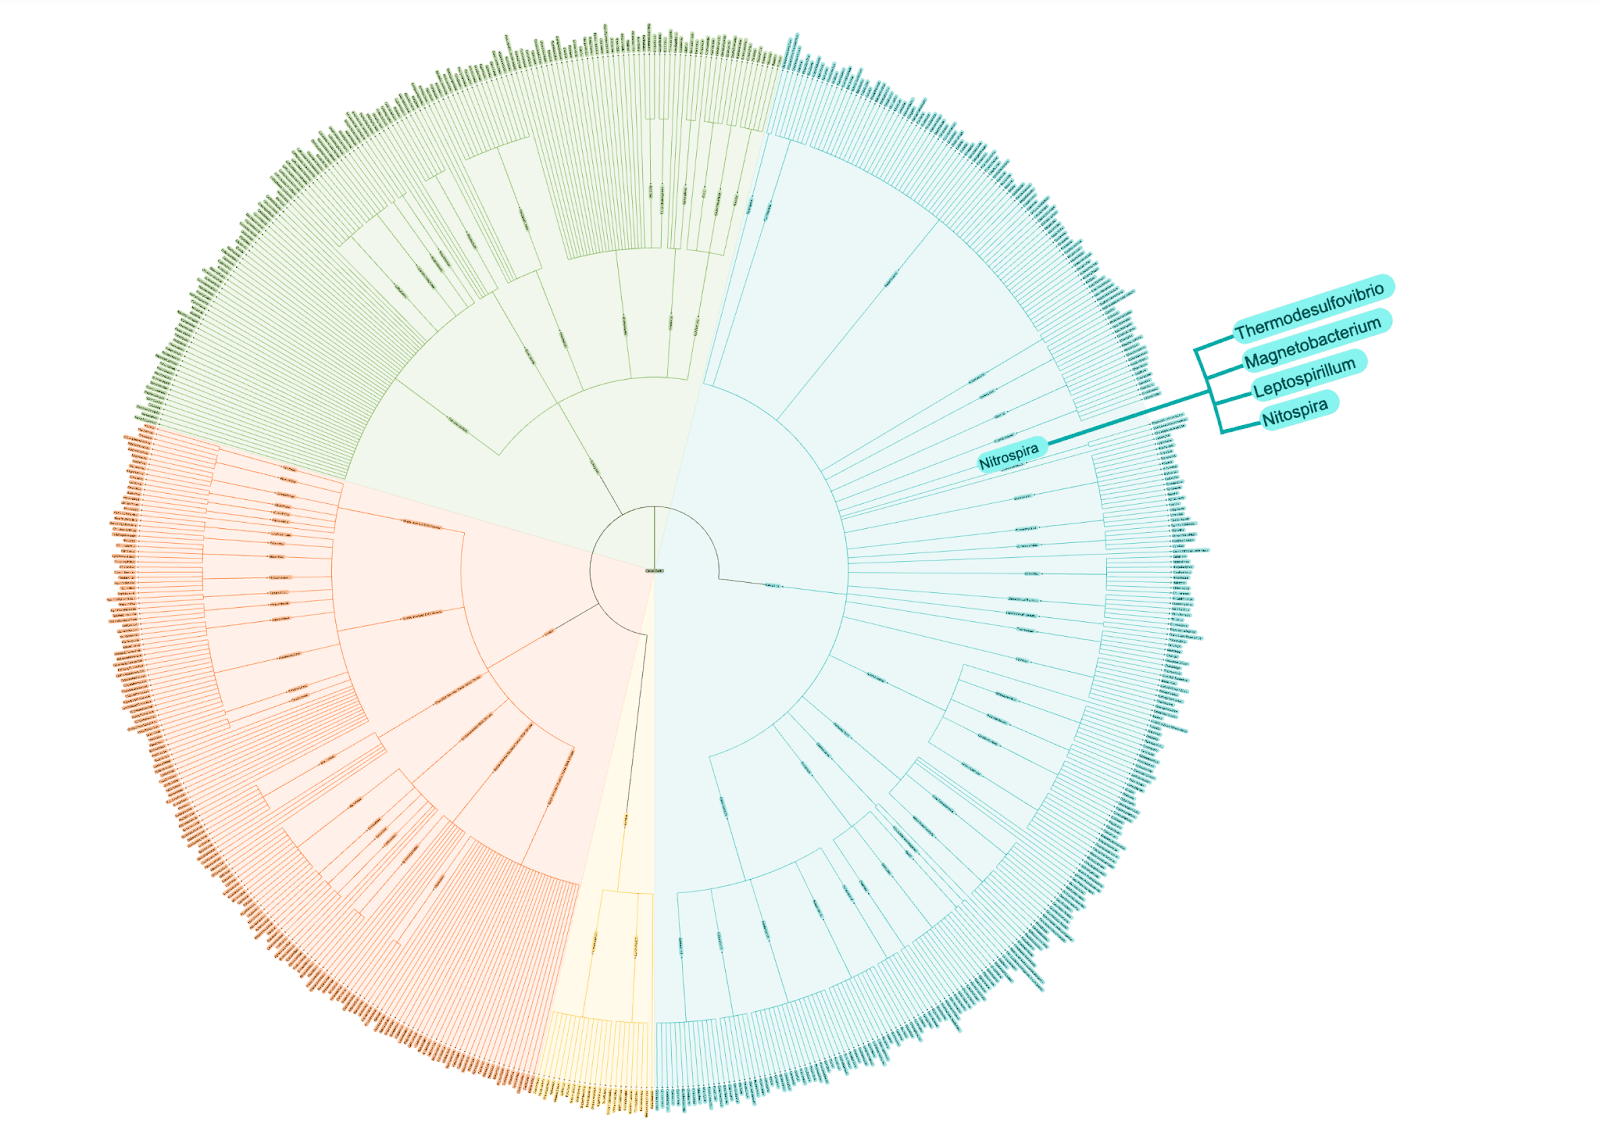
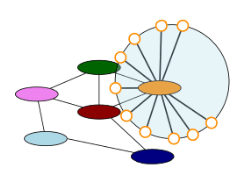
4. Abstract lens – pick your shape and style – simply enlarges part of a graph. Shown here with our tree of life demo.
5. X-ray lens gives insight into group nodes, offering different levels of detail for hover and click. Ideal for complex networks, supply chains, and other business processes.
6. Substructure lens lets you preview (and potentially interact with) substructures of large graphs.
Preserving the mental map
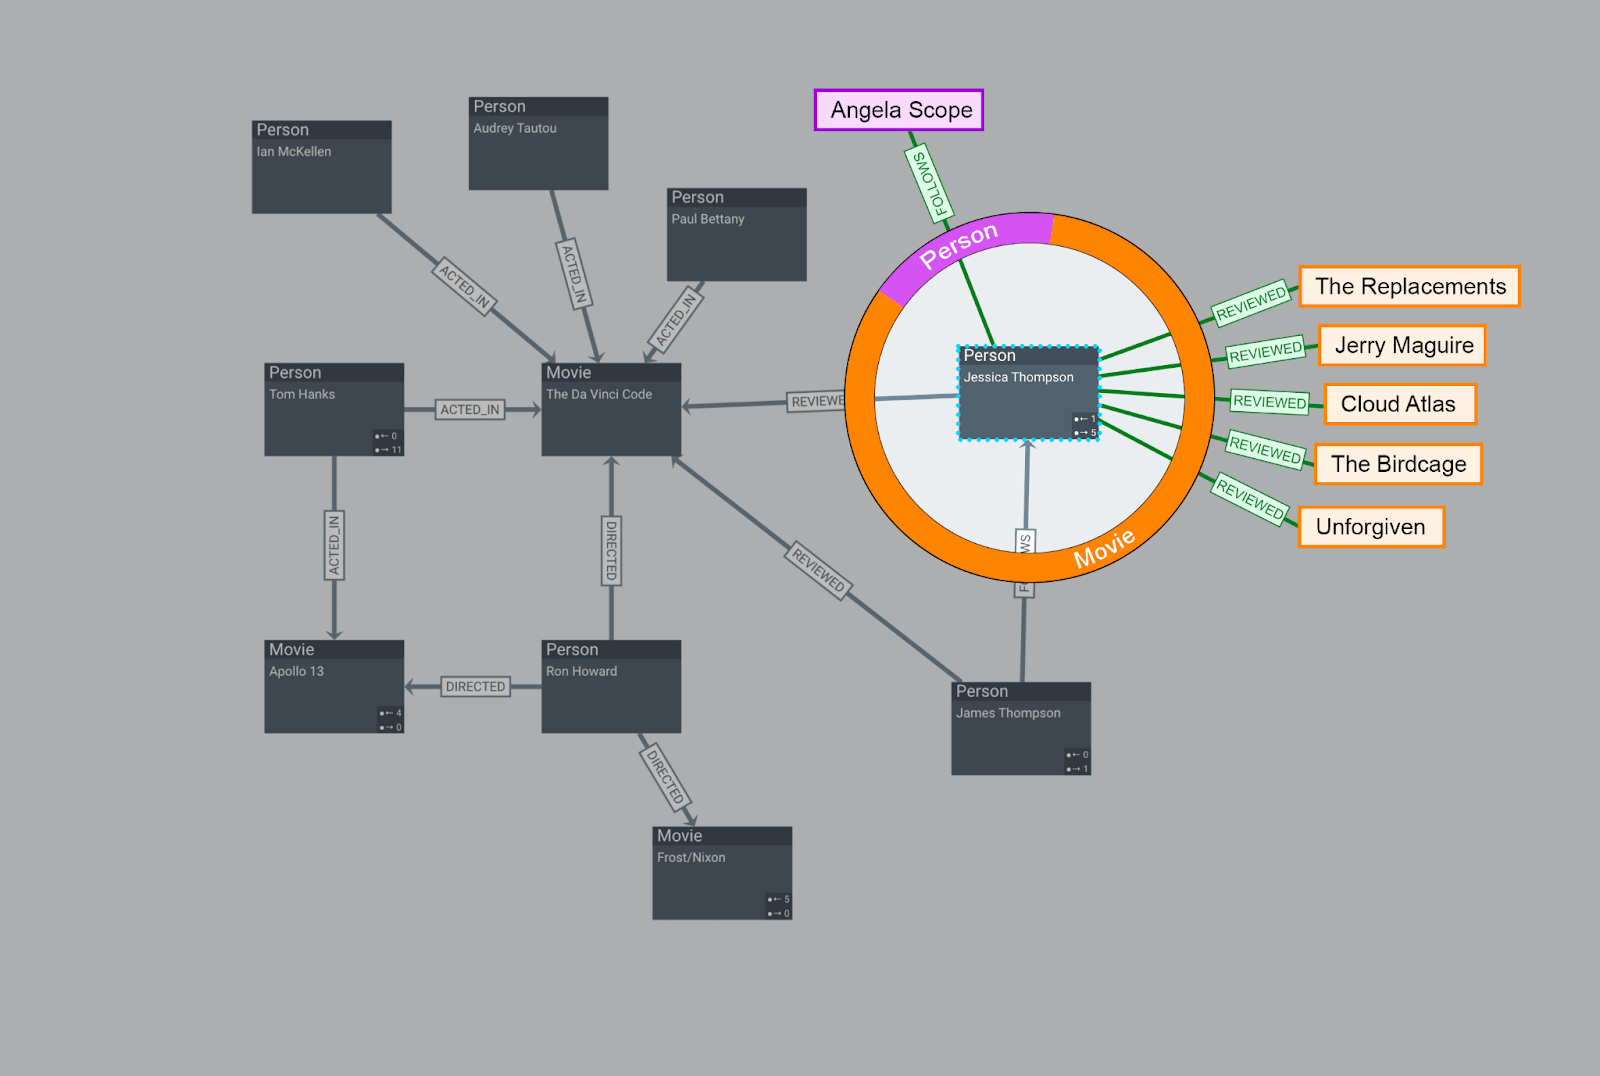
Based on these use cases, we developed an alternative approach to graph exploration that reduces the number of zooming operations. Using the metaphor of a magnifying glass, the user can easily apply our tool to enlarge the level of detail in a small focus region – while preserving the visual context of the surroundings. The tool's core is an interactive lens that can be moved around by the user and represents the desired focus region. Simply put, the interactive lens is a ring that shows the distribution of nodes within it.
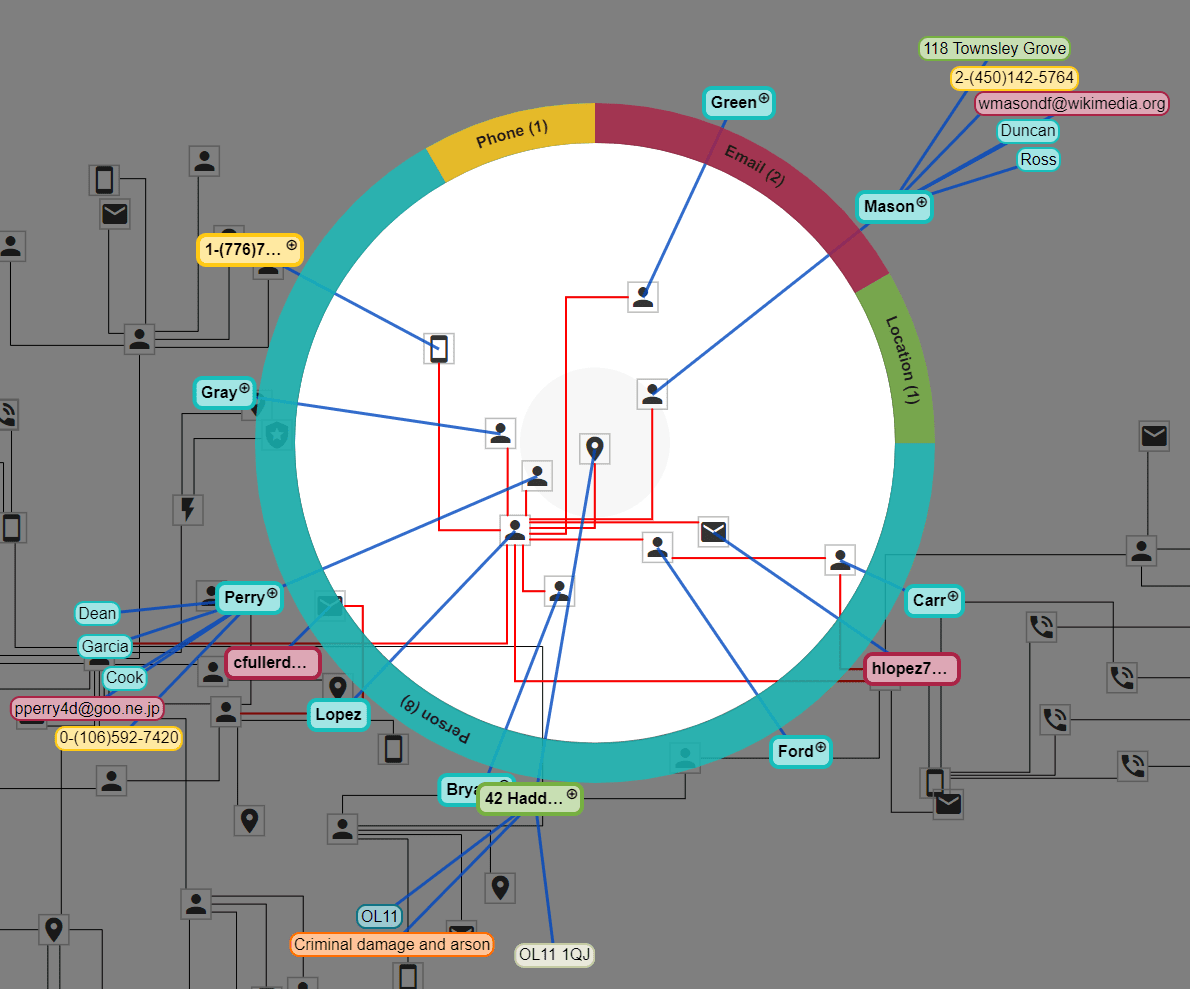
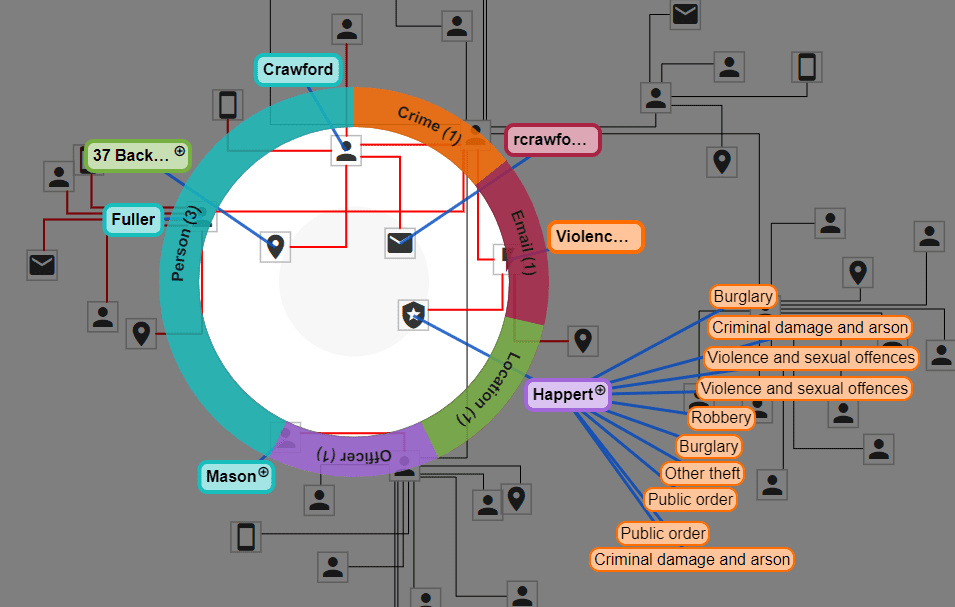
In our example of criminal cases, the ring shows 4 sections, each representing one type of node. So the user easily sees that there are 8 nodes representing people, 1 node representing a phone, and so on. What’s more, the tool annotates each of these nodes with additional information placed in the surroundings of the interactive lens. The most important types of information – such as suspect name or crime type – is placed around the ring using simple labels. Further information, such as relationships to neighboring nodes, is placed in the far reaches of the lens. We used thin connecting lines to establish clear visual links between nodes and labels while maintaining good legibility of the focus region.
Test and experience yFiles free of charge!

- Free support
- Fully functional
- 100+ source-code examples
Drag, stop, and dive deep
When the user drags the lens around, additional information is reduced to a minimum: Only the ring, and the labels placed directly at the ring, are displayed. This allows the user to easily decide when to stop moving the lens based on the selected information. And label colors are based on node type, making it even easier to explore on the fly.
As soon as the lens stops moving, the collapsed information is rearranged around the lens again. Now the interactive lens offers the user more interactions. In the example of criminal cases, only a part of the graph is shown at the beginning. By clicking one of the labels, the user can decide to explore the neighborhood of the corresponding node. The underlying layout of the graph is expanded by the neighbors of the nodes, and the lens is centered on the expanded node. This lets the user explore the graph intuitively by unfolding the layout step by step.
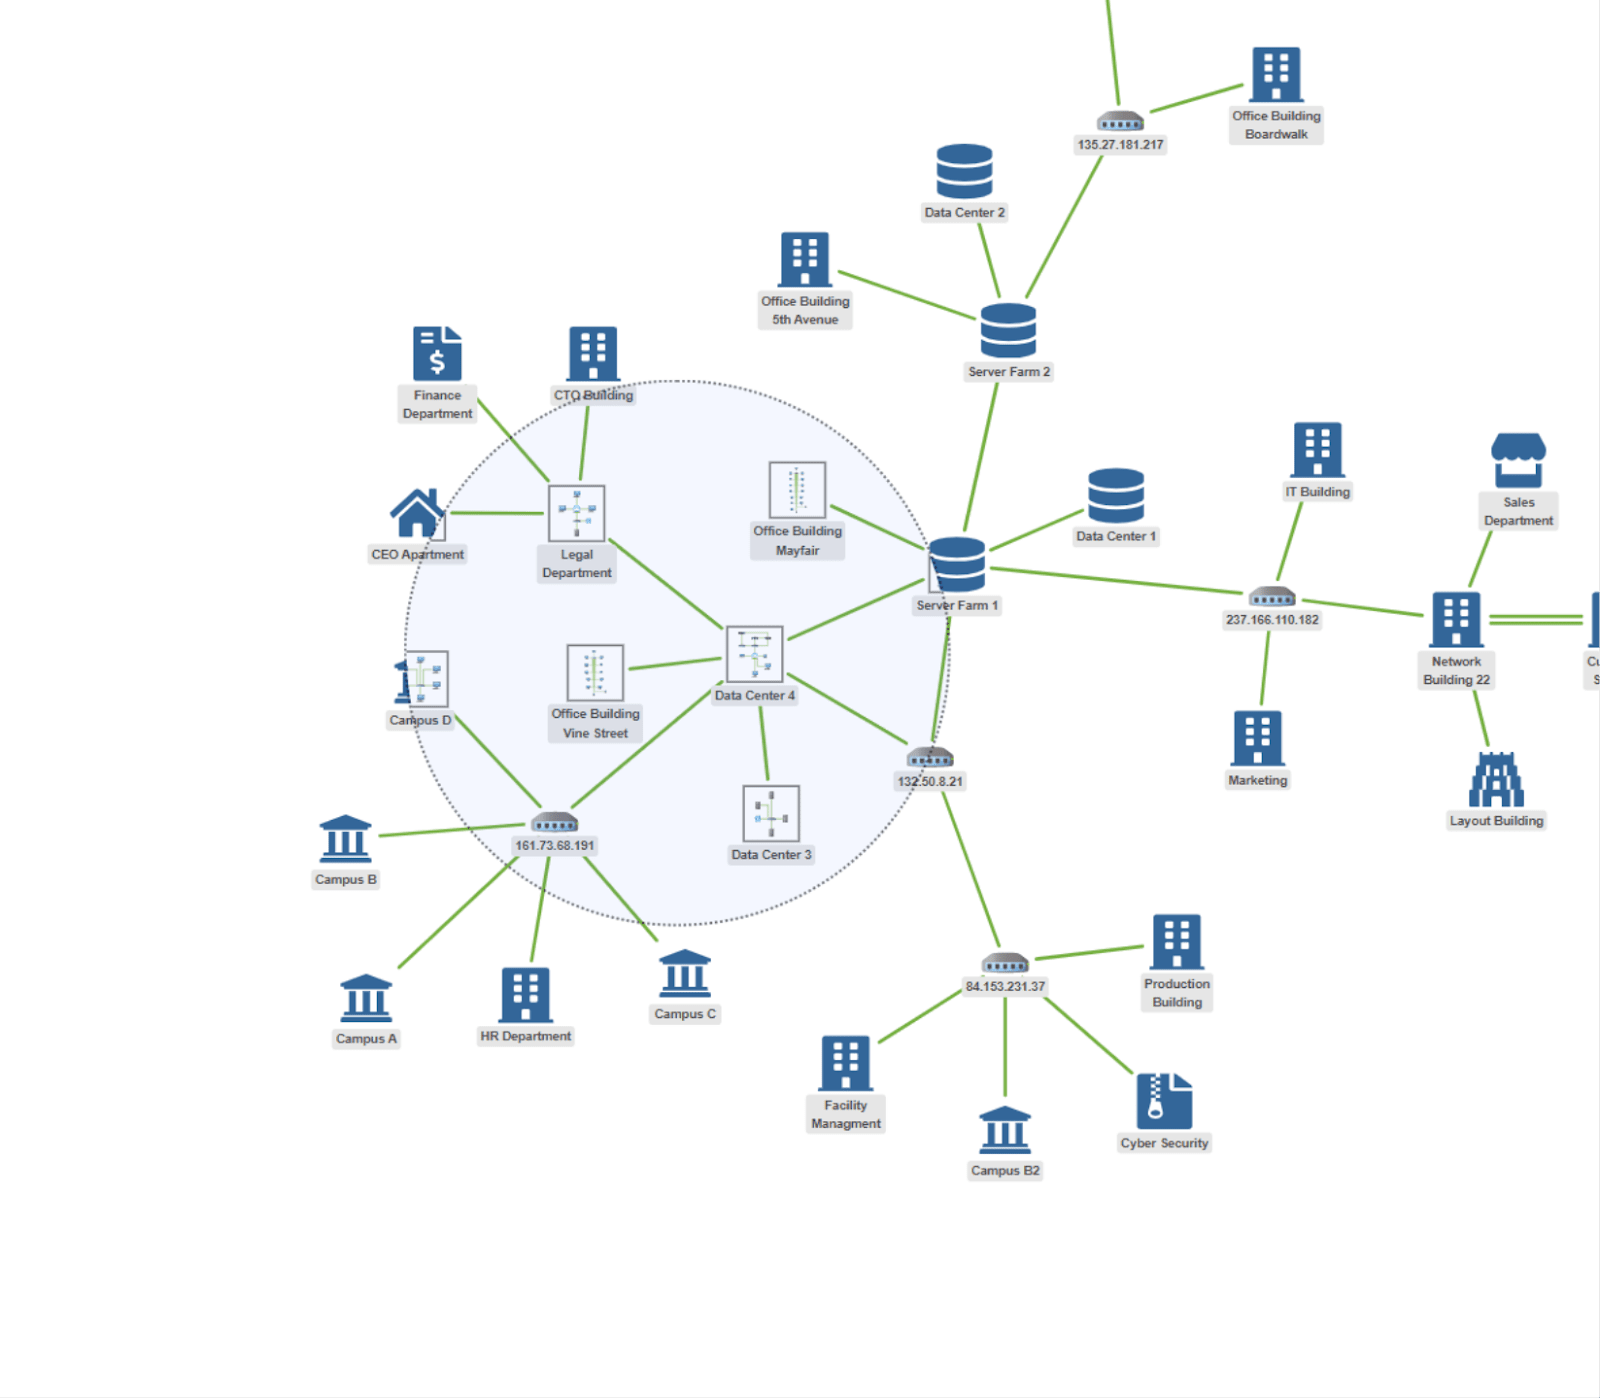
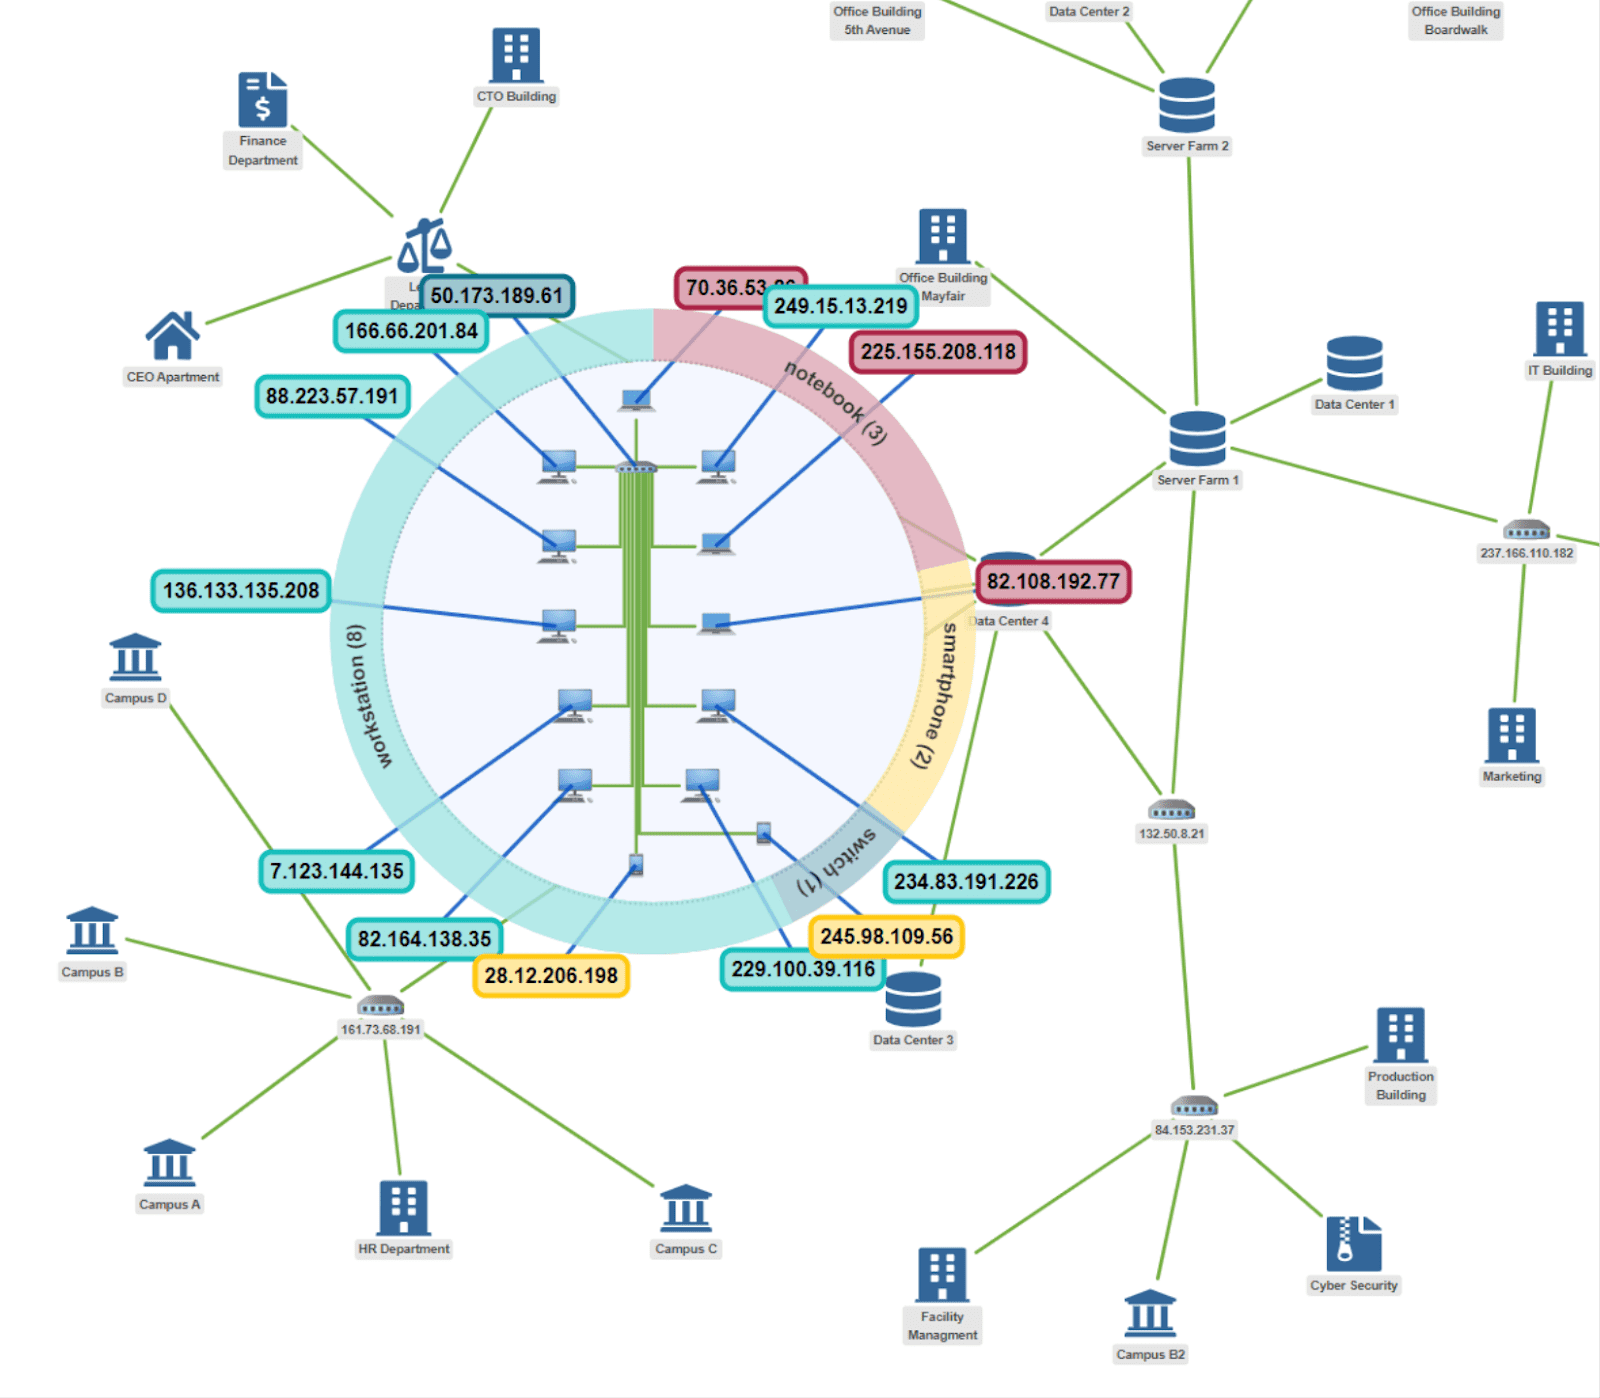
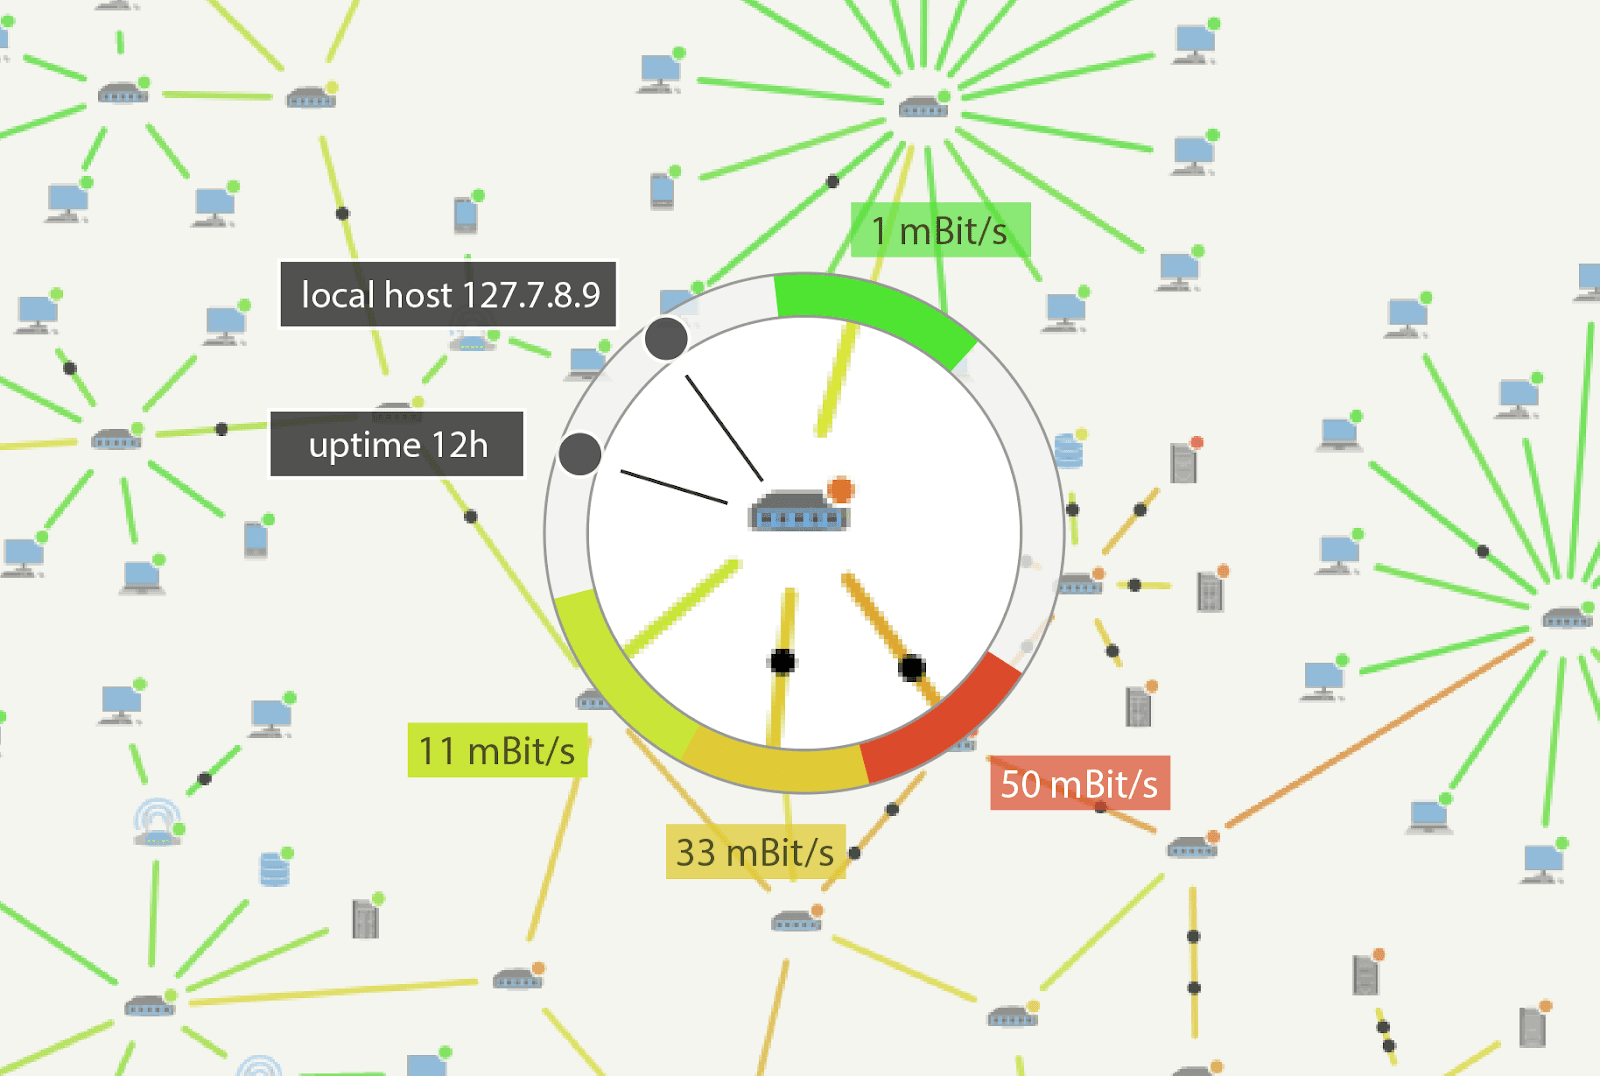
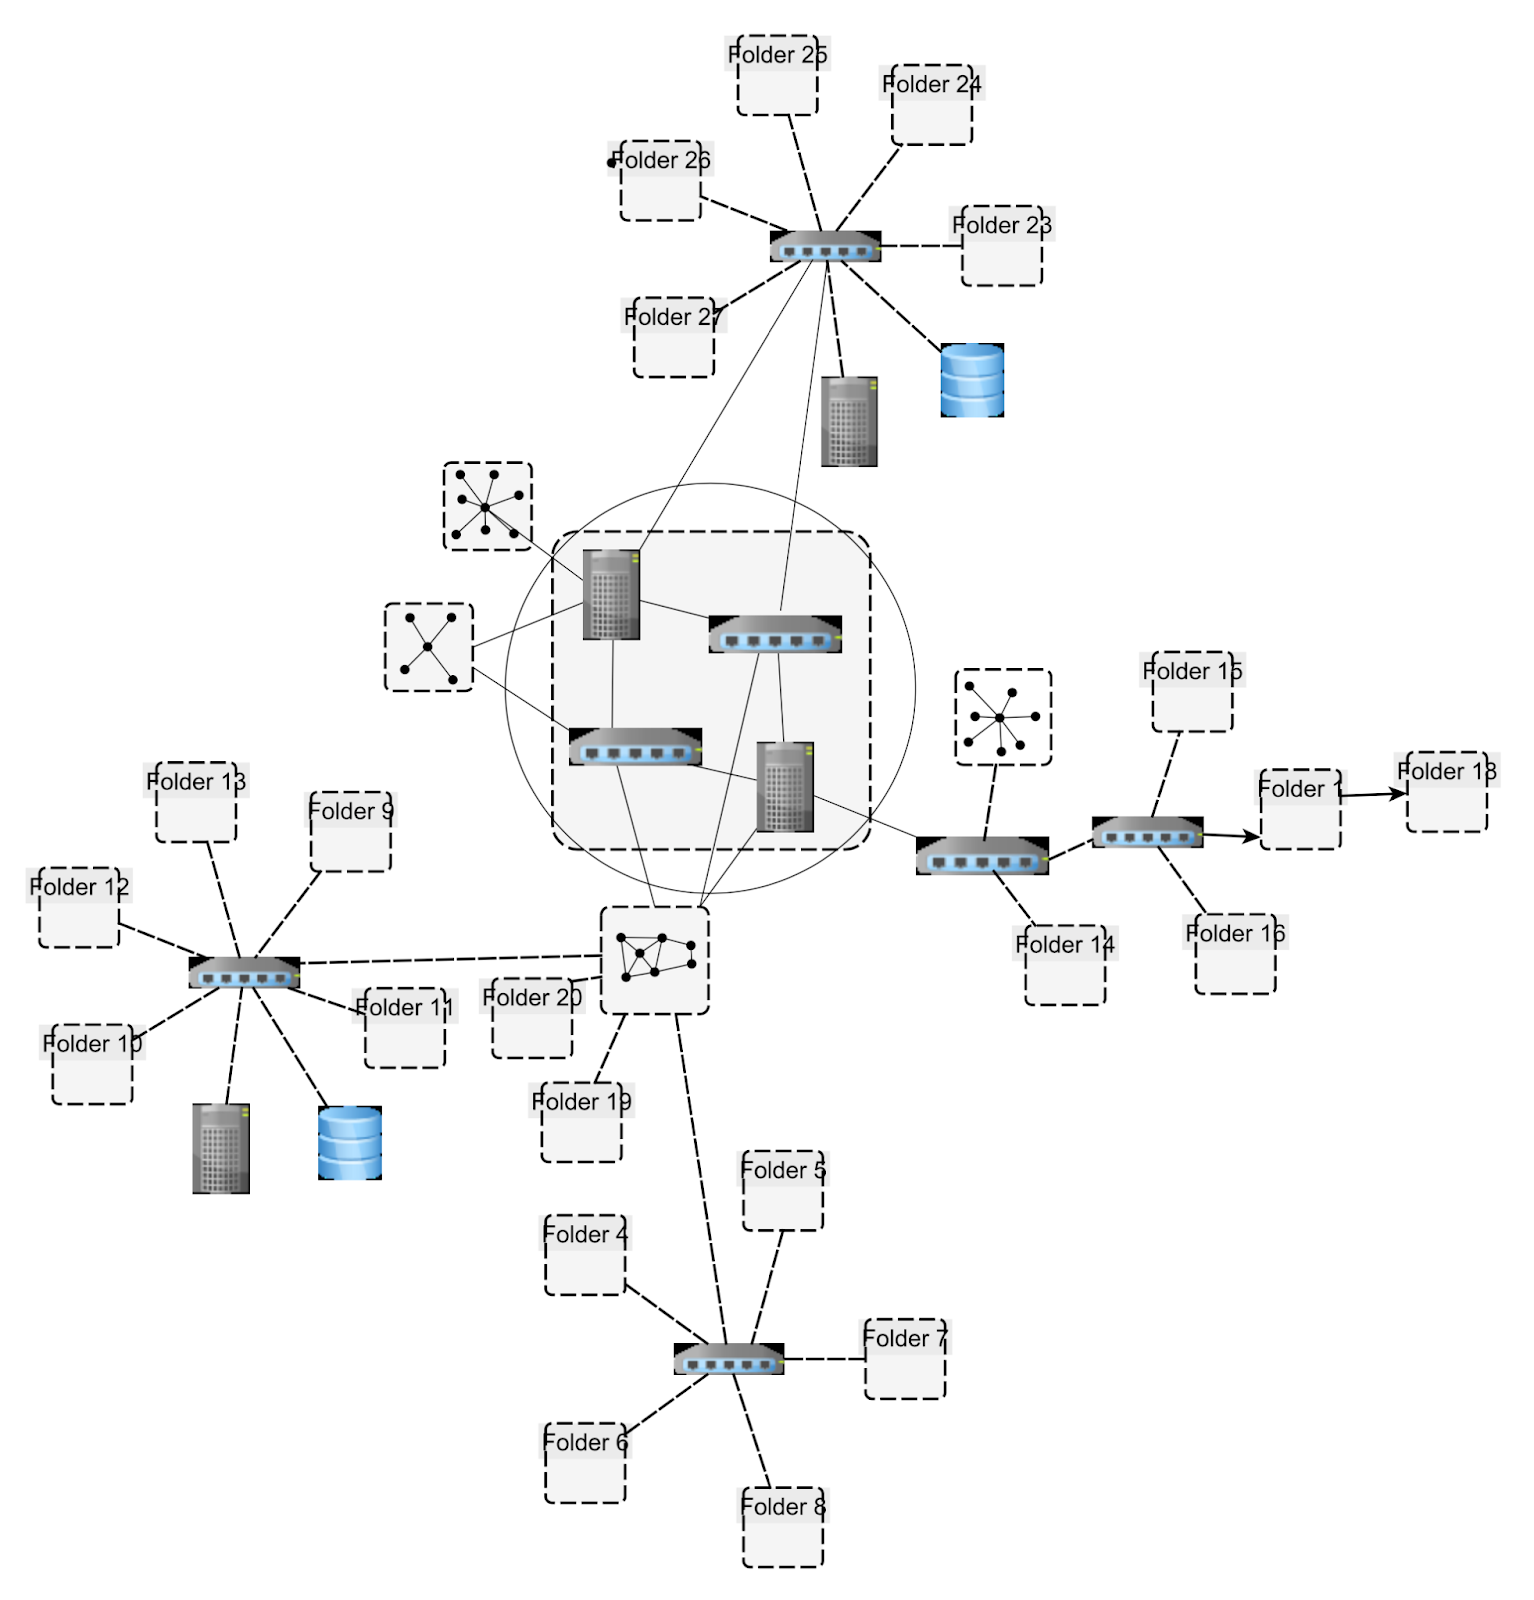
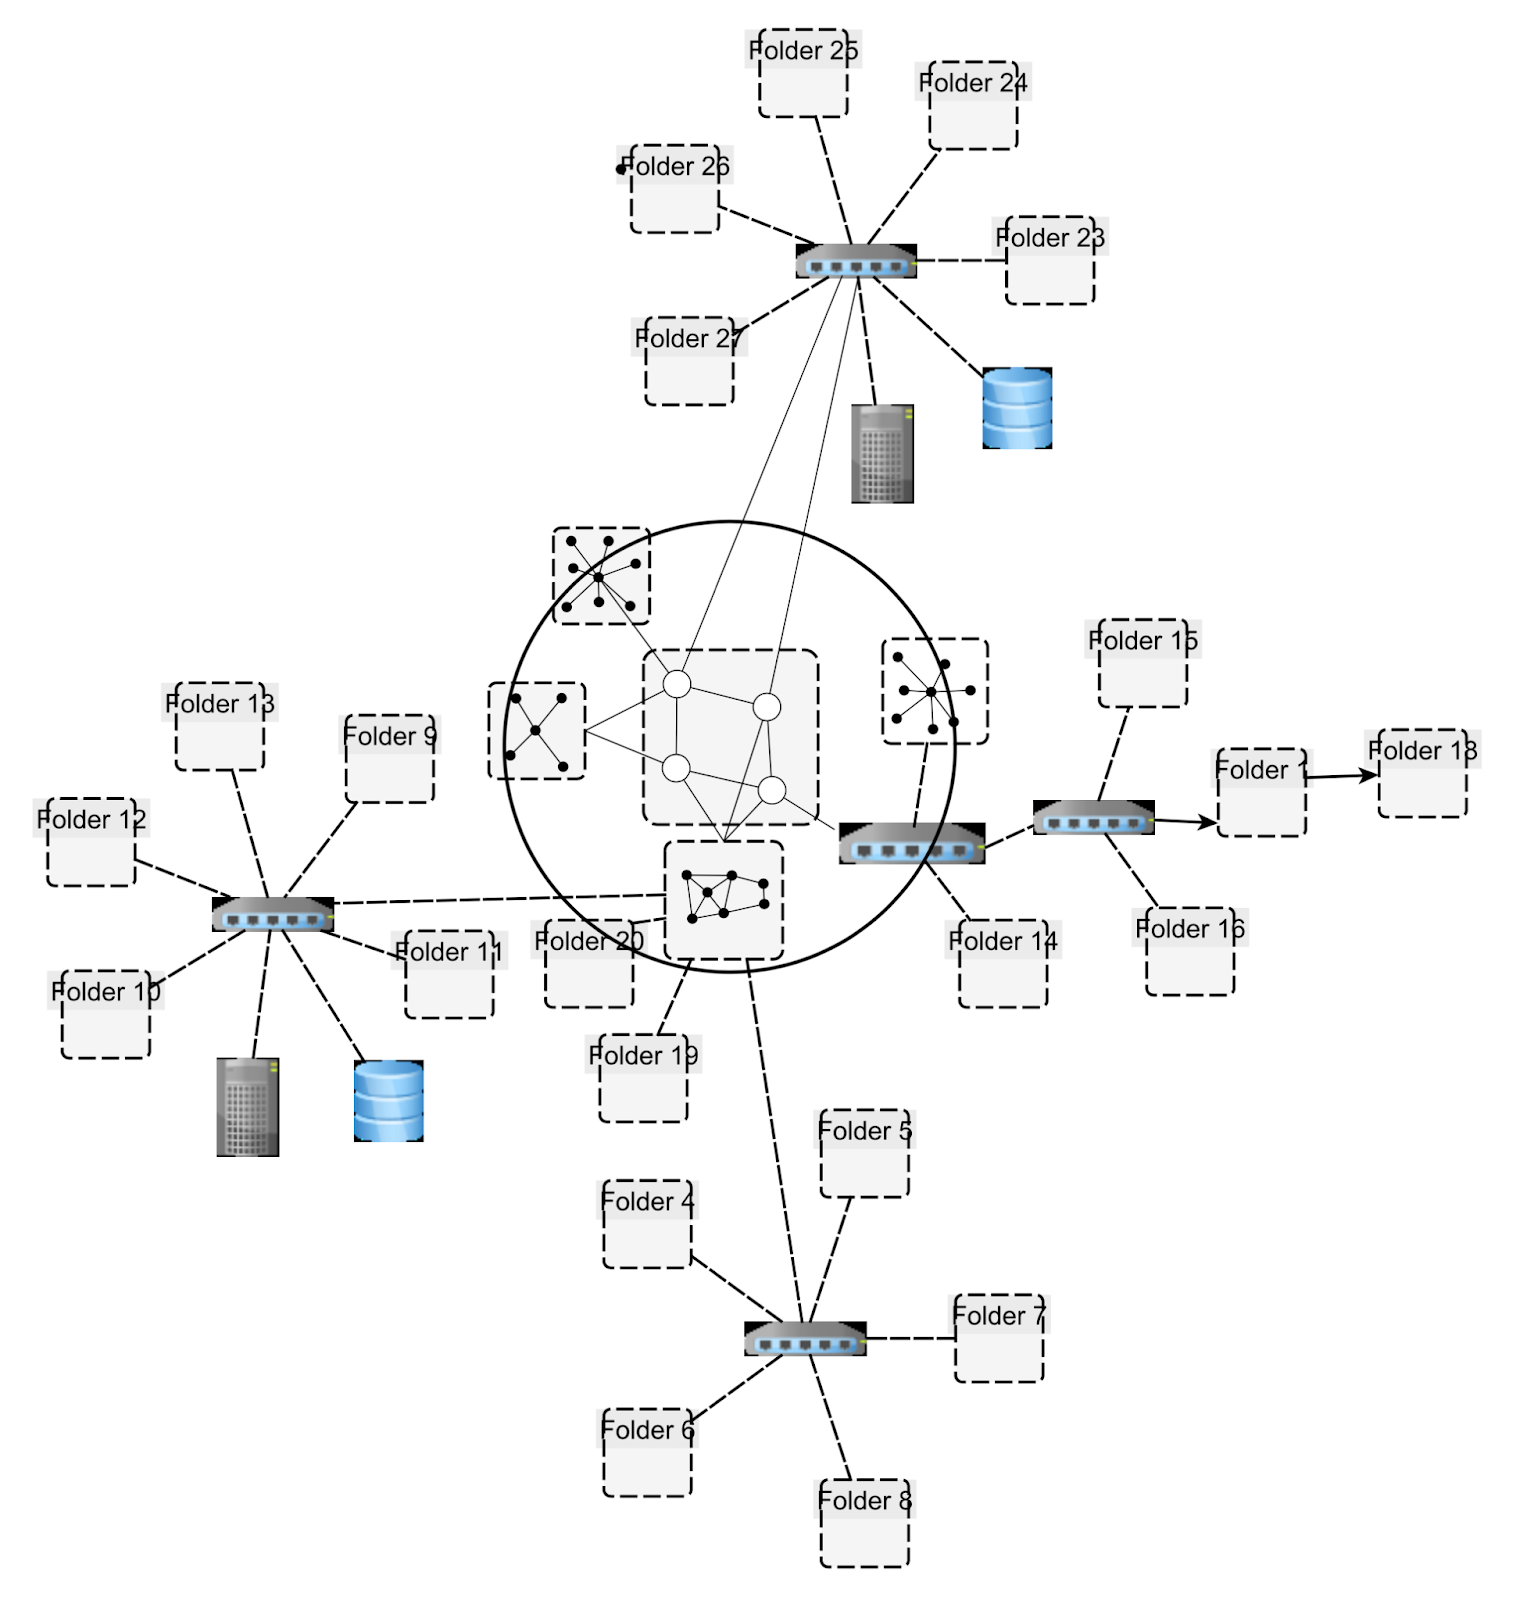
Figure 2.: A computer network that is grouped by departments. Left: Moving the lens onto the nodes shows the sub-networks of the departments. Right: Once the lens stops, the subnetwork of the most central node is enlarged, and additional information such as the IP addresses of the devices are shown.
Get X-ray vision
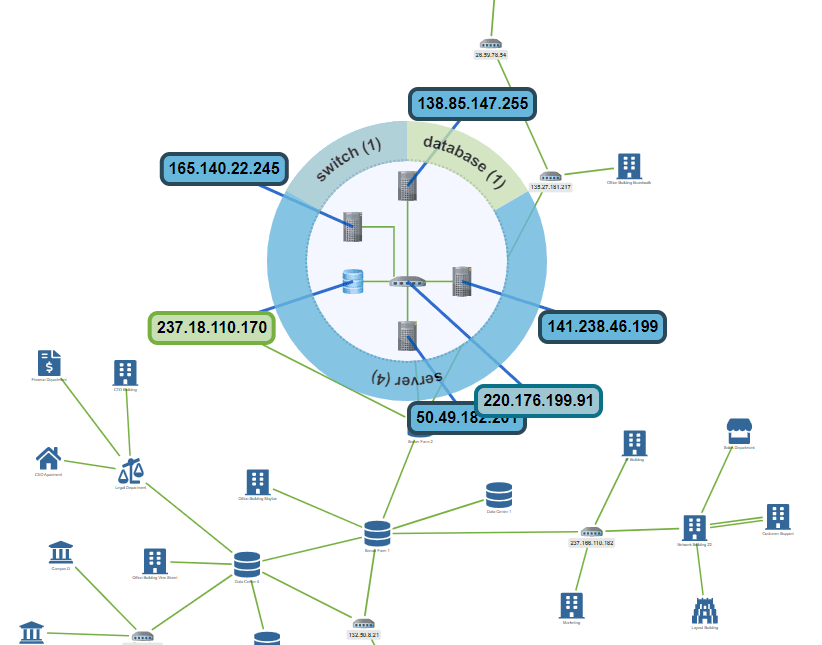
In addition to showing labels around the lens, our tool also provides previews of the underlying graph structure. Figure 2 shows a graph layout of a computer network. Except for the “router” nodes, each node represents a department. Because the sub-networks of each department would clutter the graph layout, they are not displayed in the initial visualization. However, when moving the lens onto the nodes, the user can see the sub-networks as if the lens were an X-ray showing the department interiors. Once the lens stops, the most central node is enlarged showing its sub-networks in full detail. The tool moves the rest of the graph outwards to create visual space for this central node. This technique both reduces the overall amount of information and allows the user to intuitively explore the graph layout without zooming too much.
Three Example Applications for the Wonderlens
We deployed the lens tool for three examples demonstrating its broad range of applications. Each of these examples can also be tried out in a live demo.
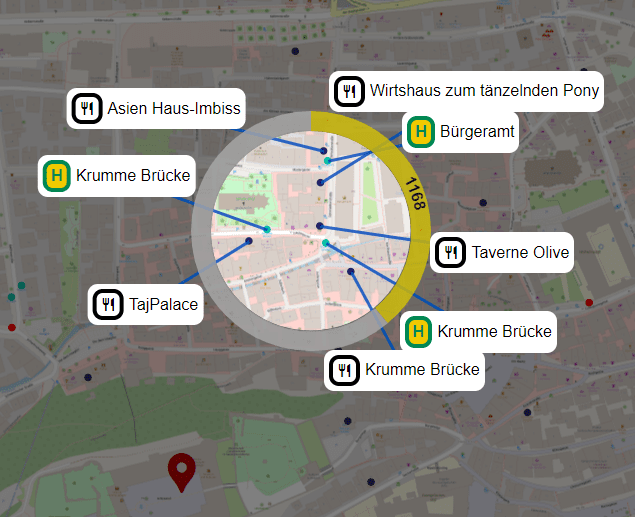
On the other hand, too much information easily clutters the map and overwhelms the user. Our lens tackles this problem by annotating points of interest with additional information only in a small sub-region of the map. As the labels are placed outside of the lens, it is guaranteed that the map remains legible within the lens. We further use the outer ring of the lens, presenting additional details. In our example, the outer ring displays the walking distance between the user’s location and the points of interest, which helps the user to assess the search results.
Implementation
For the implementation, we distinguish two states of the lens. When the user drags the lens around, the lens is in the overview state. In this state we aim at simple visualizations that can be easily perceived by the user. In the second state, which we call the detail state, the user has stopped dragging the lens around, and more detailed information on the content of the lens is shown.
Have a look at the layout demos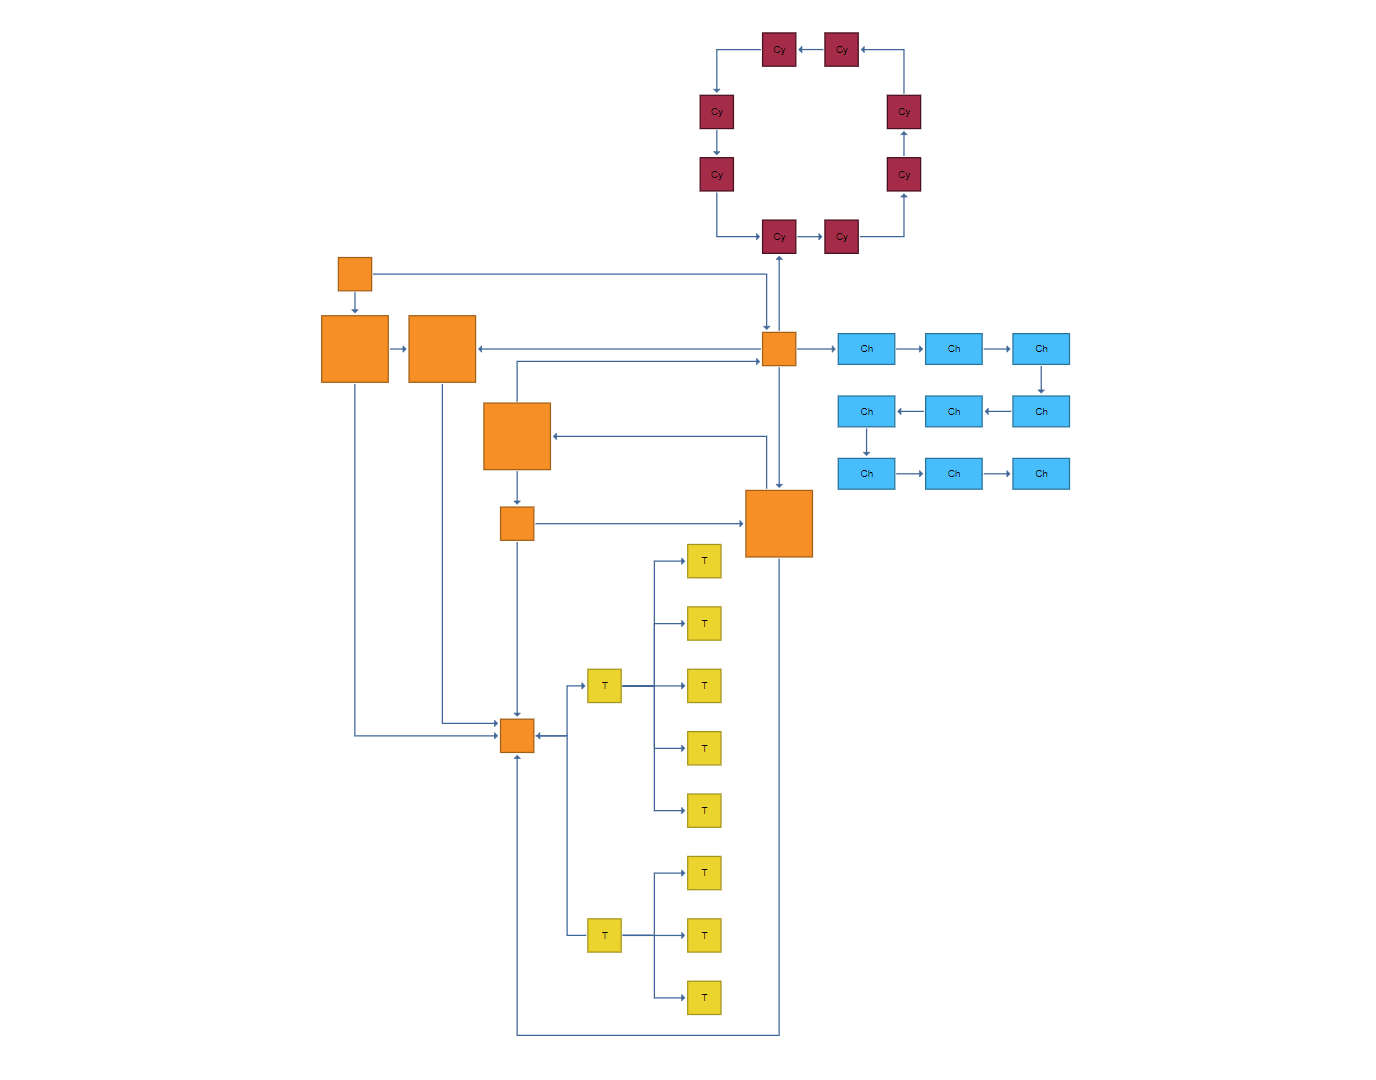
Conceptually, in both states, the implementation needs to handle three visualization components:
- The ring presenting information on the boundary of the lens.
- The display of substructures in its interior.
- The placement of labels in its exterior.
The label placement is as follows. In the overview state, the labels are placed radially around the lens, i.e., the center points of the nodes contained in the lens are radially projected on the boundary of the lens. These projected points are the anchor points of the labels. In the detail state, overlaps between labels are resolved using a force-based method. This approach moves the labels as little as possible. We apply the very same technique, also for the labels that we display far outside of the lens, presenting even more details on the content of the lens.
Finally, we remark that we create the graph layout incrementally for the example of exploring the graph based on criminal cases. Every time the user expands the neighborhood of a node, we query a Neo4j database, obtaining the neighbors of the node. We then apply the organic layout on the graph maintaining the existing layout as well as possible. To that end, we set the scope of the layout to MAINLY_SUBSET_GEOMETRIC. Moreover, we use an edge router creating wiring the edges orthogonally. Apart from these two simple changes, we apply the default settings of the organic layout.
Start exploring here! 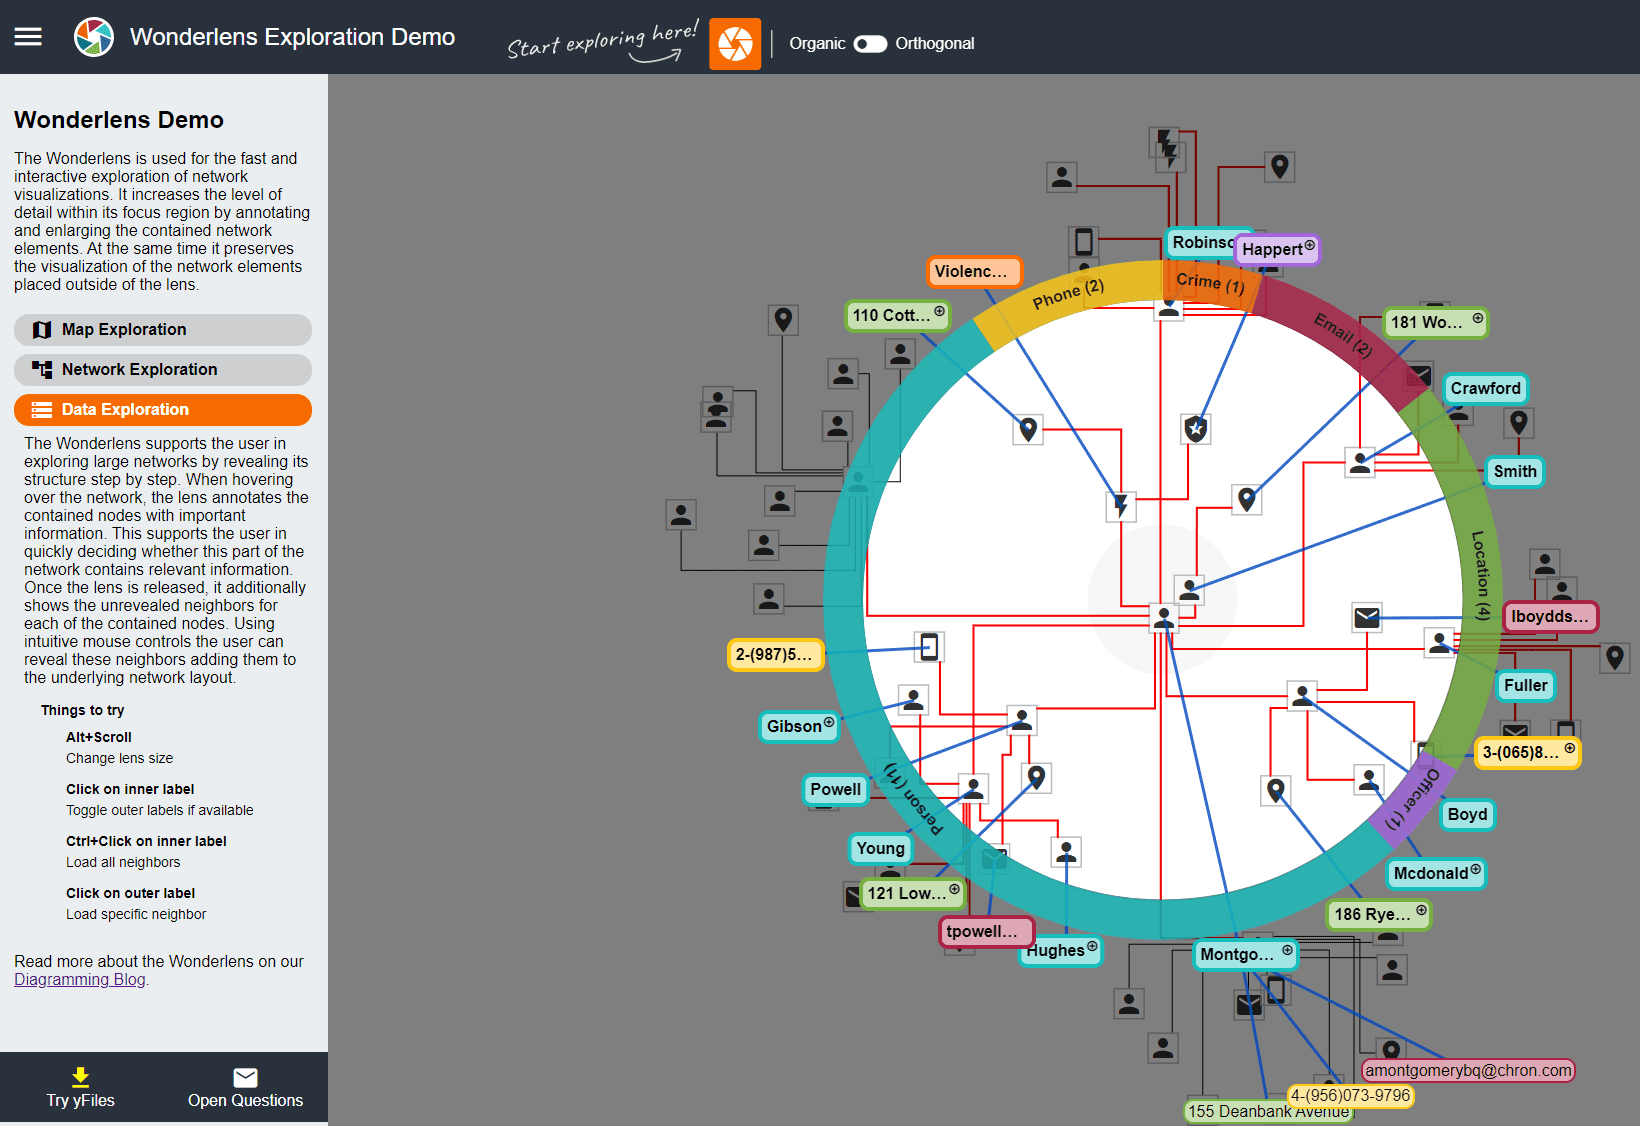
What do you think? Is this something we should include as an algorithm in yFiles? Let us know: Leave us a message on Twitter or LinkedIn , or use our contact form.
The complete algorithm we implemented here is not currently part of the yFiles library. If you are interested in using the algorithm for your own diagrams, get in touch with us!