How to keep Big Data from becoming a big hassle
DbVis Software AB and yFiles: a perfect match for over 20 years
All vertical and horizontal markets and segments rely on databases, and their use is increasing rapidly. But combing through large collections of plain sheets is inefficient. There is a much better approach: visualizing databases as graphs! This makes it easy to work with schemas, highlight connections between data elements, and quickly get a clear overview — tasks that are nearly impossible using spreadsheets alone.
Needs & objectives
Needs analysis
- Visualization of database schemas
- Data navigation
- Orthogonal layout style
Objectives
- One-click view of table relationships
- User-friendly and visually appealing graphs
A universal tool
Since 1999, the Swedish company DbVis Software AB has been helping developers, database administrators, and analysts visualize data with a powerful Java application: DbVisualizer. The software is available for all major operating systems, connects to most databases, and offers the same outstanding experience across all supported platforms. Users can edit data elements and use on-screen manipulations to generate SQL queries, and easily navigate the database. Even very large, heterogeneous databases with complex structures can be analyzed with little effort.
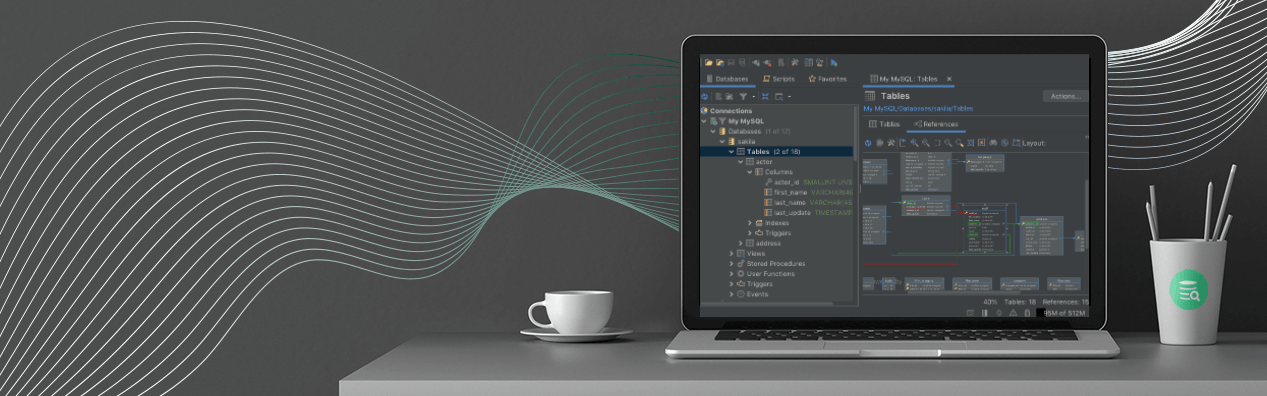
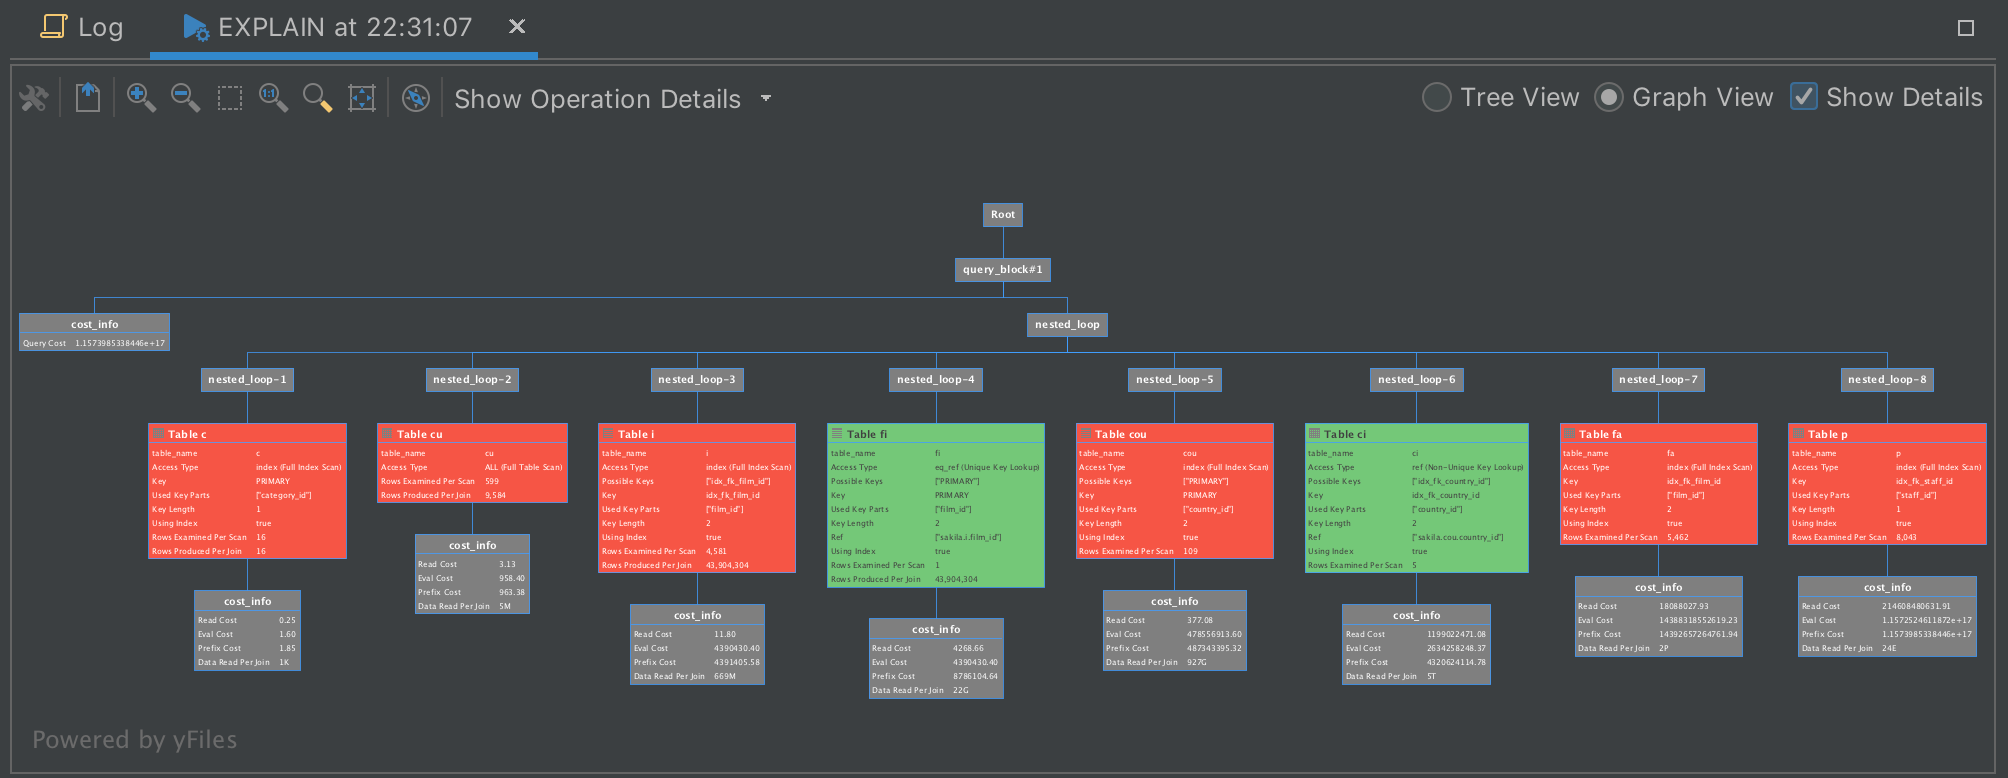
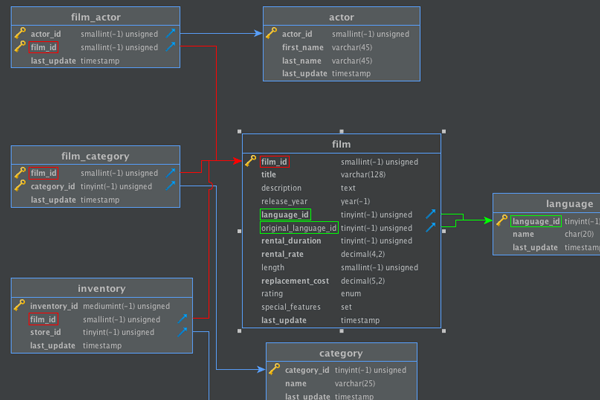 DbVisualizer shows the relationships between database tables with a single click
Working with schemas
“In early 2000, we evaluated alternatives to our very basic graphing toolkit and discovered yFiles for Java,” Roger Bjärevall, Founder and CTO of DbVis Software, recalls. “We fell in love with yFiles very quickly, just by browsing the yFiles documentation and trying various demos. We were stunned by the way yFiles beautifully animates the graphs, the optimized rendering — and the well-designed API.” To reduce the time spent coding, DbVis Software implemented the yFiles diagramming SDK. This library includes algorithms for a perfectly aligned orthogonal layout, ideal for depicting database schemas. With one click, users see how tables in a database relate to one another — essential for efficient design, reviews, and documentation. “Graphs are powerful in many respects,” Bjärevall continues. “We use them to map primary keys to foreign keys, and to generate query optimizer plans, using the schema or single tables as input.” If any tables are added or deleted, yFiles syncs the schema graphs, so visualizations are always clear and up to date.
 Need to get a handle on large data volumes? Visualizing the schema, or database structure, is a great start.
Cross-platform development? No problem!
Why visualize?
We use graphs to render primary/foreign key mappings, navigate by data, and generate query optimizer plans.Roger Bjärevall
yFiles is a library for visualizing and arranging structured data, so it’s a perfect fit for displaying information in a relational database. yFiles offers visualization components for both of the major Java UI frameworks — Swing and JavaFX — and refines them continuously. The layout algorithms, on the other hand, are independent of the chosen UI framework. They can be implemented out-of-the-box, or customized to fit specific user needs. In addition to Java, the yFiles library is available for JavaScript/HTML5, Windows Presentation Foundation, and .NET Forms. While the tech specs of these platforms demand slightly differing approaches to visualization, the APIs and features are essentially identical in all yFiles products. This lets developers transfer their yFiles know-how from one project to another — even when developing for different platforms.
Great programming interface, stellar support
As the partnership between DbVis Software and yWorks enters its third decade, Roger Bjärevall looks back: “The day we started using yFiles, we said, ‘These guys know what they’re doing! This is what a really well-designed API should look like.’ The stability and quality have been top-notch ever since. And everyone at yWorks, from CTO to support staff, is very helpful and responsive.” High praise, indeed — and extra motivation for the coming decades. Here’s to our next 20 years!
 yFiles is tremendously flexible, allowing us to create the exact experience that our customers desired.Roger Bjärevall, CTO, DbVis Software AB
Who’s who in yFiles layouts
- Looks like: A wiring diagram
- Superpower: Precisely depicting structures+
- Looks like: A family tree
- Superpower: Clearly showing dependencies
- Looks like: A living organism
- Superpower: Emphasizing natural clusters
Further info: yFiles webinars & demos
Superior quality since 1999
DbVis Software AB is a small team of passionate people based in Stockholm, Sweden. To date, over 4.5 million users have downloaded the DbVisualizer application. More than 22,500 companies in over 135 countries have purchased the Pro version. The company’s vision from day one: “High-quality software to make life easier and more effective for anyone who uses it.” https://dbvis.com