
Gallery
Below is a compilation of carefully selected visuals we've created over the years. Most highlight the capabilities of our yFiles libraries, while some are included simply because we love them!
Enjoy!
Check out some inspiring applications and demos that show the advanced layouting feature in real-time, on the demos page.
Automatic Layout of Networks and Diagrams
The yFiles libraries embody many advantages, including their ability to automatically draw networks and diagrams. yFiles layout algorithms enable you to create clear, robust and dynamic Flow Charts, UML Diagrams, Organization Charts, Sankey Diagrams, Family Trees, Business Process Diagrams, etc.
Below are some of the many layout styles offered by yFiles.


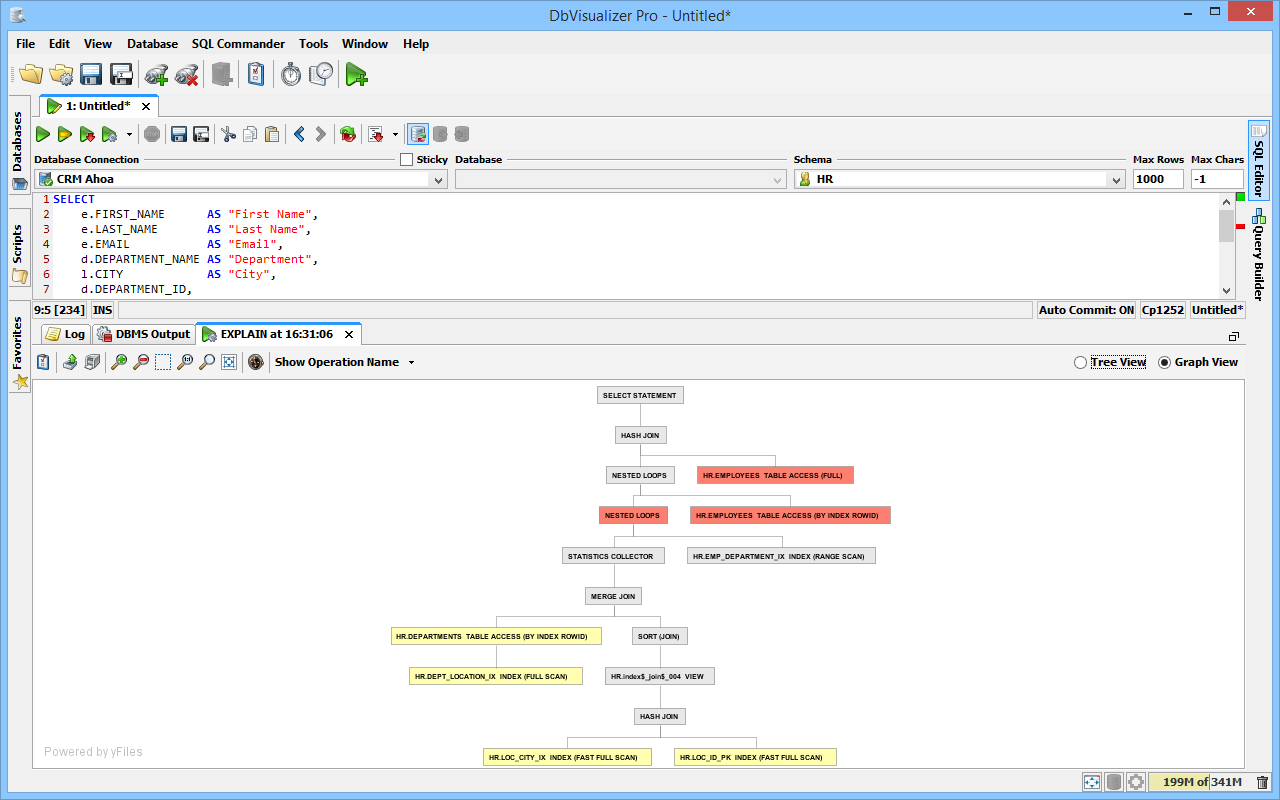
Emphasizes the direction of the main flow in diagrams and networks and also identifies hierarchy levels and dependencies.
Supports orthogonal drawings and grouped diagrams.
Ideally suited for biochemical pathways, dependency analysis, workflow diagrams, flow charts, business process modeling, or UML diagrams.


Emphasizes data-inherent groupings and symmetries and provides insight into the interconnectedness of large and complex structures.
Supports grouped diagrams.
Ideally suited for semantic networks, biochemical reaction networks, or computer network structures.


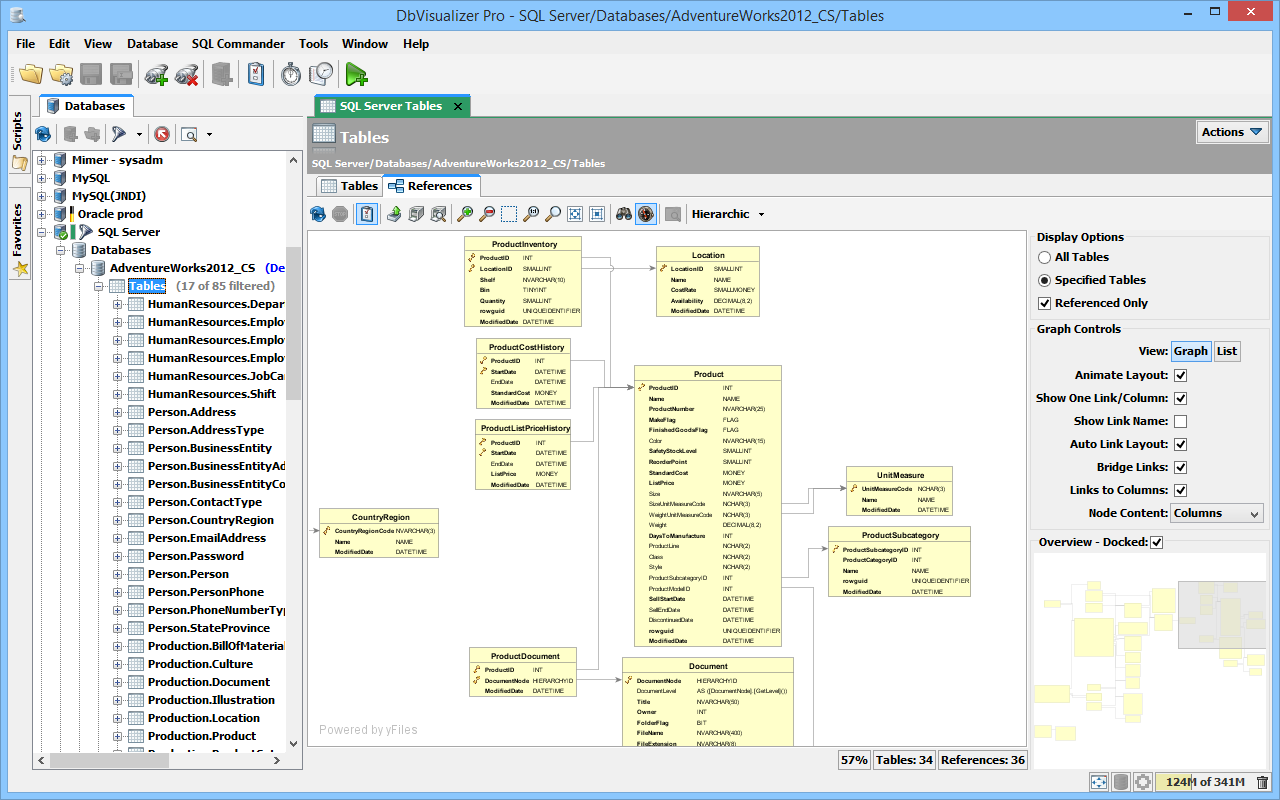
Produces clear diagrams featuring orthogonal connections exclusively, with connections routed to minimize crossings and bends.
Supports grouped diagrams and exclusive routing of connections.
Ideally suited for database modeling, software engineering, or UML diagrams.


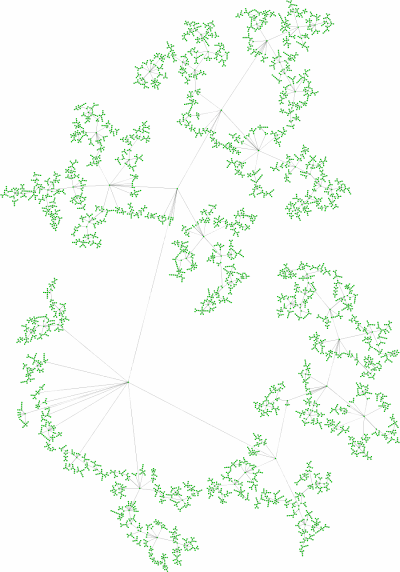
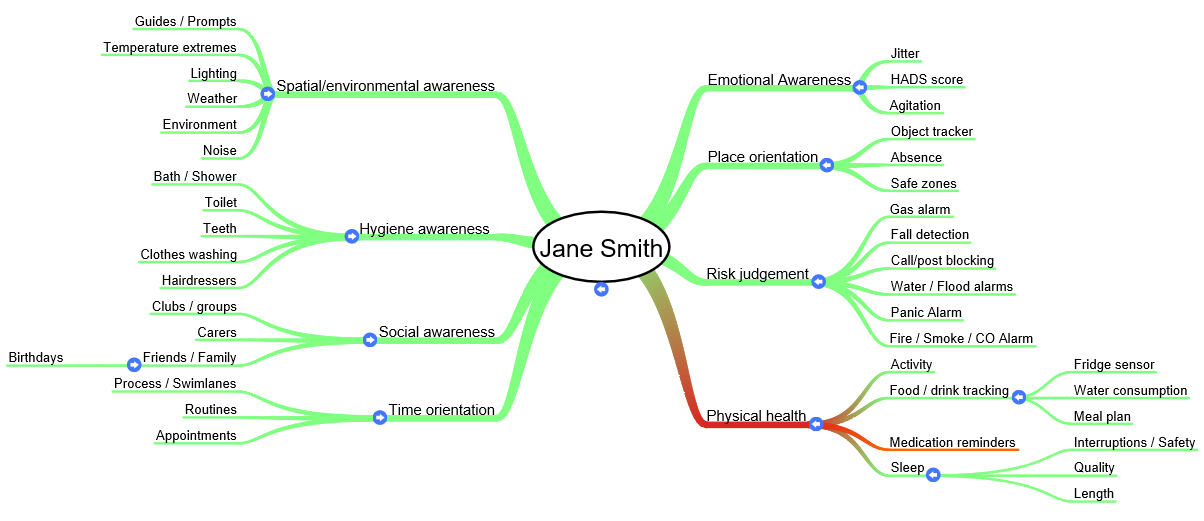
Optimally arranges tree-like structures.
Offers directed as well as radial styles and supports compact arrangements.
Ideally suited for genealogies, directories, mind-mapping, or organization charts.


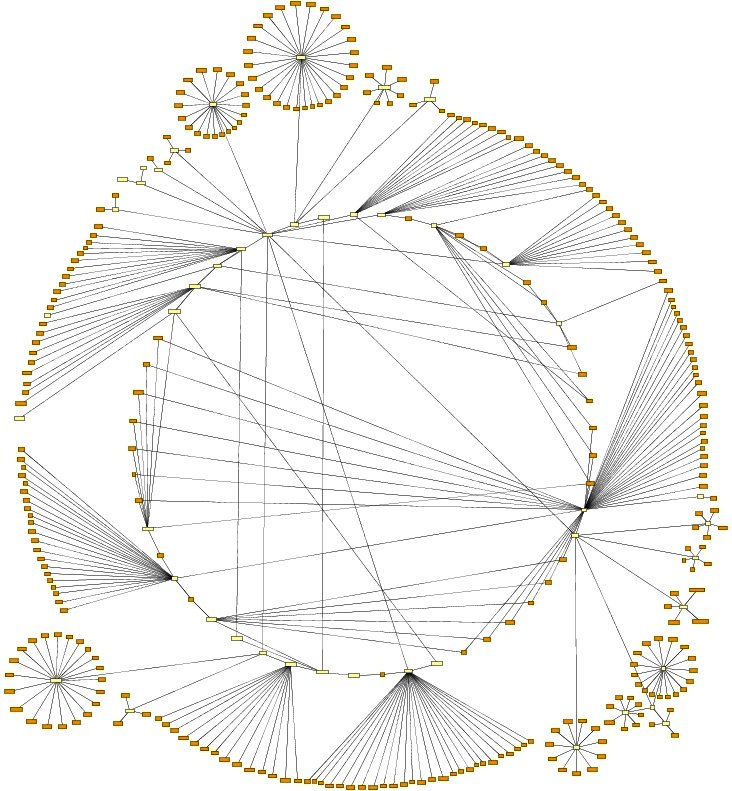
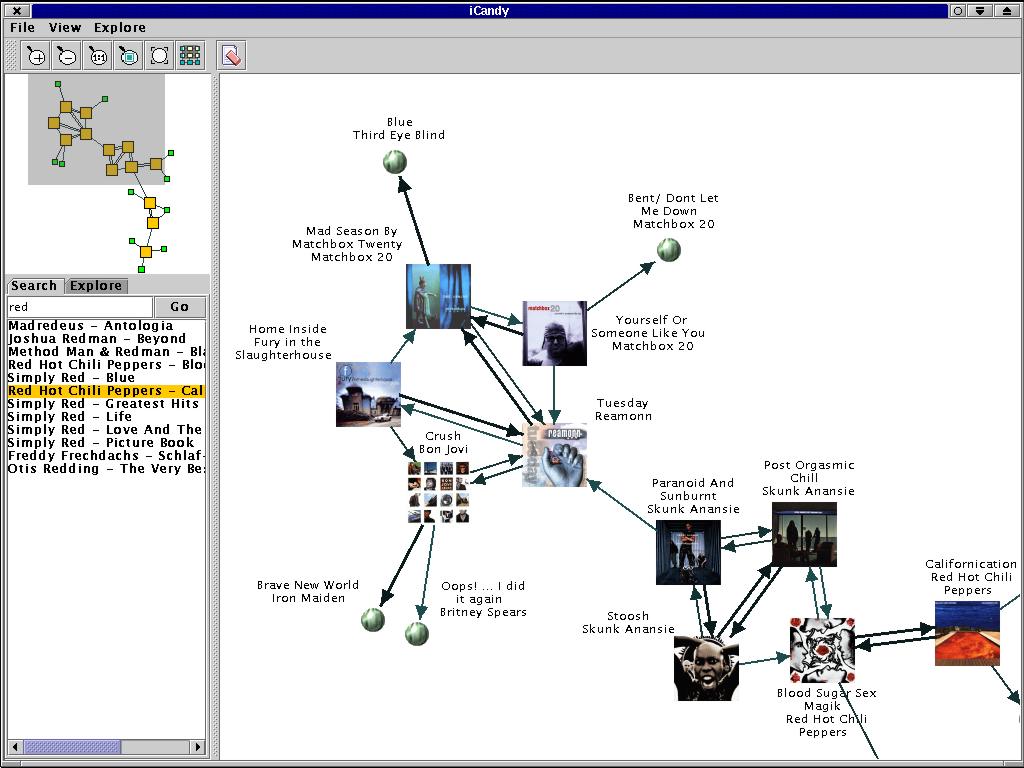
Emphasizes ring and star topologies in networks.
Groups objects according to the network's structure and arranges them on circles or using radial tree structures.
Ideally suited for network management, web visualization, or social networks.
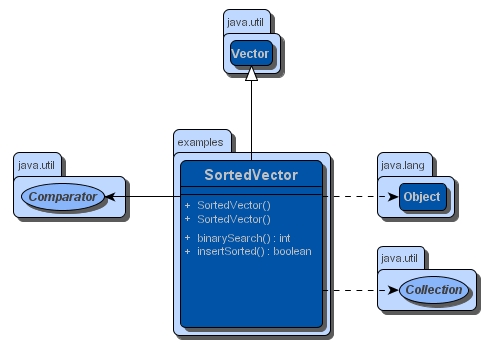
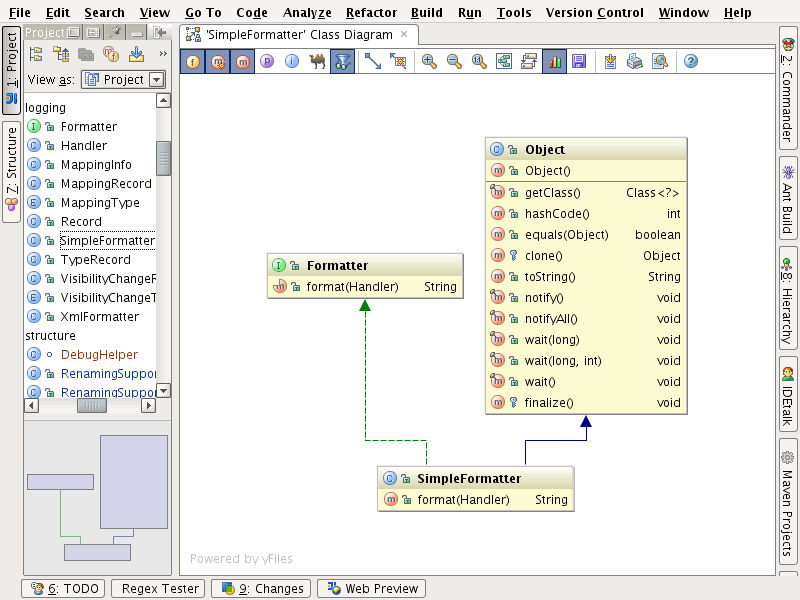
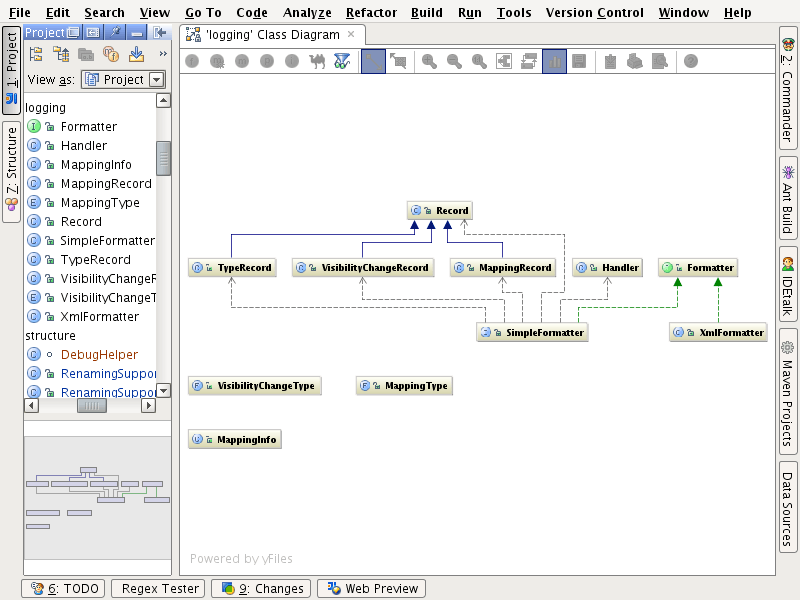
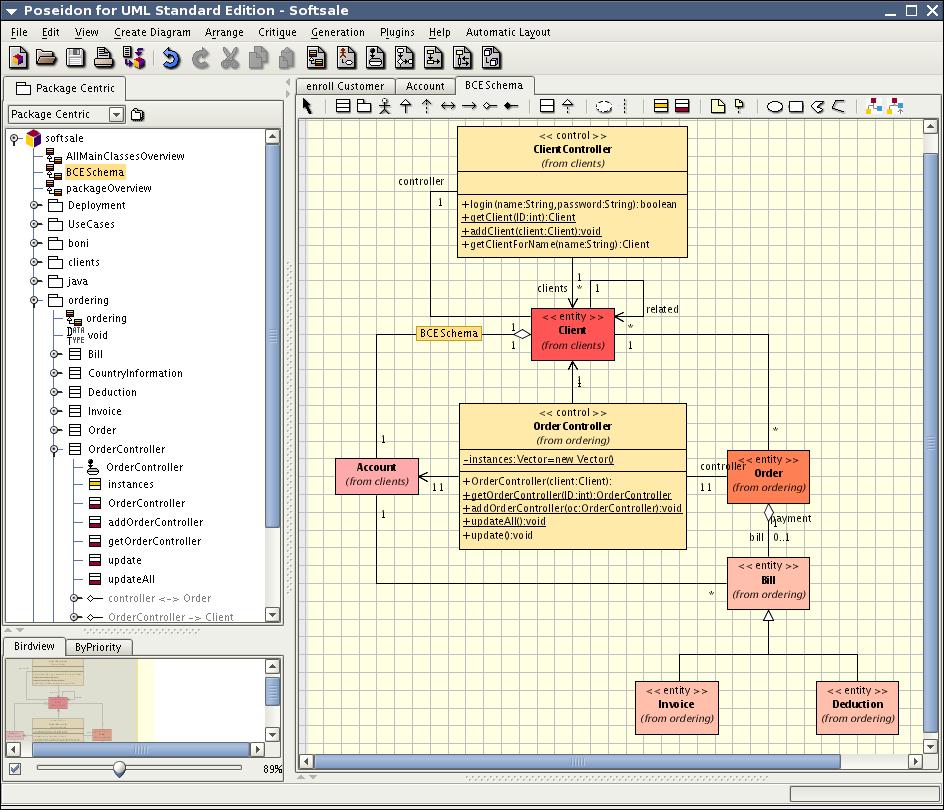
UML Diagramming
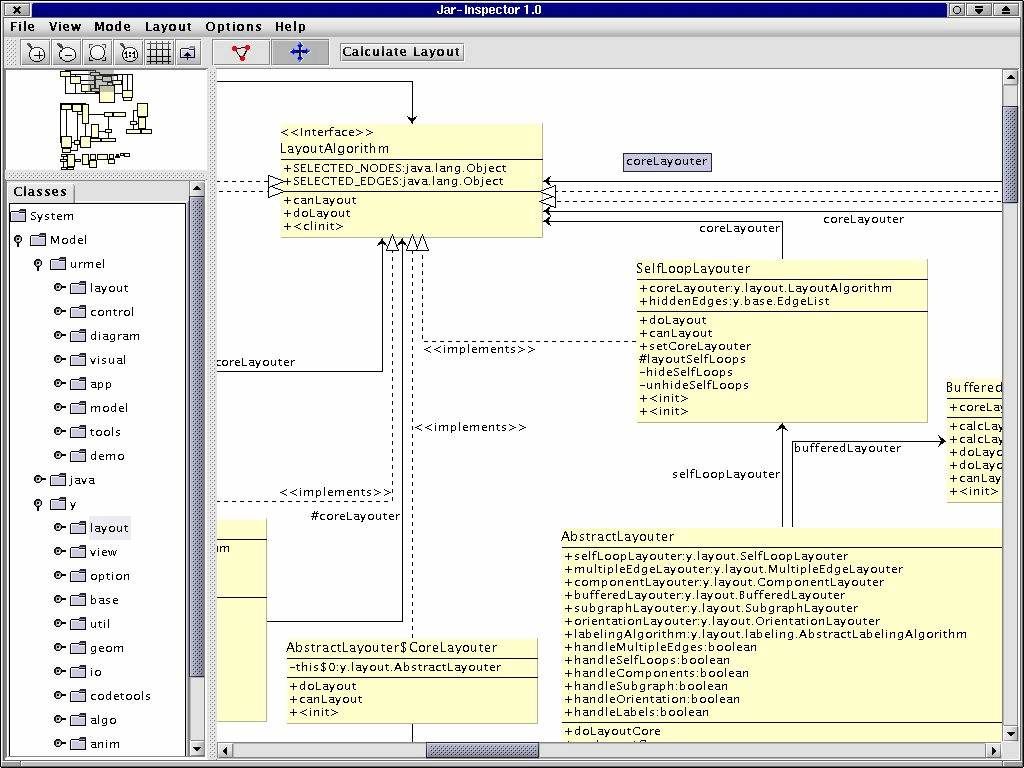
Creating UML diagrams automatically is challenging. Many existing UML tools lack comprehensive automatic layout support.
yFiles on the other hand offers superior layout engines for UML diagram creation. Below are some UML diagrams made with yFiles.


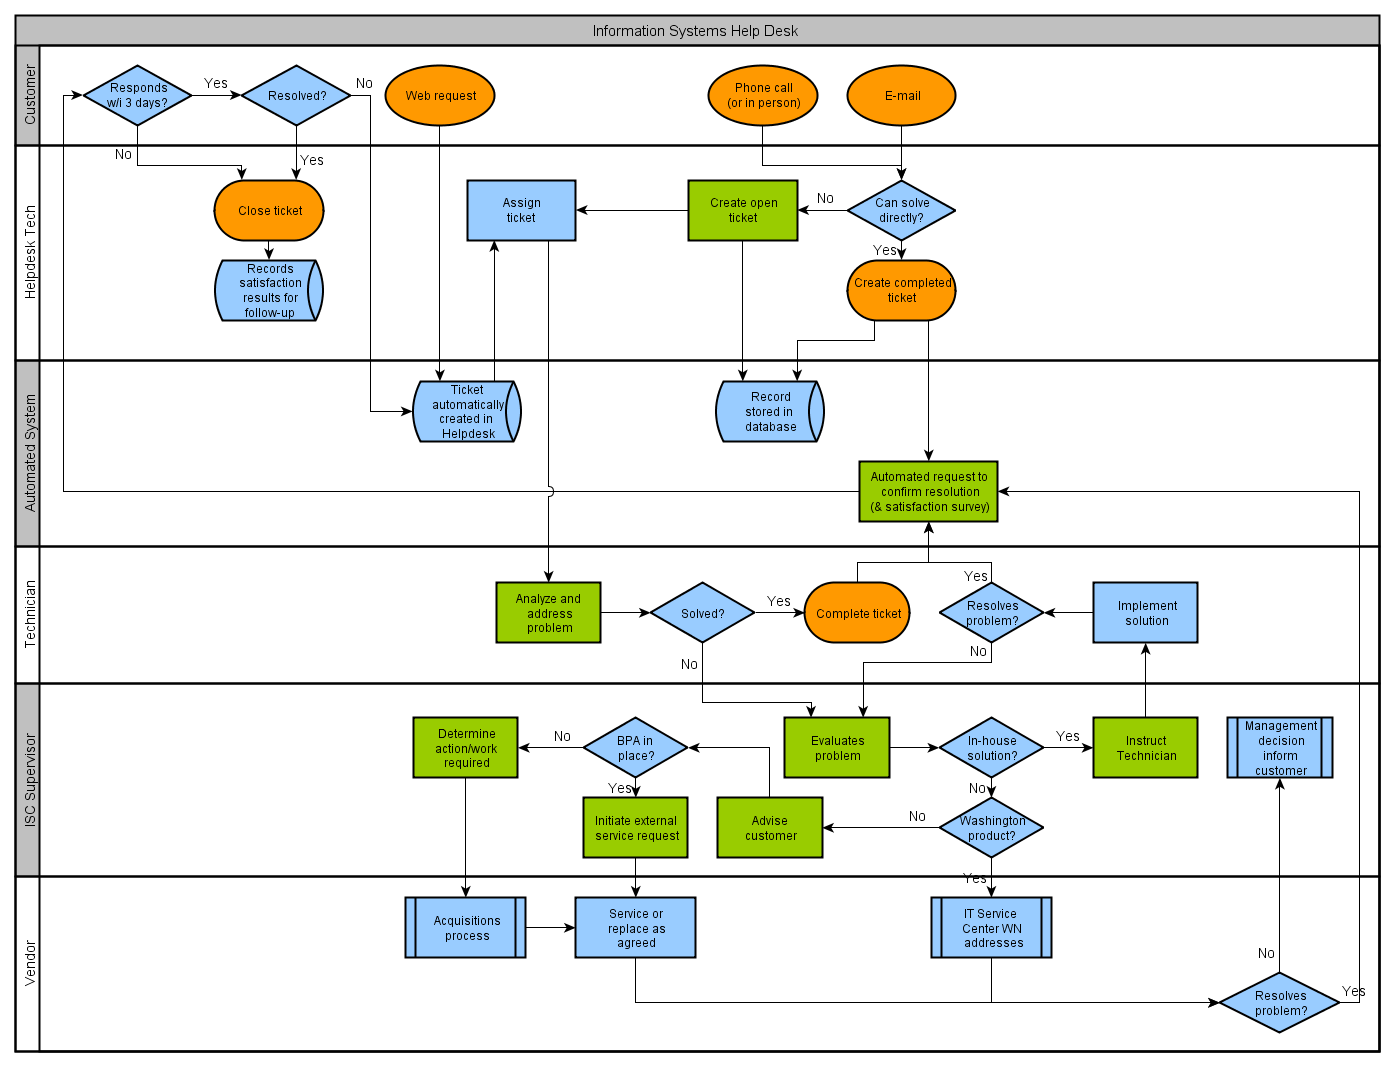
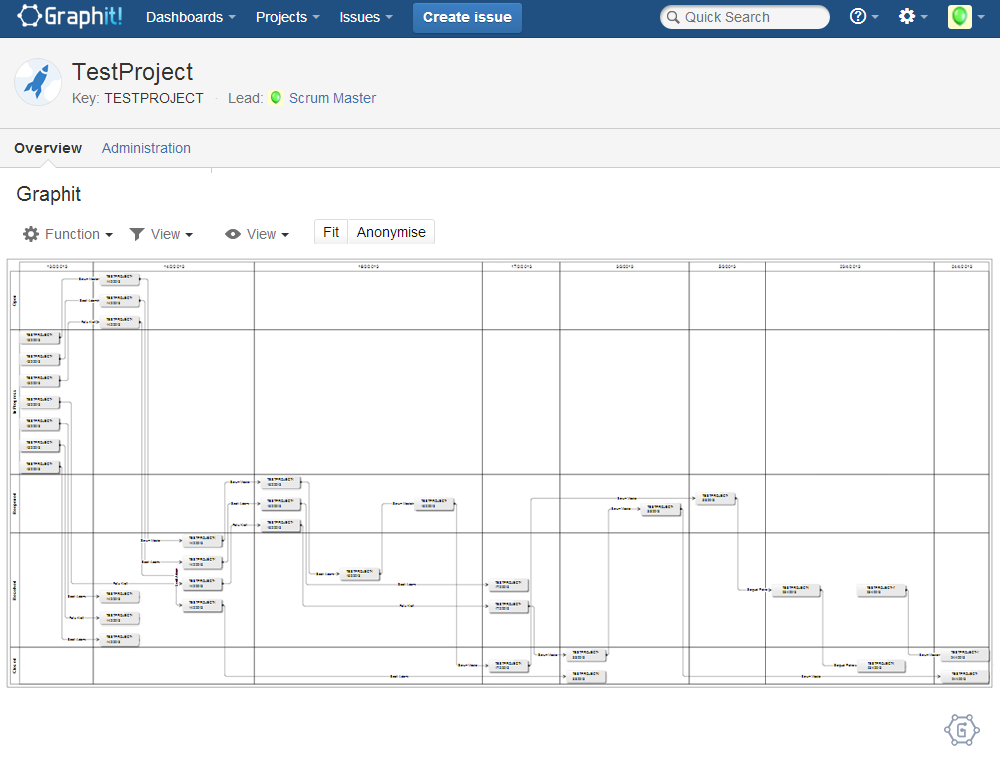
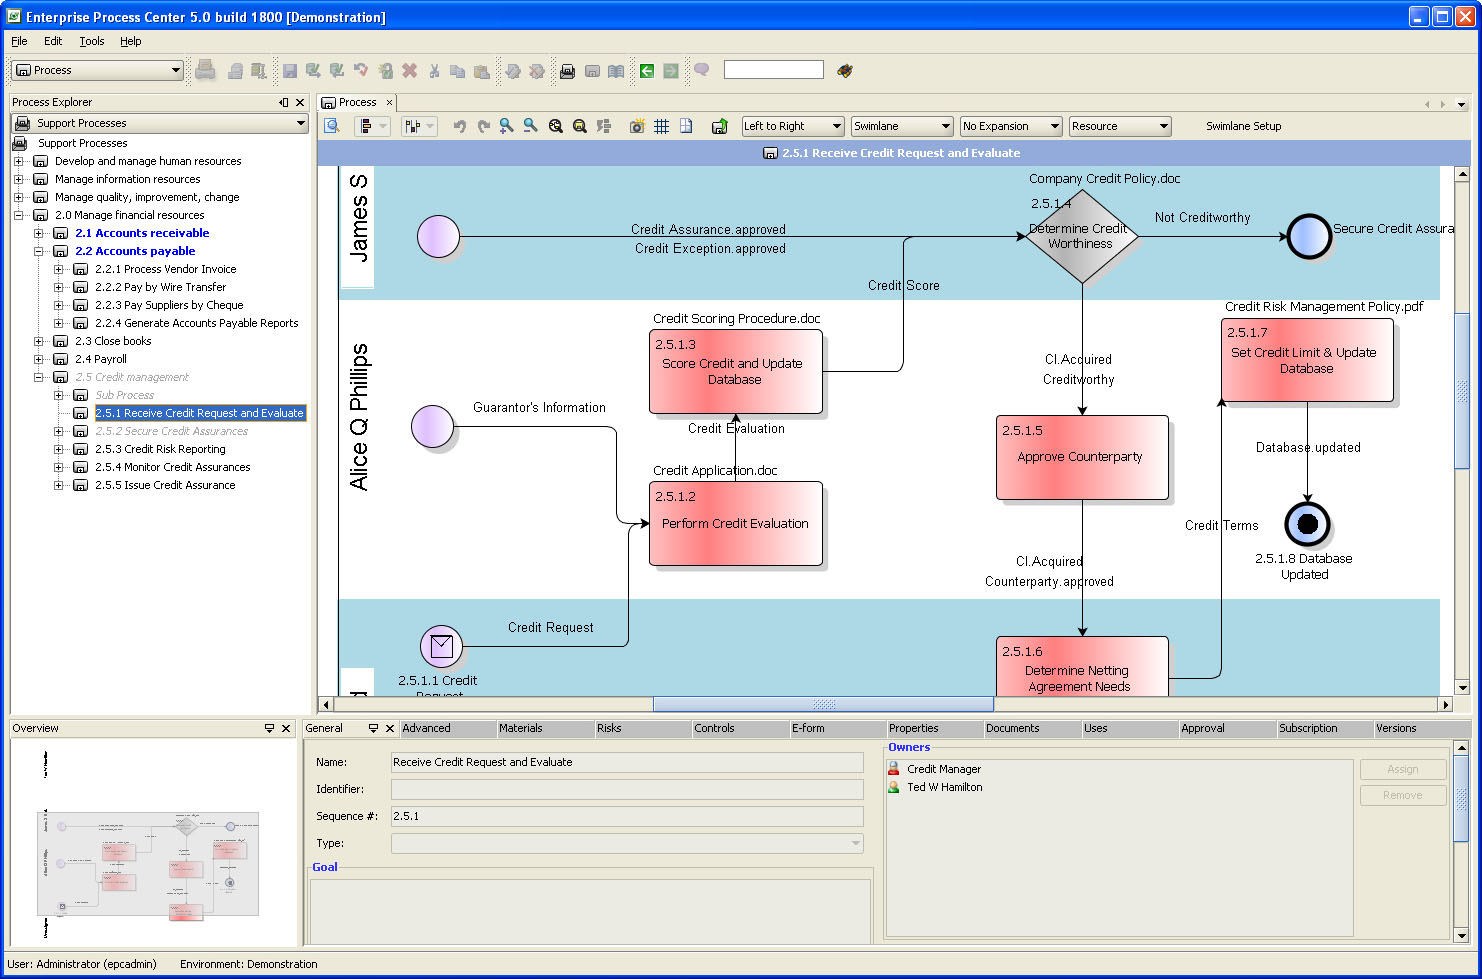
Flowcharts and Swimlane Diagrams
An automatic layout of swimlane diagrams presents a significant challenge. In a swimlane diagram, nodes belong to different graphically depicted lanes, and a layout algorithm needs to arrange them correspondingly.
Often, flowcharts are presented using a swimlane diagram, so that responsibilities are clearly visible.


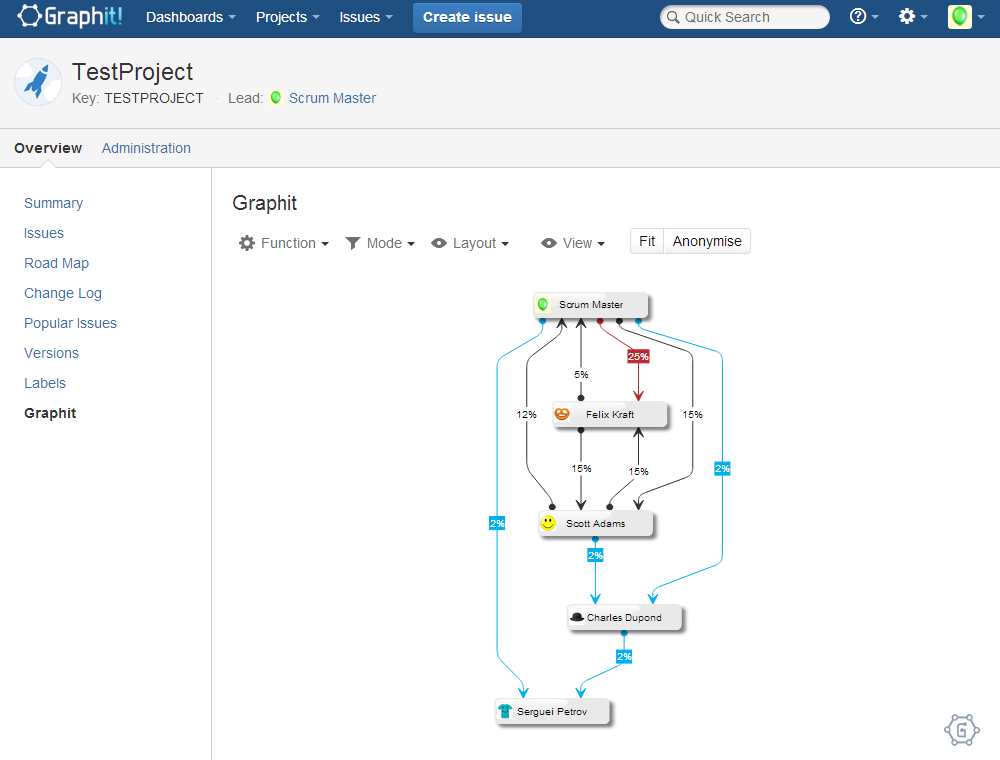
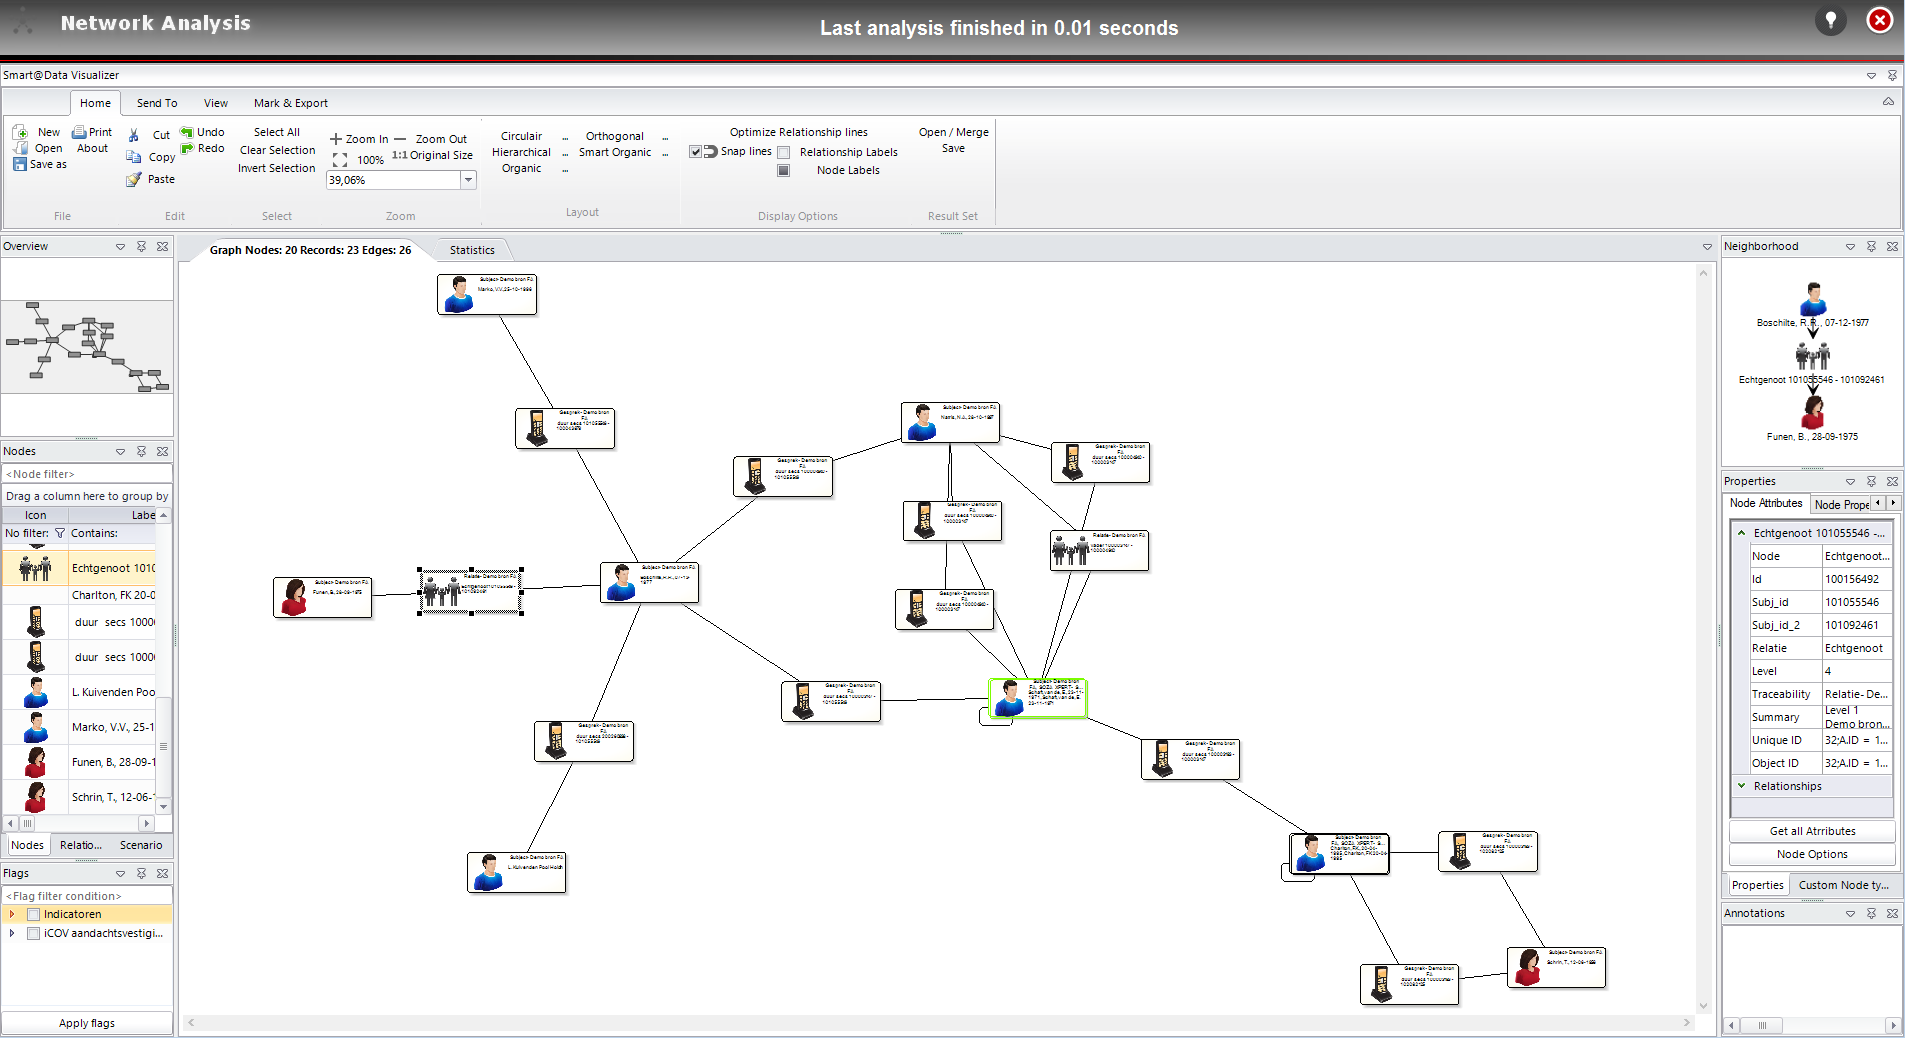
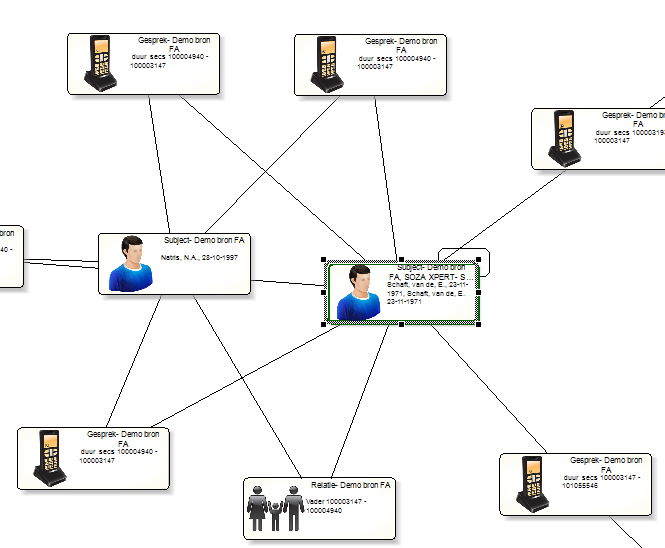
Social Network Analysis
In social network analysis, mathematical analysis of social relationships is used to gain insight into the structure of a social network.
yFiles algorithms facilitate this analysis and enable automatic clustering.


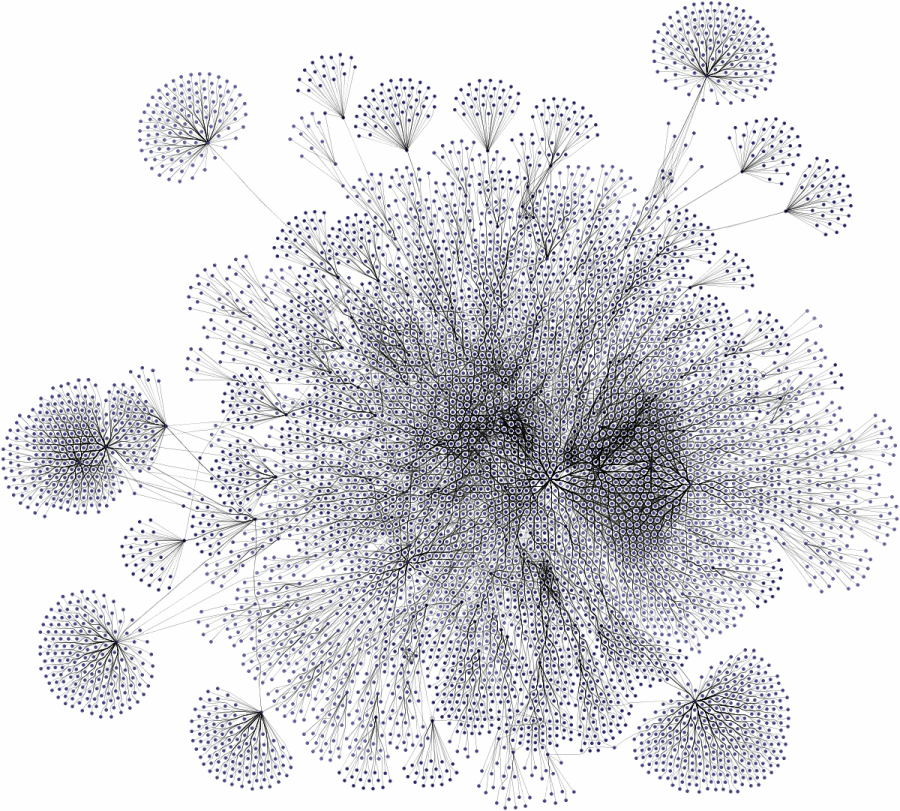
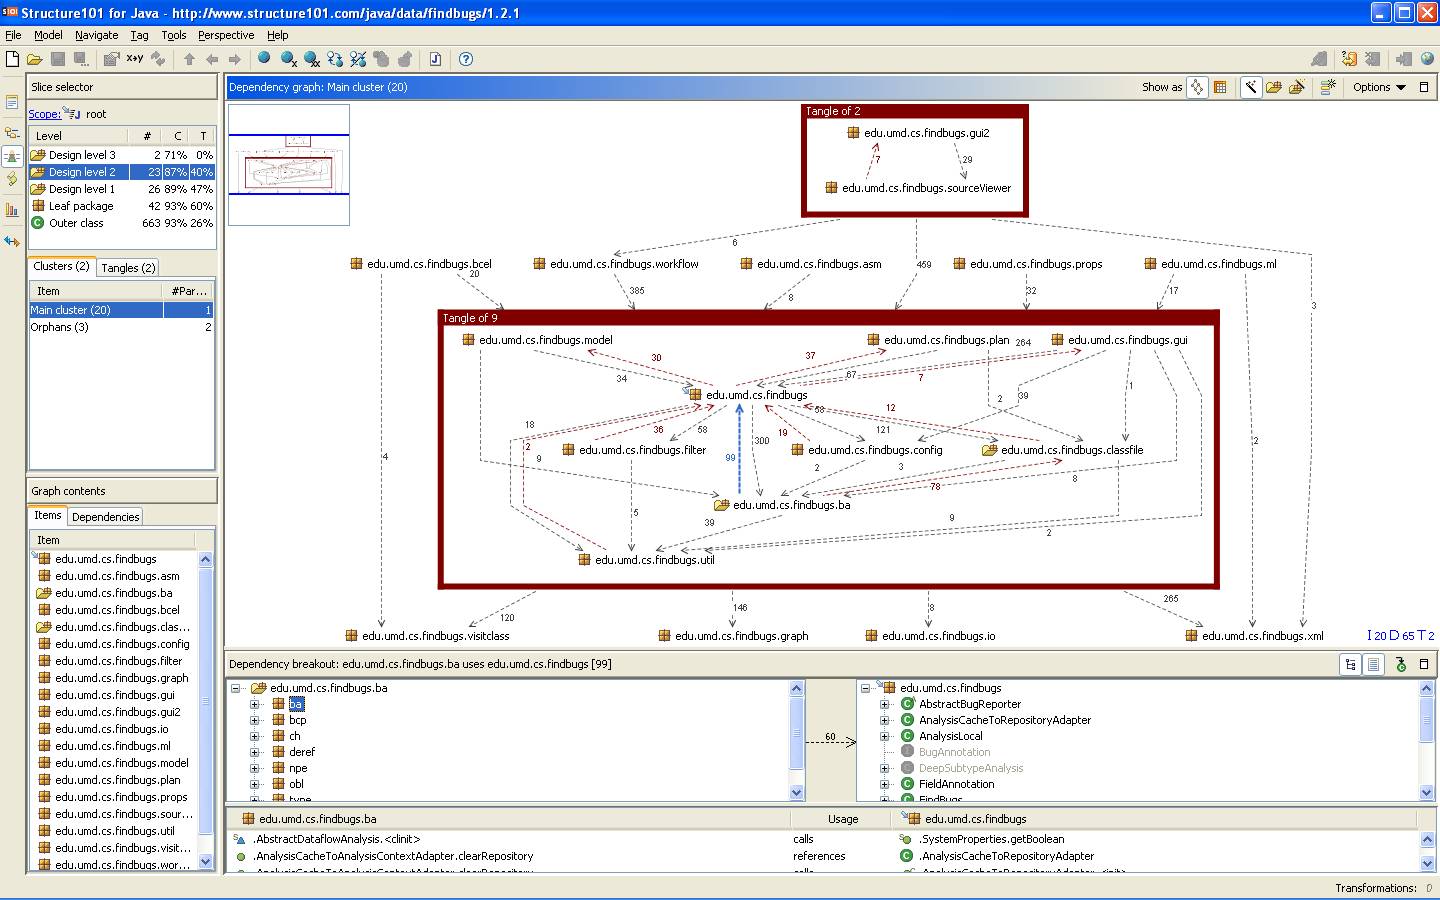
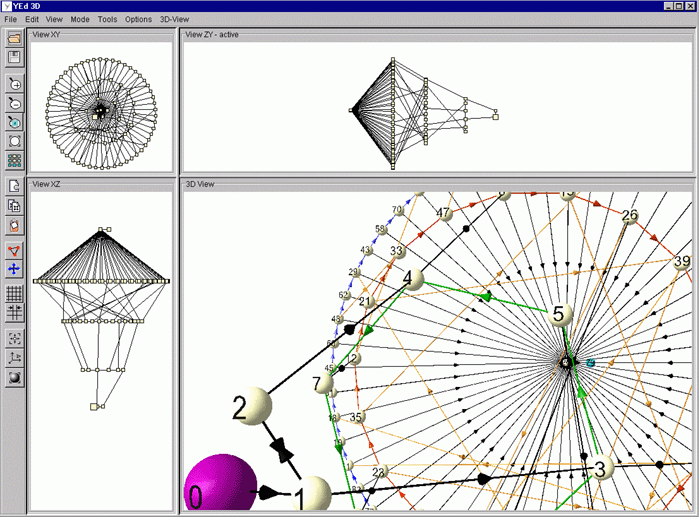
Working with Large Graphs
Creating, editing, and visualizing large graphs with hundreds and thousands of elements is one of the strengths of our library. The following images prove that our library can handle these diagrams and networks easily.
Nested Graph Hierarchies
The yFiles libraries support the notion of "nested graphs," i.e., the nodes of a graph may contain graphs themselves, which can be laid out like any other graph.


Visual Styles and Features
Our graph visualization libraries offer support for a wide range of visual styles. Below are examples of some visual styles created using yFiles.
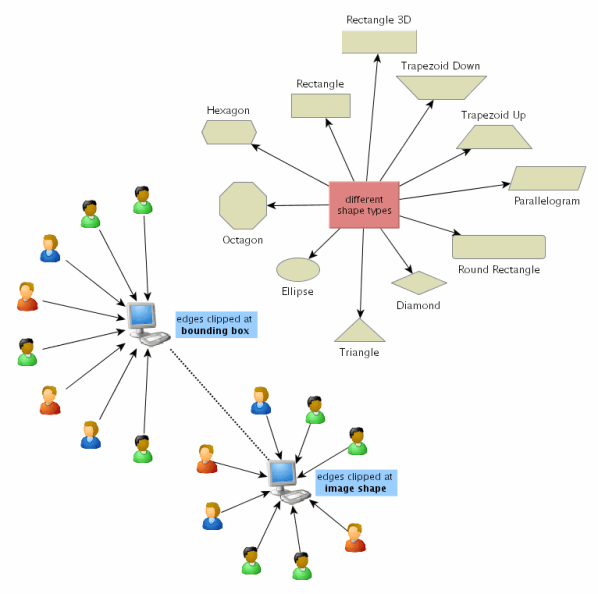


Important information can be easily emphasized with minimal effort.
Layout Constraints
The yFiles graph layout algorithms provide advanced layout constraints when calculating a graph's layout.
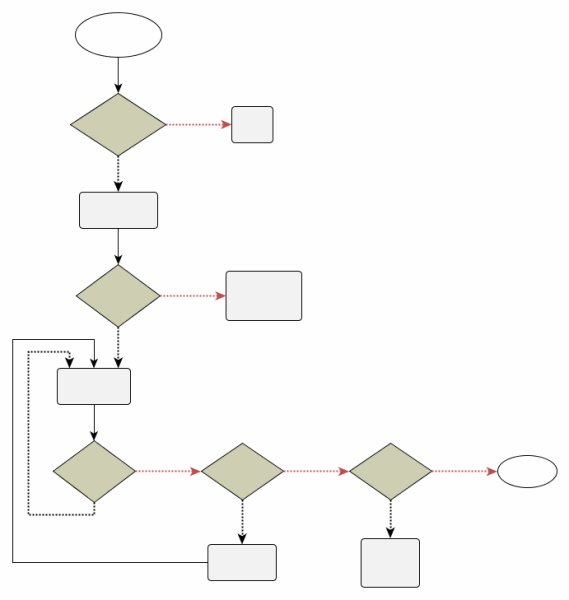
For instance, they facilitate precise positioning of edge starting and ending points in flowcharts or decision diagrams, and they enable customized arrangement policies for specific nodes in organization charts.
Customer Applications
This section displays screenshots of some of the different applications that our customers have built using the yFiles diagramming libraries.


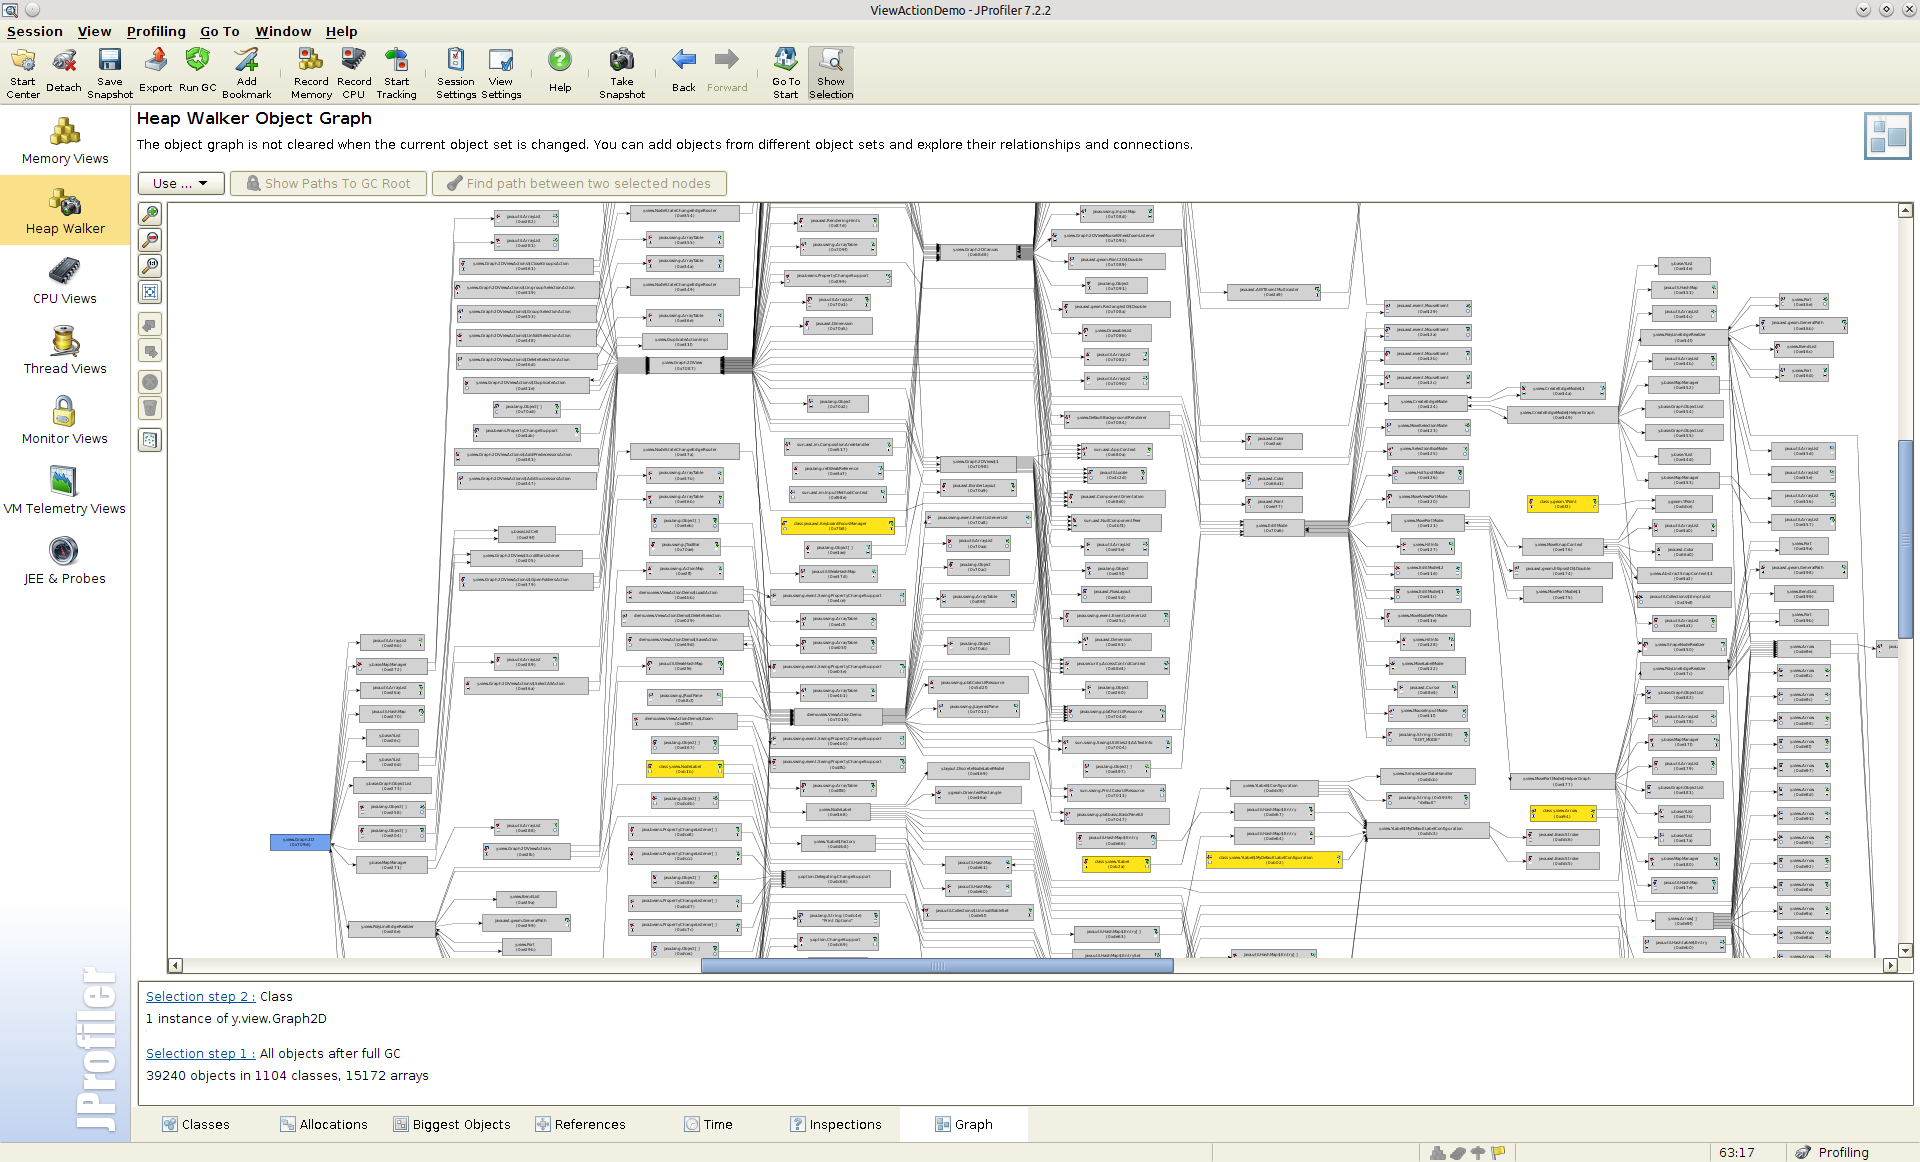


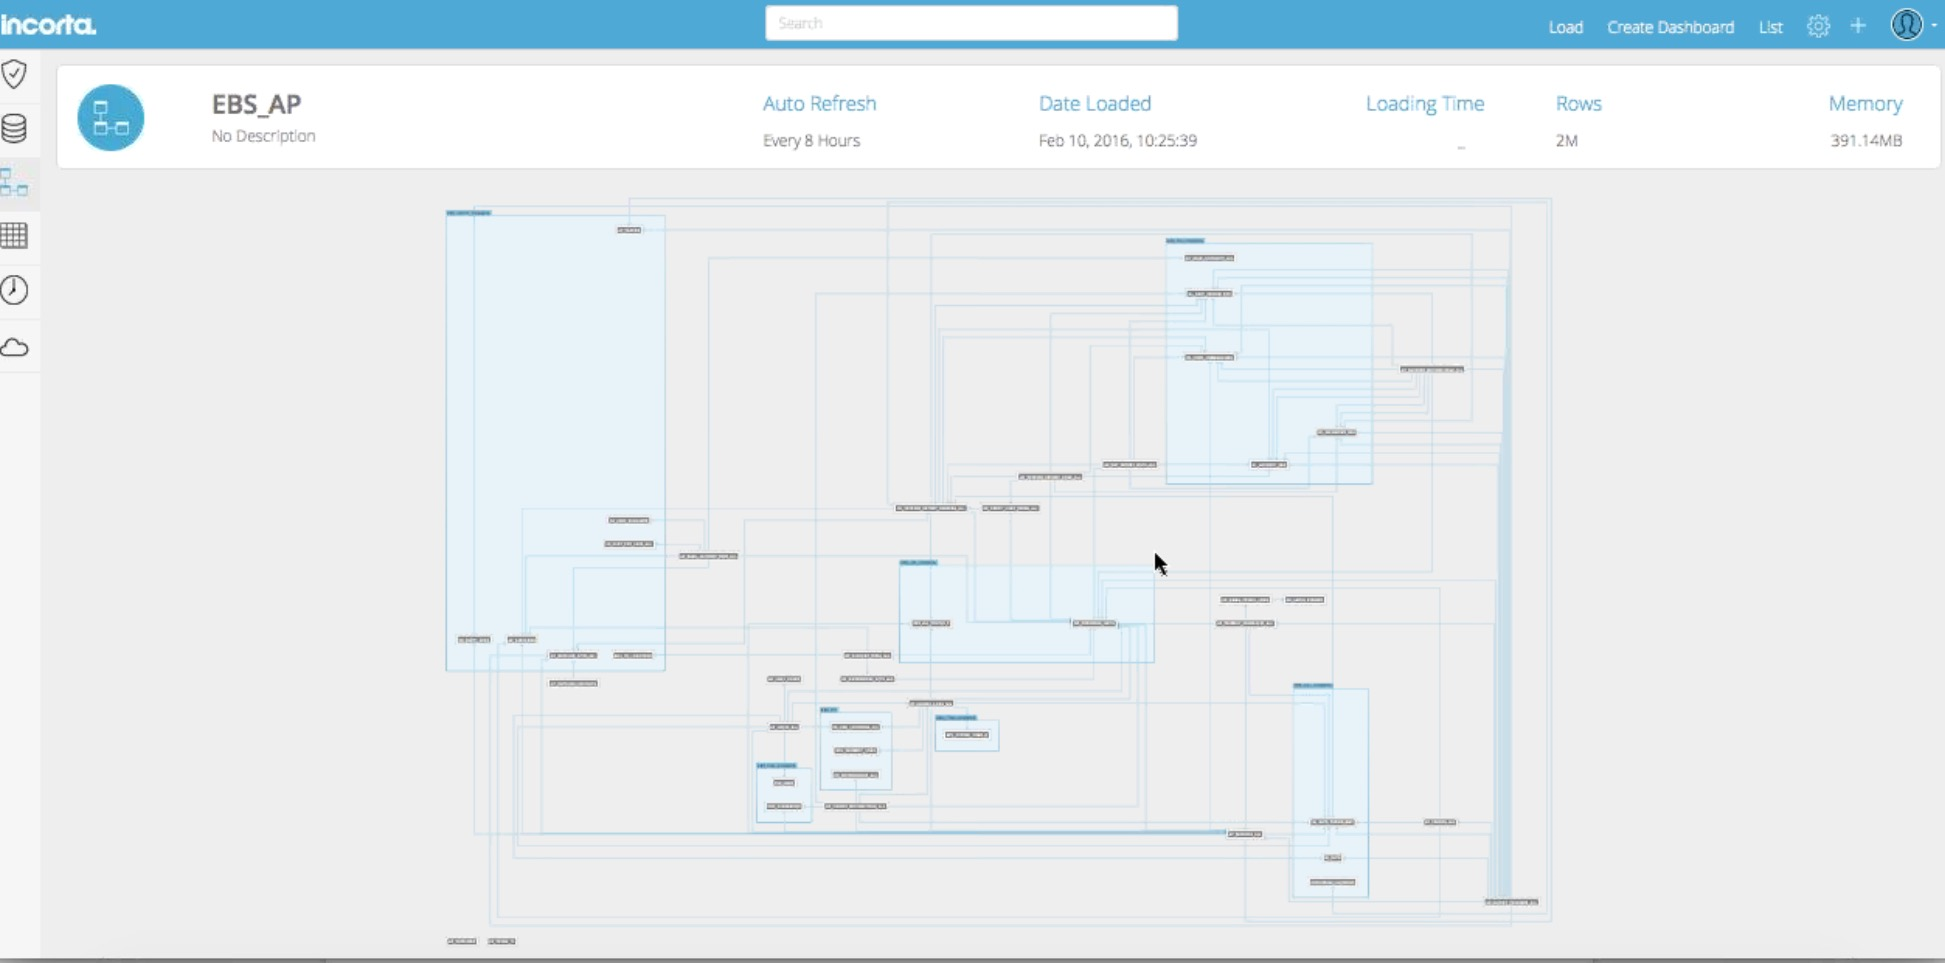

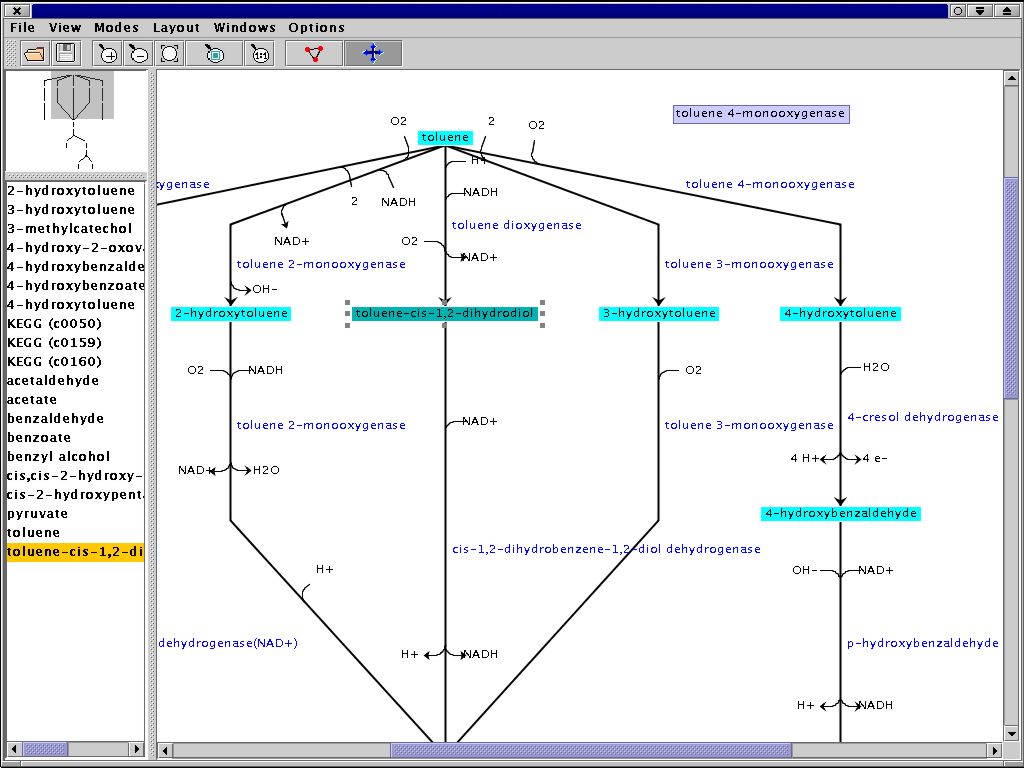
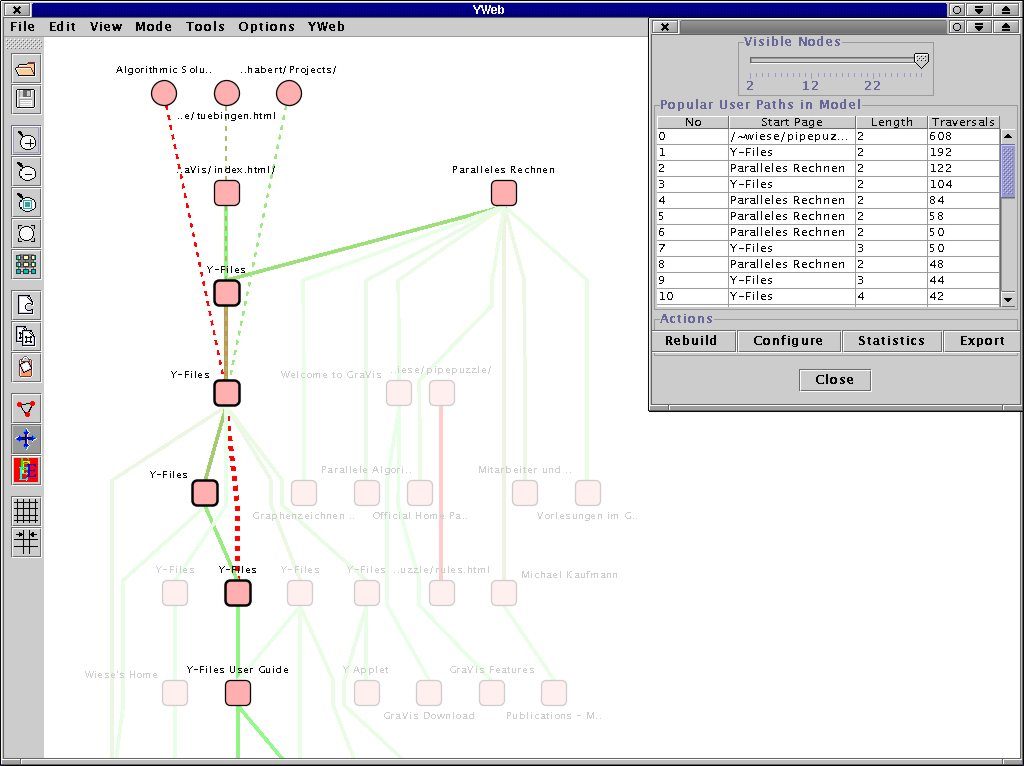
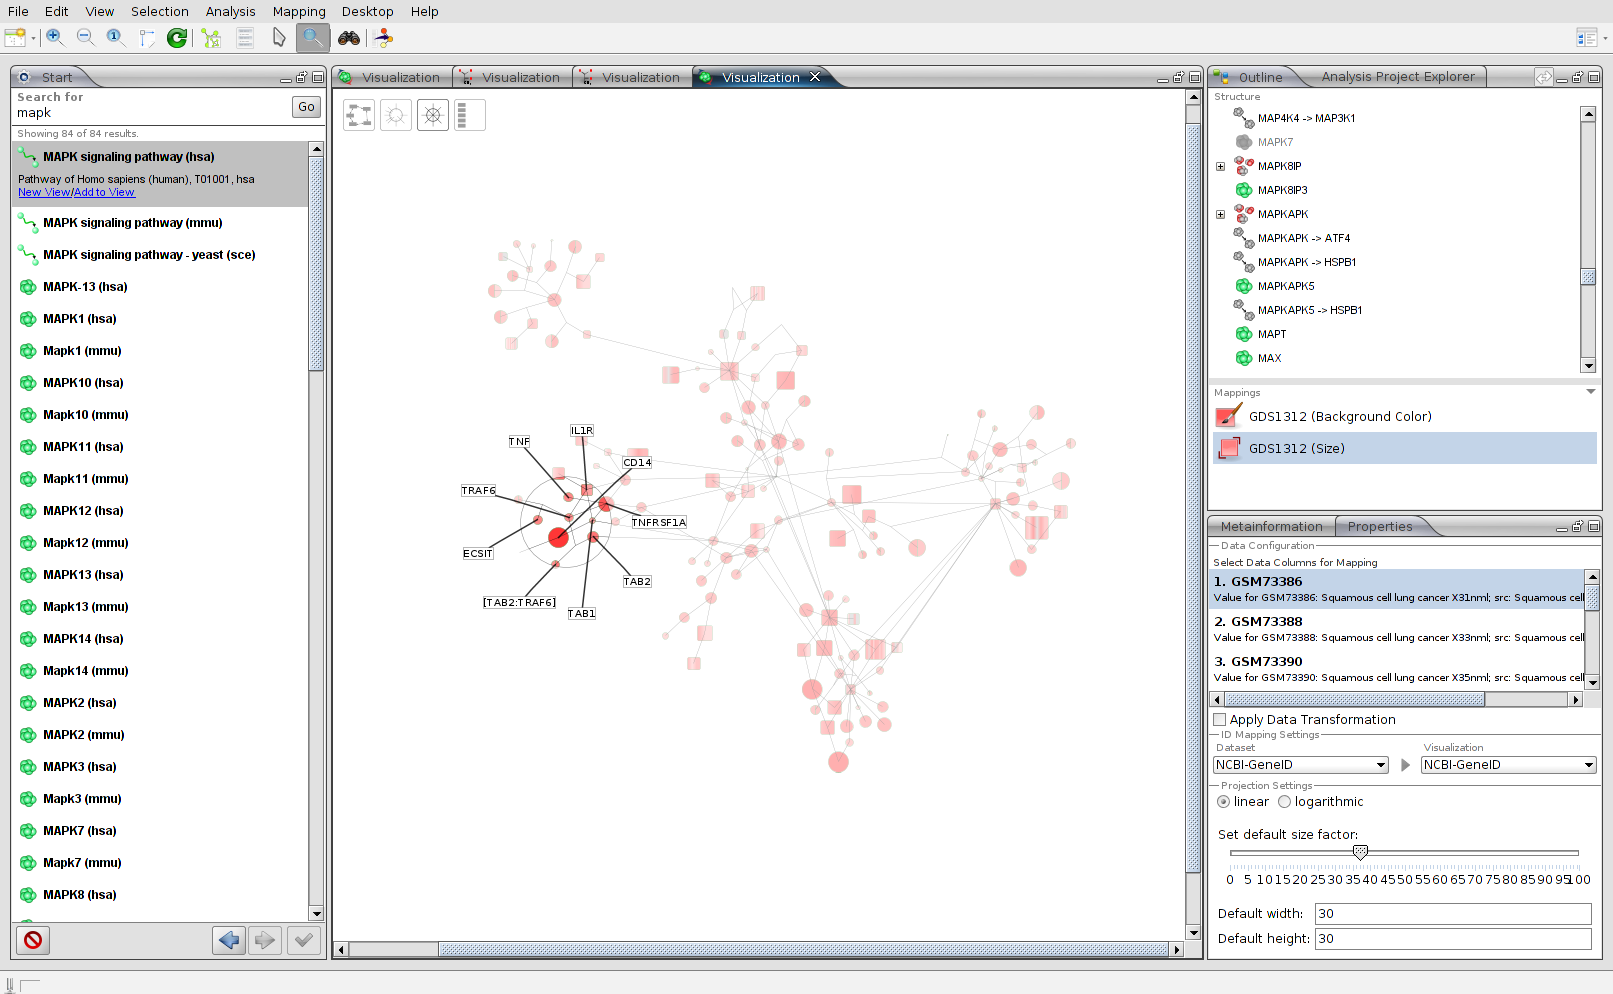
Numerous projects that, for example, deal with the visualization of biochemical pathways, web server log files analysis, or link analysis are made possible by yFiles technology.


you might want to explore


Why, how, what? —Just ask the diagramming experts!

Our team is happy to advise you – no strings attached. Let's talk about your project and find the perfect solution for your needs!
E-mail: hello@yworks.com
Your message has been sent.
Your request could not be sent. Please reload the page and try again.
If the problem persists, please report the error to webmaster@yworks.com.
Learn more in our privacy policy.