
Gallery Submission
Example Diagram Contribution
 Description
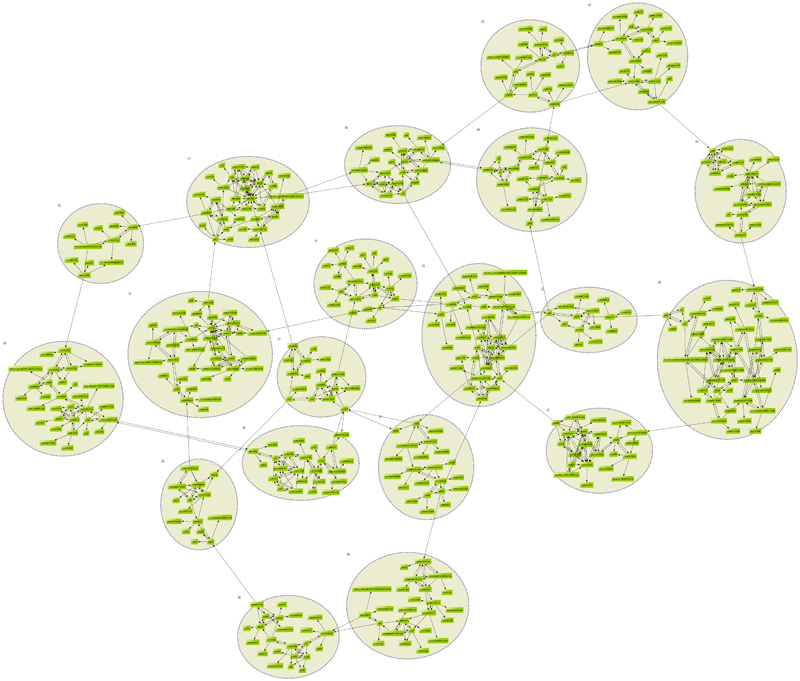
The diagram shows how Last.fm tags are related to each other and how these tags form clusters that represent different music genres.
How the diagram was createdThe depicted data was retrieved using the Last.fm Web API. The initial GraphML file to import into yEd was created using yFiles for Java. To cluster the data, I used yEd's auto-grouping feature. To arrange the diagram elements, I used yEd's organic layout feature.
Author: RWFrequently Asked Questions
Who may submit diagrams?
Anyone is welcome to contribute diagrams.
How are diagrams chosen?
From the submissions we receive, we choose the most compelling illustrations of yEd features, and the most interesting use cases, for inclusion in the gallery.
How will I know if my diagram is chosen?
We notify selected contributors at the email address used in the submission form. We'll then ask for a physical address to which to send your T-shirt.
How will I receive my T-shirt?
The yEd T-shirt is sent by mail. Any required federal, state or local taxes related to the T-shirt are the sole responsibility of the recipient.
you might want to explore


Why, how, what? —Just ask the diagramming experts!

Our team is happy to advise you – no strings attached. Let's talk about your project and find the perfect solution for your needs!
E-mail: hello@yworks.com
Your message has been sent.
Your request could not be sent. Please reload the page and try again.
If the problem persists, please report the error to webmaster@yworks.com.
Learn more in our privacy policy.