You fight against corona? Not alone!
We offer yFiles, the diagramming SDK, and our diagramming expertise for free.
Contact us and let's fight together!

Diagramming against COVID-19

The coronavirus pandemic presents our World Community with challenges that prove harder to solve every day. For us, this means taking responsibility in the field of our expertise: Graph visualizations and diagramming.

We want to support the fight against the coronavirus pandemic as much as we can. Therefore, we offer our software and our consulting services for free.

You are working on a software project which is helping to fight Coronavirus or you are in Home Office and want to boost collaborative work? Read more about what yFiles and Graphity for Confluence can do for you, here:

Diagramming SDK for free

Graph analysis and data visualizations can help answer some of these challenges, such as: visualizing the structure of a virus, organize supplies and workflows or mapping out the current spread of infections, and estimating the future spread. There are many such projects which aim to help with this current coronavirus crisis.

yWorks is the diagramming expert, and we want to help you to fight #COVID-19. Therefore, we have decided to make our diagramming library yFiles free for every project that is helping to fight the coronavirus! If your company, institution, or research project is contributing to this important field, contact us at fightcorona@yworks.com and we will provide you with a free license. Whether you are doing coronavirus research in an institute, visualizing the spread of coronavirus or coordinating help for aiding people in need, tell us, what you want to accomplish and we will help you to get the best solution for your project!

We will do everything in our power to provide licenses, support, and expertise to every endeavor that needs it! Together, we can manage to ease the impact of this coronavirus.

fightcorona@yworks.com

Diagramming editor for free

The situation around the COVID-19 virus forces new ways onto our societies. We have to practice social distancing and reduce contact with other humans to slow down the infection rates. We ourselves switched to home office a couple of weeks ago and want to encourage other companies to do so as well.

Therefore, we offer Graphity for Confluence, our Diagram Editor, for free for companies, which switch to remote working. We believe that visualizing ideas and thoughts collaboratively improves the quality of work and creative process.

If you want to use Graphity for Confluence for free for your now remote working company, contact us at fightcorona@yworks.com.

fightcorona@yworks.com

Success Stories

Covid Graph

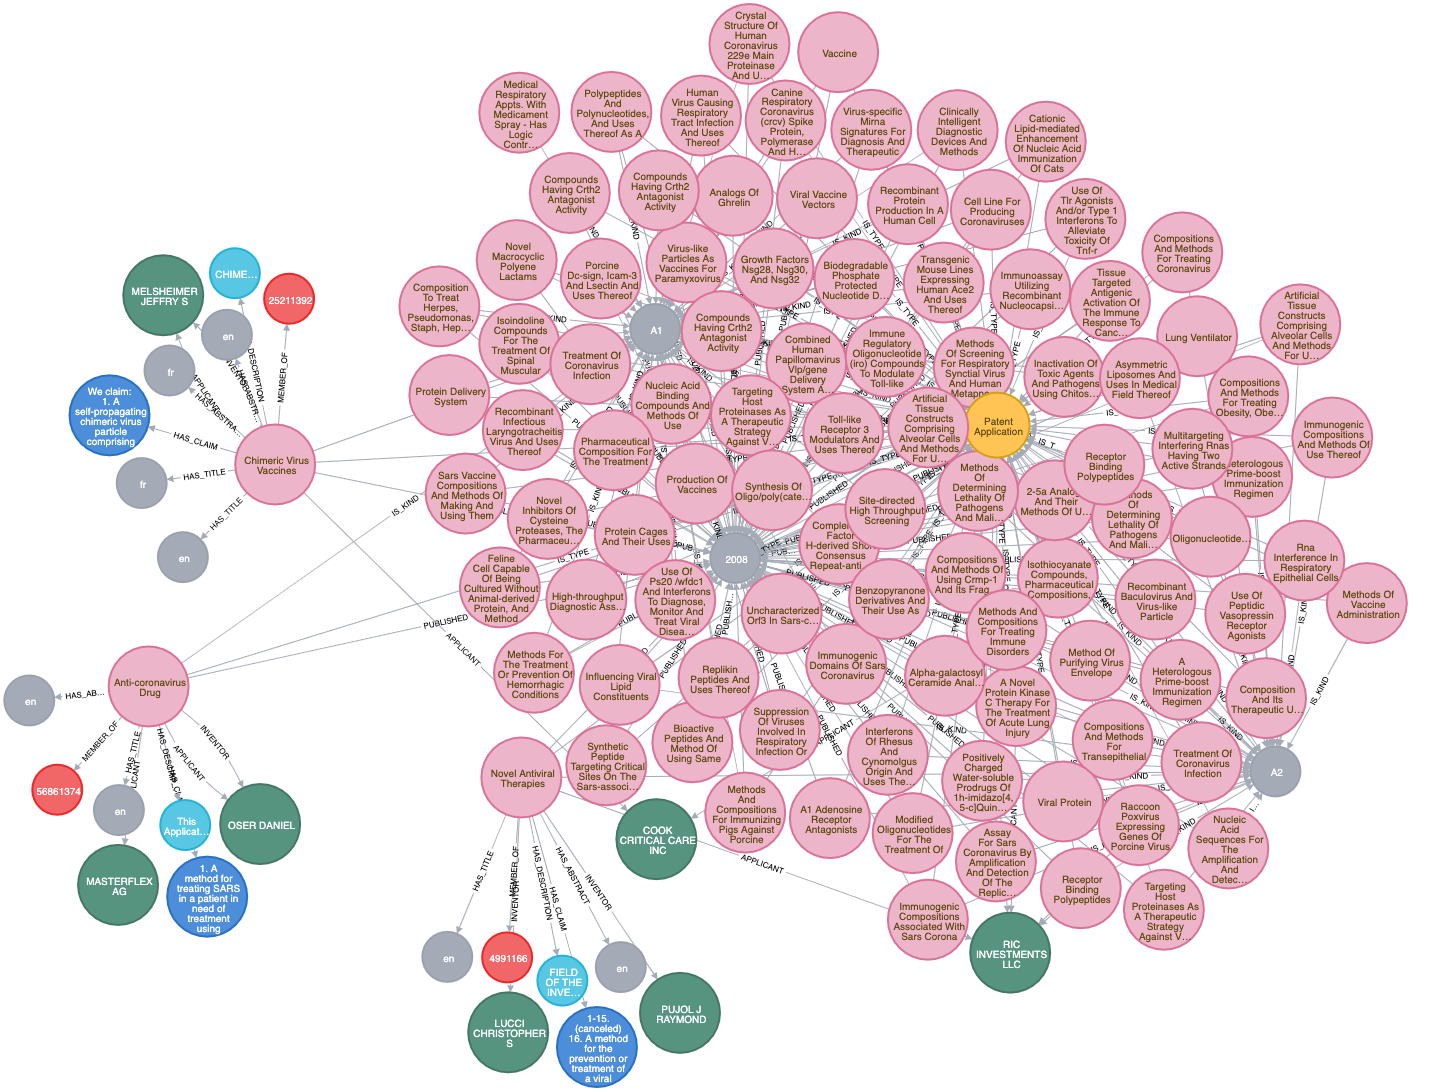
The COVID❋GRAPH project is a voluntary initiative of graph enthusiasts and companies with the goal to build a knowledge graph with relevant information about the COVID-19 virus. Scientists around the world have been given the task to work on COVID-19. Many publications around the virus have been published in the past months, but relevant work around the family of coronaviruses already existed before COVID-19 appeared.
healthecco.org aims to help researchers and scientists to quickly and efficiently find their way through the more than 40.000 existing publications. They provide them with tools that use artificial intelligence, advanced visualization techniques, and intuitive user interfaces to explore papers and patents around the family of the corona viruses, existing treatments and medications. It combines publications, case statistics, genes, molecular data, and many more entities in a Neo4j database.

Within COVID❋GRAPH project are teams who visualize the data. Therefore, they use yFiles, the diagramming SDK, such as the team around the Covid Graph Explorer.

healthecco.org

Covid Graph Explorer

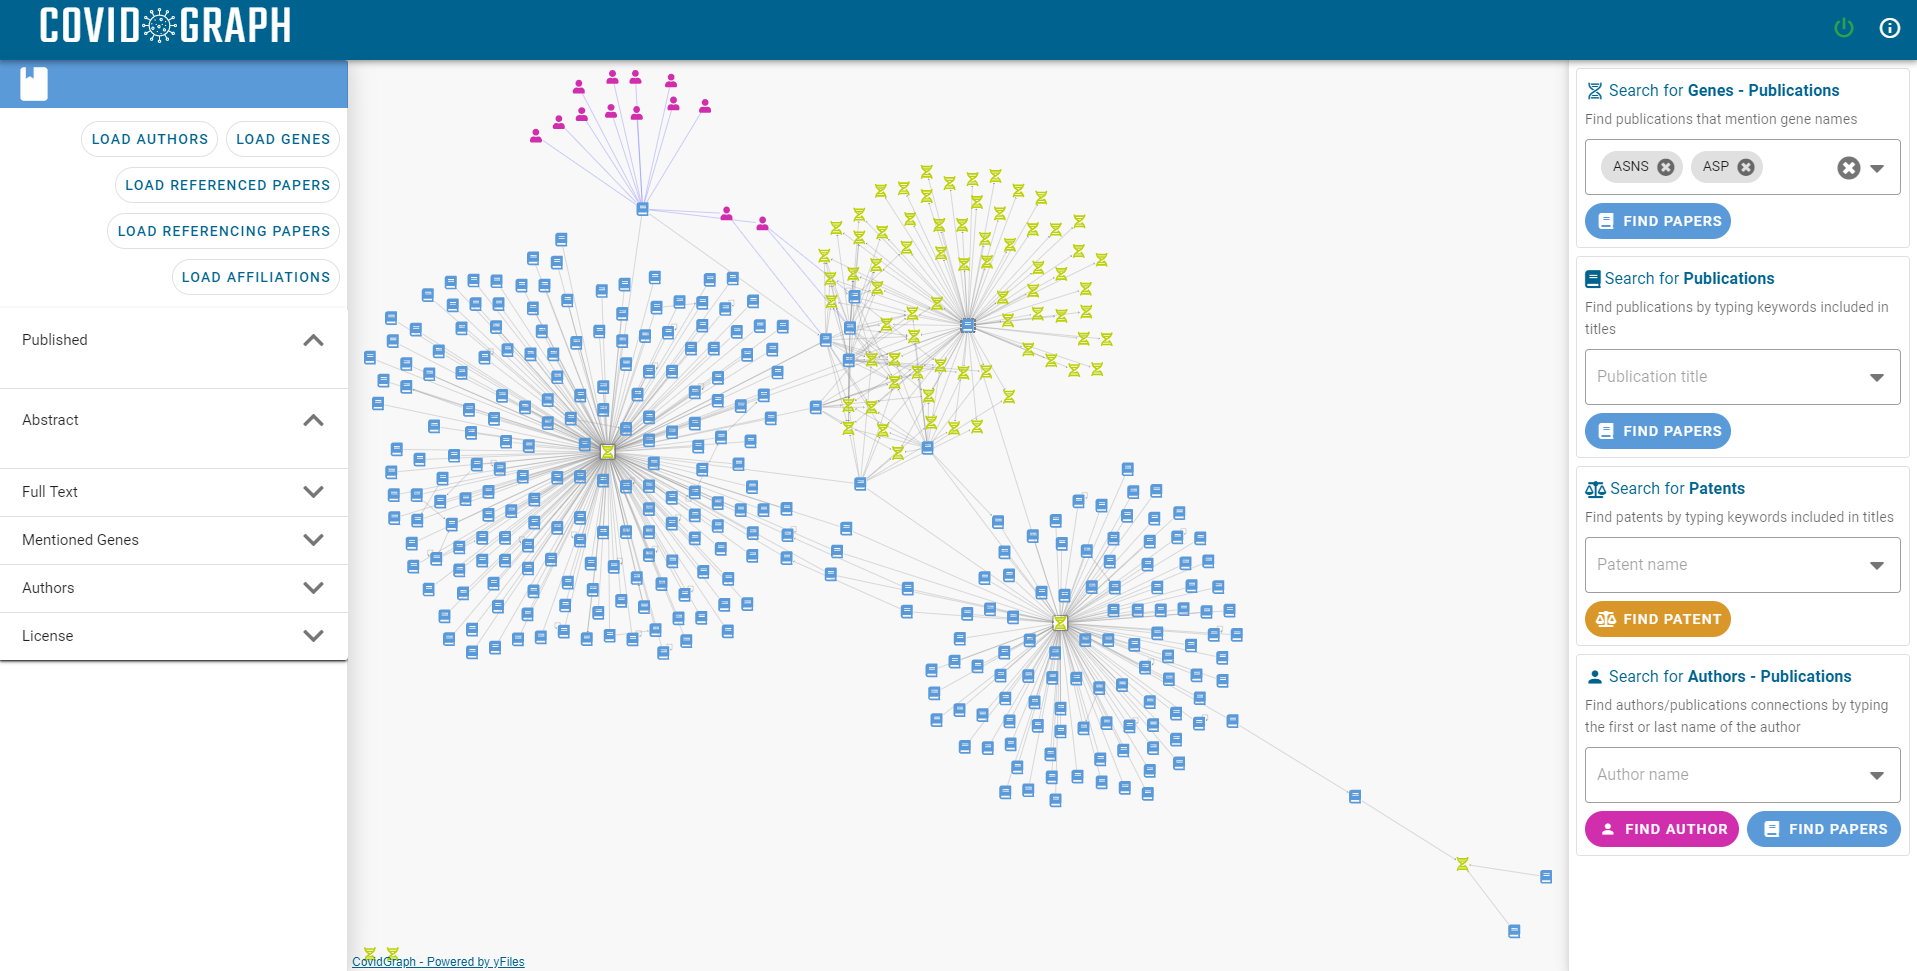
Use this application to interactively explore the more than 40.000 publications around the recent coronavirus. The search panel allows for finding specific genes, authors, articles, and patents which are loaded into the graph. The actions in the context menu and in the details view help exploring the database by loading connected entities and clearly arranging the graph. The visualization and interaction of the tool is powered by the out-of-the-box algorithms of yFiles for HTML.

Covid Graph Explorer

COVID-19 Disease Map Community

EISBM is engaged with the LCSB in the development of a “COVID-19 Disease Map Community” , relying on the international network of DMC partners associating hospitals and clinical research centers, which are at the forefront in the ongoing fight against the COVID-19 epidemic or which contribute to understanding the mechanism of interaction of SARS-CoV-2 with human cells and its detection. The activities of this COVID-19 Disease Map Community, which is growing every day (currently more than 120 researchers and clinicians from 30 countries around the world will be coordinated in compliance with good scientific and ethical practices) with the goal to provide reliable data validated by independent specialists for understanding of the virus-host interactions and support the development of drugs and vaccines to prevent and treat COVID-19.

The initiator of this project is Gökhan Ersoy

CellDesigner

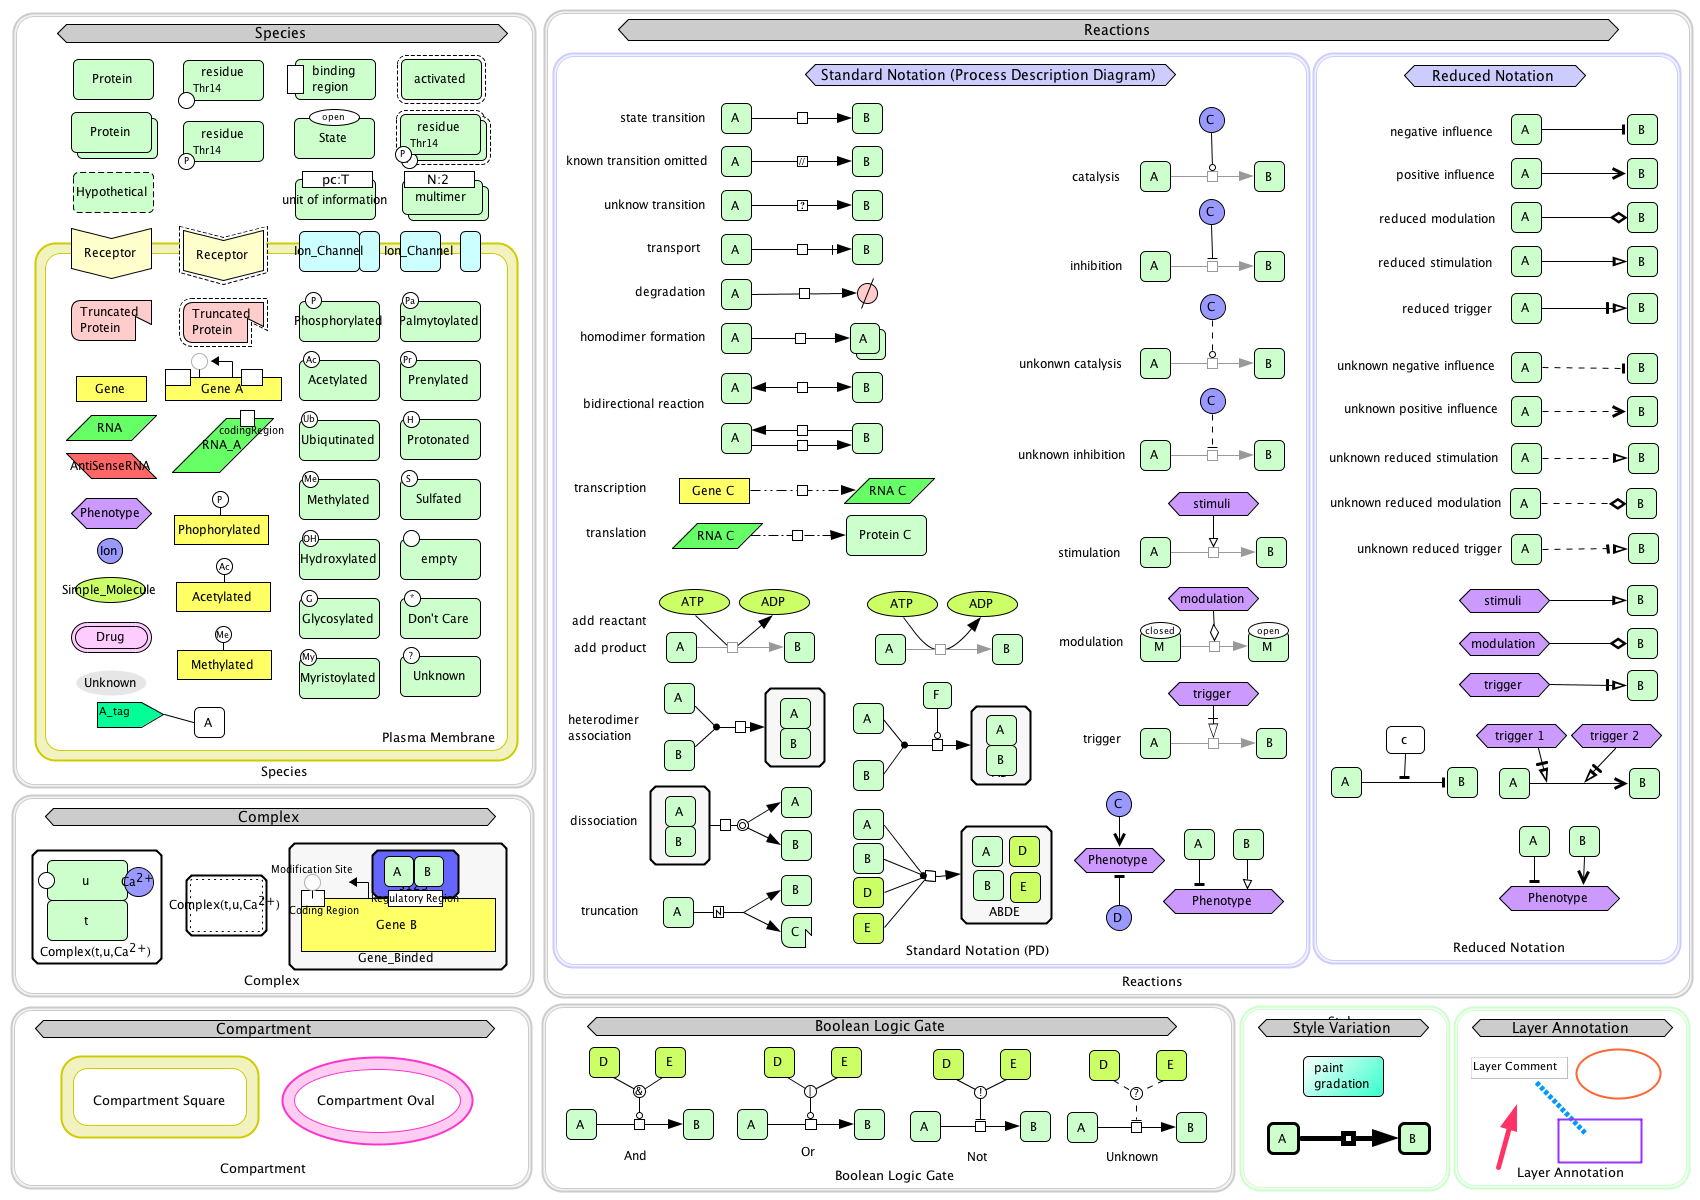
Participating in the COVID-19 Disease Map Community and contributing to the research activities is Prof. Akira Funahashi from Keio University, who is also the main developer of the CellDesigner (http://celldesigner.org) software. The CellDesigner software is one of the main curation tools used by DMC researchers all over the world to construct systems biology diagrams of biochemical pathways for the COVID-19 disease map.
A new CellDesigner release for the COVID-19 Disease Map project which will be integrated with Reactome, Intact, etc. databases and combines with the model converter web service implemented by the University of Luxembourg is expected to lead to a larger, more detailed, COVID-19 disease map (network).

CellDesigner

COVIDPathways

Researchers all over the world use the "COVID-19 Pathway Collection", which is part of the COVID-19 Disease Map project, to collect and curate pathway models relevant to the COVID-19 pandemic.
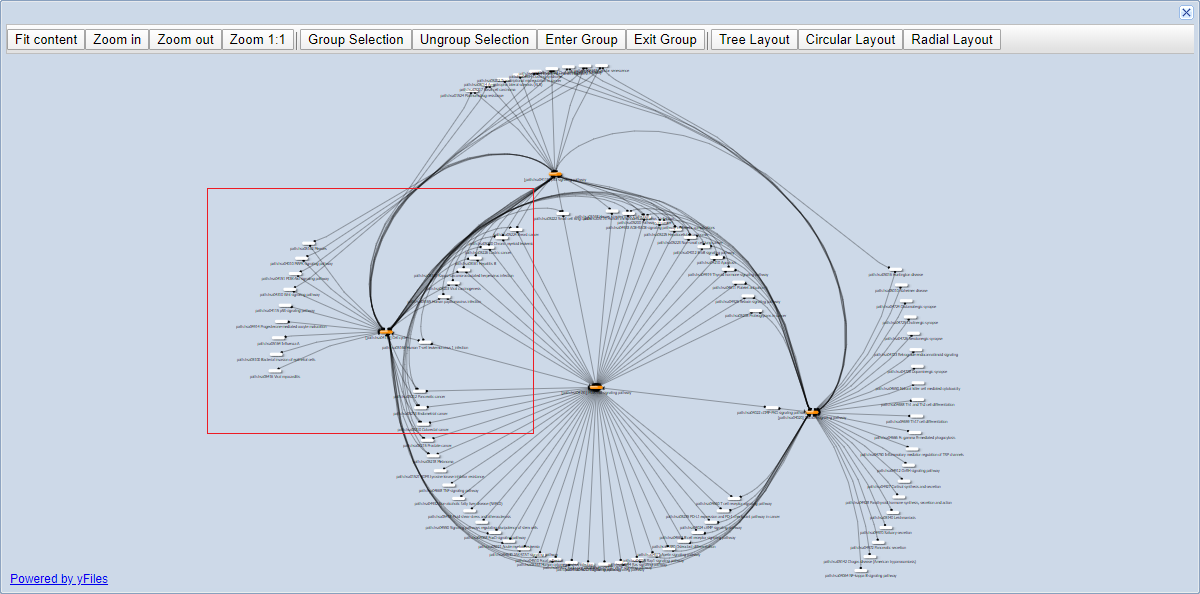
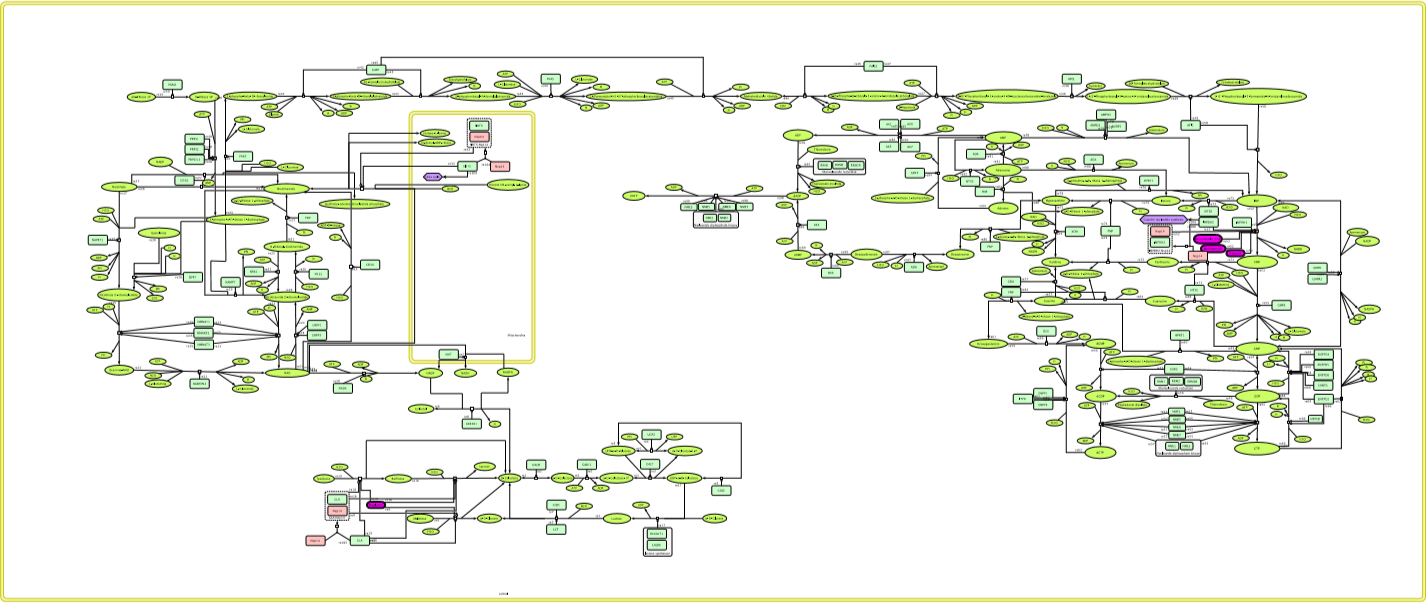
For example, the systems biology diagram on the right, which was constructed by the research group of Prof. Dräger from the University of Tübingen who is also participating in and contributing to the COVID-19 Disease Map project, shows interactions of a coronavirus protein with the human host cell.

COVIDPathways

Bioinformatics Group Yerevan

Arsen Arakelyan and his team of the Bioinformatics Group of the Institute of Molecular Biology NAS in Yerevan, Armenia are reconstructing viral-human protein interaction maps as well as trying to build downstream biological pathways and simulate the ways they affect the host cell function. yFiles for HTML contributes to both analysis and visualization tasks of this research.

IMB

Why, how, what? —
Just ask the diagramming experts!

Our team is happy to advise you – no strings attached. Let's talk about your project and find the perfect solution for your needs!

E-mail: hello@yworks.com

The data you enter will only be used to contact you regarding your request.
Learn more in our privacy policy.