Diagram Creation
yEd makes diagram creation easy and fun with its powerful features and intuitive user interface.

yEd is a powerful desktop application that can be used to quickly and effectively generate high-quality diagrams. It runs on all Windows, Unix/Linux, and Mac OS versions. If you want to know more about all our diagram editors check out the yWorks diagram editors overview.
yEd makes diagram creation easy and fun with its powerful features and intuitive user interface.
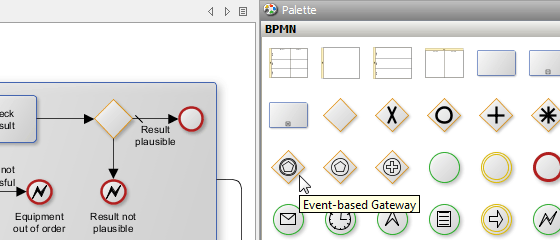
yEd comes with an extensive palette of beautiful, ready-to-use elements to get you started with your first diagrams, including:
You can also easily import your own bitmaps (JPG, PNG), vector graphics (SVG), or shape stencils from Visio® VSX files into the palette to create custom element types.
yEd also helps you annotate and position elements for maximum clarity:
Editing diagrams in yEd feels intuitive and comfortable thanks to:
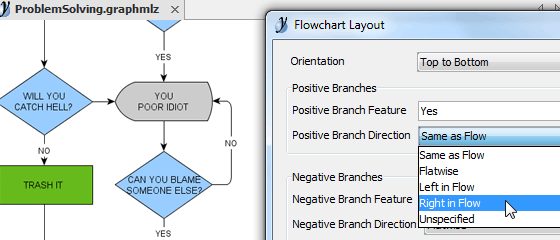
yEd provides powerful functionality for the layout of complex data sets. Its highly sophisticated mathematical layout algorithms can be used either to automatically arrange diagram elements, or to support you when undertaking a manual layout.
Import from any of the following formats:
Once you've created a stunning diagram with yEd, it's easy to save it to GraphML and to export it for use in print or on the web.
yEd can export diagrams to a range of graphics formats including:
To view more examples of yEd output, visit the yEd Gallery of User-created Diagrams.
yEd is a pure Java Swing application. It runs on all Windows, Unix/Linux, and Mac OS versions where a suitable Java Runtime Environment is available.
yEd is based on the yFiles for Java diagramming library, which provides not only the automatic layout algorithms and analysis tools, but also the intuitive user interface that makes creating and editing diagrams so easy.
For its look and feel, yEd makes use of UI components from JIDE Software.

Our team is happy to advise you – no strings attached. Let's talk about your project and find the perfect solution for your needs!
E-mail: hello@yworks.com


