
Release Notes
yEd Graph Editor
Latest Release
The latest release of yEd Graph Editor is version 3.25.1
Previous Releases
yEd 3.24 - Changes Since 3.23.2
General
- The JREs that come with the Windows and Linux installers have been updated to OpenJDK 22.0.1. The JRE that comes with the macOS installer has been updated to OpenJDK 21.0.3.
Improvements
- When dragging an edge template from yEd's palette into yEd's editor area, a preview of said template is now displayed during the drag gesture.
Bugfixes
- Fixed file chooser dialog freeze when opening the native file chooser from yEd's welcome screen on macOS.
- Fixed exception that sometimes happened when quitting yEd on macOS.
- Many bugfixes and improvements in yEd's layout algorithms.
yEd 3.23.2 - Changes Since 3.23.1
General
- The JREs that come with the Windows, macOS, and Linux installers have been updated to OpenJDK 20.0.2.
Improvements
- Improved and corrected import support for the GraphML file format variants of our commercial yFiles diagramming libraries yFiles for Java 4.x, yFiles for JavaFX, yFiles.NET, yFiles WPF, and yFiles for HTML.
- Added support for importing node symbols with yEd's properties mapper. [Q&A 9287], [Q&A 9335]
Bugfixes
- Many bugfixes and improvements in yEd's layout algorithms.
yEd 3.23.1 - Changes Since 3.23
Bugfixes
- Fixed an error that occurred on Windows and macOS operating systems when copying (parts of) diagrams to the system clipboard.
yEd 3.23 - Changes Since 3.22
New Features
- Added new Auto Alignment tool that can be used to snap nodes to the same x- or y-coordinate.
Improvements
- Organic layout now supports integrated edge labeling and directed edges for substructures.
- Circular layout now supports star substructures.
- Added node types as an additional optimization criterion to the Radial layout algorithm. Nodes of the same type are more likely to be placed next to each other.
- Tabular layout now supports node arrangements that minimize the overall edge length.
Bugfixes
- Many bugfixes great and small.
yEd 3.22 - Changes Since 3.21.1
New Features
- Added new Compact Disk layout algorithm that places nodes tightly together.
Improvements
- Organic layout now supports group and tree substructures in addition to chains, stars, circles, and parallel substructures.
- Added new strategies for handling node labels to the Circular and Radial layout algorithms.
- Added new edge routing options to the Circular and Radial layout algorithms.
- Added node types as an additional optimization criterion to the Balloon layout algorithm. Nodes of the same type are more likely to be placed next to each other.
Bugfixes
- Stepping through layout settings with the tab key now selects editable values. [Q&A 23479]
- Many bugfixes great and small.
yEd 3.21.1 - Changes Since 3.21
Bugfixes
- Fixed an error that occurred after changing the display language in yEd.
- Fixed an error that occurred on Windows and macOS operating systems when copying (parts of) diagrams to the system clipboard.
yEd 3.21 - Changes Since 3.20.1
General
- The JREs that come with the Windows, macOS, and Linux installers have been updated to OpenJDK 15.0.2.
New Features
- Added node types as an additional optimization criterion to major layout algorithms. Nodes of the same type are more likely to be placed next to each other.
- Added new clustering implementations for the organic layout algorithm.
Improvements
- Improved edge routing for the orthogonal/polyline edge routing algorithm. The algorithm now tries to preserve existing orthogonal routes as much as possible.
Bugfixes
- Fixed problems with native file chooser dialogs on Windows.
- Fixed regression that prevented layout algorithms to properly connect edges to the visual bounds of nodes. [Q&A 21678], [Q&A 22046]
- Fixed regression that prevented pasting of nodes that were copied from inside a closed group node.
- Fixed inconsistent ordering of palette sections in the 'Add to Palette' context menu. [Q&A 19997]
- Fixed selection changes that sometimes occurred after running One-Click layout. [Q&A 22201]
- Many bugfixes great and small.
Removed Features
- Removed yEd's IconFinder client for importing symbols into user-defined palette sections. IconFinder no longer offers the service interface required for this feature.
- Removed the HTML Flash Viewer and SWF export formats. Both formats relied on Adobe™ Flash™ and thus could not be used as intended anymore.
yEd 3.20.1 - Changes Since 3.20
Security fixes
The new version includes fixes to a set of vulnerabilities, kindly reported by Dawid Czarnecki from NATO Cyber Security Centre (NCSC).
- Fixed XML External Entity injection that could be exploited when opening XML files (including GraphML). [CVE-2020-25215]
- Fixed code execution through XSL transformation when opening XML files together with custom stylesheets. [CVE-2020-25216]
Improvements
- yEd's icon set has been updated to modern SVG icons. Aside from looking great, these icons scale nicely on HDPI devices.
- Added support for additional labels in UML class nodes. [Q&A 17711]
Bugfixes
- Custom window layouts are now properly restored when restarting yEd. [Q&A 4627], [Q&A 7384], [Q&A 18580]
- Many bugfixes great and small.
yEd 3.20 - Changes Since 3.19.1.1
General
- The JREs that come with the Windows installers have been updated to OpenJDK 13.0.2.
The JREs that come with the Linux and macOS installers have been updated to OpenJDK 14.0.1.
New Features
- Added new Generic Curve Routing algorithm for routing edges.
- Added new Generic Edge Bundling algorithm for routing edges.
- Added new page rank algorithm for calculating centrality measures.
Improvements
- Added SHIFT+F2 (Windows/Linux) and SHIFT+ENTER (macOS) keyboard
shortcuts for yEd's 'Add Label' action.
Improved the initial position for additional labels.
Bugfixes
- Added input validation for many settings dialogs used for layout algorithms to prevent invalid values (such as e.g. negative distances) and subsequent algorithm errors.
- Fixed problems with incorrect additional white space in label texts when opening GraphML files with yEd running on Java 14. [Q&A 13283]
- Fixed problems with custom graph properties names 'url' or 'description' when working with multiple documents. [Q&A 16802]
- Fixed copy-pasting of "Edge Opposite: Dynamic" node label placement policy. [Q&A 15869]
- Many bugfixes great and small.
yEd 3.19.1.1 - Changes Since 3.19.1
General
- The JREs that come with the Windows and Linux installers have been updated to OpenJDK Java 13.0.1.
Improvements
- Improved and corrected import support for the GraphML file format variants of our commercial yFiles diagramming libraries yFiles for Java 4.x, yFiles for JavaFX, yFiles.NET, yFiles WPF, and yFiles for HTML.
Bugfixes
- Fixed problems with template mappings in yEd's properties mapper.[Q&A 16120]
yEd 3.19.1 - Changes Since 3.19
General
- The JREs that come with the Windows and Linux installers have been updated to OpenJDK Java 13.
Bugfixes
- Fixed lots of problems with printers on Windows by upgrading to Java 13.
- Fixed GraphML serialization of Unicode surrogate code units.[Q&A 14542]
- Fixed "No Color" entry for "Line Color" property of edges.[Q&A 14614]
- Fixed duplication of "Edge Opposite: Dynamic" node label placement policy when using the "Duplicate" action. [Q&A 15869]
- Many bugfixes and improvements in yEd's layout algorithms.
yEd 3.19 - Changes Since 3.18.2
General
- The JREs that come with the Windows and Linux installers have been updated to OpenJDK Java 11.0.2.
Improvements
- Improved support for display scaling on Windows operating systems.
- Added support for importing GEDCOM
NAMEsub-tags. [Q&A 14302]
Bugfixes
- Fixed lots of problems with printers on Windows by upgrading to Java 11.
- Fixed problems with the "Paste from System Clipboard" action on Linux operating systems.
- Fixed problems with CTRL+C/V/X shortcuts not working in textfields. [Q&A 14232]
- Fixed adding columns and rows to table nodes without insets. [Q&A 14285]
- Fixed incorrect selection results when using the "Data Property" criterion in the "Select Elements" tool. [Q&A 14201]
- Many bugfixes and improvements in yEd's layout algorithms.
yEd 3.18.2 - Changes Since 3.18.1.1
General
- Added action for pasting images from the system clipboard into yEd's editor area.
- Added context menus for copy/cut/paste operations to multi-line text fields.
Bugfixes
- Fixed problems with printers that support several different print resolutions on Windows.
- Added several print preview corrections.
- Fixed color chooser alpha channel support for Java 9 and newer.
- Many bugfixes and improvements in yEd's layout algorithms.
yEd 3.18.1.1 - Changes Since 3.18.1
Bugfixes
- Fixed 'NoSuchMethodError: <init>' problems that prevented yEd from starting on some Windows machines.[Q&A 13631]
- Many bugfixes in yEd's layout algorithms.
General
- The JREs that come with the Windows, macOS, and Linux installers have been updated to Java 10.0.2.
Additionally, Windows and Linux installers with embedded Java 8 runtime environments are available again for people experiencing problems with Java 10.
yEd 3.18.1 - Changes Since 3.18.0.2
General
- The JREs that come with the Windows, macOS, and Linux installers have been updated to Java 10.0.1.
Thus, the installer based versions of yEd require a 64-bit Windows/Linux operating system or
Mac OS X 10.10 (Yosemite) to run.
The zipped yEd Jar file may still be run on 32-bit Windows/Linux operating systems and Mac OS X 10.8/10.9 with an installed Java 8 JRE.
New Features
- Added new layout algorithm for Systems Biology Graphical Notation (SBGN) diagrams.
Improvements
- Added support for display scaling on Windows operating systems.
Bugfixes
- Addressed issues that could happen with the platform-native file chooser dialog on macOS and Linux.
- Many bugfixes, great and small.
yEd 3.18.0.2 - Changes Since 3.18.0.1
Bugfixes
- Fixed an exception that happened when calling the Tree Map layout algorithm on an empty graph.
yEd 3.18.0.1 - Changes Since 3.18
Bugfixes
- Addressed issues that could happen with the platform-native file chooser dialog on macOS and Linux.
yEd 3.18 - Changes Since 3.17.2
New Features
- Added new Tree Map layout algorithm that makes it easy to generate tree maps.
Improvements
- Many improvements of the One-Click Layout.
- yEd now uses the platform-native file chooser dialog on Windows, macOS, and Linux to improve the platform-specific user experience.
- The JREs that are installed by the Windows, macOS, and Linux installers have been updated to Java 1.8.0_162.
Bugfixes
- Many bugfixes, great and small.
yEd 3.17.2 - Changes Since 3.17.1
New Features
- Added new substructure support to the orthogonal layout algorithm.
- Added new swimlane layout algorithm for strictly tabular arrangements (see 'Layout' -> 'Swimlane' -> 'Tabular').
Improvements
- Improved and corrected import support for the GraphML file format variant used by yEd Live.
Bugfixes
- Added fix for missing menu bar on macOS High Sierra 10.13. [Q&A 11986]
- Added fix for excessive whitespace in label texts when running yEd on Java 9.[Q&A 12235]
- Many bugfixes, great and small.
yEd 3.17.1 - Changes Since 3.17
New Features
- Added new palette section for Systems Biology Graphical Notation (SBGN) glyphs. Additionally, added new arrow styles to support SBGN's 'catalysis' and 'necessary stimulation' arcs.
Improvements
- Improved and corrected import support for the GraphML file format variants of our commercial yFiles diagramming libraries yFiles for Java 4.x, yFiles for JavaFX, yFiles.NET, yFiles WPF, and yFiles for HTML.
- Improved the "Fit Node to Label" tool and the "Dynamically Adjust Node Size to Label Size" option with regards to resizing 'Entity with Attribute' nodes from the 'Entity Relationship' palette section and 'Class' nodes from the 'UML' palette section. [Q&A 7920], [Q&A 11651]
Bugfixes
- Added fix for crashes when opening a load or save file dialog on Windows 10 with Creator's Update installed. [Q&A 10681]
- Many bugfixes, great and small.
yEd 3.17 - Changes Since 3.16.2.1
New Features
- Added import support for the GraphML file format variants of our commercial yFiles diagramming libraries yFiles for JavaFX (3.x version series) and yFiles for HTML (2.x version series).
- The 'Find...' command and the 'Select Elements' tool now additionally support text matching using the full power of regular expressions.
Improvements
- Improved and corrected import support for the GraphML file format variants of our commercial yFiles diagramming libraries yFiles for Java (4.x version series), yFiles for JavaFX (2.x version series), and yFiles for HTML (1.x version series).
- The 'Apply' and 'Apply Type' commands from the Palette's context menu now also support converting normal nodes to open/closed group nodes and vice versa. [Q&A 10269]
- The JREs that are installed by the Windows, Mac, and Linux installers have been updated to Java 1.8.0_121.
Bugfixes
- Addressed a problem in the Excel import where importing spreadsheets with blanks/whitespace in sheet names failed. [Q&A 10230]
- Many bugfixes, great and small.
yEd 3.16.2.1 - Changes Since 3.16.2
Bugfixes
- Addressed an exception that happened on Windows and Mac OS X when trying to copy to the system clipboard.
yEd 3.16.2 - Changes Since 3.16.1
Improvements
- The UML class node representation now uses the same font for the attribute, method, etc. entries as is set for the class name.
Bugfixes
- The properties views now also list the additional shape node representations (stars, fat arrows, etc.) and allow changing their properties.
- Many bugfixes, great and small.
yEd 3.16.1 - Changes Since 3.16
New Features
- The Organic layout algorithm is able to automatically recognize regular substructures in a diagram and arrange them in an optimized manner depending on the kind of substructure. Four different kinds of substructures can be recognized: chains, stars, circles, and parallel substructures.
Improvements
- The JREs that are installed by the Windows, Mac, and Linux installers have been updated to Java 1.8.0_102.
Bugfixes
- Fixed a bug where self-loops in a diagram could cause the One-Click Layout to fail.
- Many bugfixes, great and small.
yEd 3.16 - Changes Since 3.15.0.2
General
This yEd version requires a Java 8 Runtime Environment (JRE) to run on, which isn't available for older operating systems (see also the Java 8 system requirements). Thus, yEd needs at least Windows Vista or Mac OS X 10.8 (Mountain Lion) to run.
New Features
- Added import support for the GraphML file format variants of our commercial yFiles diagramming libraries yFiles for Java 4.x, yFiles for JavaFX, yFiles.NET, yFiles WPF, and yFiles for HTML. With the yFiles for HTML format in particular, import of GraphML files written by the yEd Live web application is also supported.
- As a new option, the Hierarchical layout algorithm can take the thickness of an edge into account when calculating a layout for a diagram. Diagrams with thick edges in them can become wider and taller.
- As a new option, the Hierarchical layout algorithm can interpret edge direction according to the arrowhead.
- The integrated labeling in the Hierarchical layout algorithm places edge labels that specify a preferred placement at their source node or at their target node directly beside that node.
- Applying the Label Placement algorithm is now animated. Also, its execution can be canceled if it takes too long.
Improvements
- Additional sample node representations for nodes and group nodes in the 'Shape Nodes' and 'Group Nodes' palette section.
- The JREs that are installed by the Windows, Mac, and Linux installers have been updated to Java 1.8.0_92.
Bugfixes
- Many bugfixes, great and small.
yEd 3.15.0.2 - Changes Since 3.15.0.1
Improvements
- The yEd Windows installers are dual-signed (using SHA-1 and SHA-256 type certificates) so that they are recognized by Windows SmartScreen but still work on older Windows versions.
- The JREs that are installed by the Windows, Mac, and Linux installers have been updated to Java 1.8.0_74.
Bugfixes
- Fixed a problem in Orthogonal/Polyline Edge Routing where the first/last segment of a routed edge sometimes could overlap with a non-routed edge at the same node.
yEd 3.15.0.1 - Changes Since 3.15
Bugfixes
- Fixed Excel import.
yEd 3.15 - Changes Since 3.14.4
New Features
- The Circular and Radial layout algorithm as well as Balloon and all Directed Tree layout algorithms support a new edge routing style where edge paths are bundled to prevent visual clutter.
Bugfixes
- Disabled menu interaction on Mac OS X during layout runs to prevent accidental graph structure modifications.
- Many bugfixes, great and small.
yEd 3.14.4 - Changes Since 3.14.3
Improvements
- Performance improvements in the layout algorithms.
- Added support for Mac OS X two-finger pinch and zoom gestures (works with Apple Java SE 6 and JRE 8, but not JRE 7).
- The JREs that are installed by the Windows, Mac, and Linux installers have been updated to Java 1.8.0_60.
Bugfixes
- Fixed the NullPointerException in the palette that occurred when trying to import icons from IconFinder into a yet-to-be-created palette section.
- Many other bug fixes as well.
yEd 3.14.3 - Changes Since 3.14.2
Bugfixes
- Many bugfixes, great and small.
yEd 3.14.2 - Changes Since 3.14.1
Improvements
- The JREs that are installed by the Windows, Mac, and Linux installers have been updated to Java 1.8.0_45.
Bugfixes
- Many bugfixes, great and small.
yEd 3.14.1 - Changes Since 3.14
New Features
- The new Remove Node Overlaps tool can be used to automatically move nodes so that overlaps are removed and all nodes have a specified minimum distance.
- The Hierarchical layout algorithm features new support for grid placement of nodes and edges.
Also, a new layout option provides stacked placement of nodes within the same layer.
Improvements
- Many improvements related to the connection handling of the One-Click Layout plugin.
- The JREs that are installed by the Windows and Linux installers have been updated to Java 1.8.0_40.
Bugfixes
- Corrected an issue with accessibility settings on Mac OS X reported as
java.lang.ClassCastException: y.I.fB cannot be cast to javax.swing.tree.TreeNode - Addressed several problems that could occur when printing from the print preview.
- Fixed value handling in the printing settings and export settings dialogs. Zero values and no values are gracefully dealt with now.
- Many other bug fixes as well.
yEd 3.14 - Changes Since 3.13
New Features
- With the new One-Click Layout service getting a nice layout for your diagrams has become even easier:
Just click the button in the toolbar and let this service analyze your diagram and choose an automatic layout algorithm for you that is then used to arrange your diagram. That's all!
The service takes into account a diagram's structure as well as features like edge routing styles to base its decision on.
(One-Click Layout is under ongoing development. With your feedback, we will constantly improve and update this service, independent of yEd releases.) - The new series-parallel layout algorithm lends itself perfectly for a special group of diagrams that often arise in circuit diagrams and flowcharts.
- Added a new anonymization tool to remove any identifying information from a diagram.
Improvements
- The maximum number of elements displayed in Local Views is now configurable. [Q&A 298], [Q&A 6108]
- Elements within top-level Swimlane Nodes or Table Nodes are properly displayed in Local Views.
- The JREs that are installed by the Windows and Linux installers have been updated to Java 1.8.0_25.
- For Mac OS X, there are now two installers available. One for Mac OS X 10.7 or higher (with a bundled JRE 7), the other for OS X 10.8 or higher (with a bundled JRE 8).
Note: Since Java 7 requires Mac OS X 10.7 at least, users of earlier OS X versions should download the yEd Zip archive. - Added sample graphs for the new series-parallel layout.
Bugfixes
- Added a fix for the
sun.awt.X11.XException: Cannot write XdndAware propertyissue on Linux systems. - Many other bug fixes as well.
yEd 3.13 - Changes Since 3.12.2
New Features
- New support for multi-parents in the Directed tree layout algorithm.
This enhancement to the Directed tree layout automatically recognizes and then arranges side-by-side multiple parents of a node, a structural configuration that normally is not allowed in a tree structure. - The JREs that are installed by the Windows and Linux installers have been updated to Java 8.
Note: Since Java 8 is not supported on Windows XP, XP users should download a yEd installer without JRE. - On Mac OS X, yEd now uses its own embedded Java 7 JRE.
Note: Since Java 7 requires Mac OS X 10.7 at least, users of earlier OS X versions should download the yEd Zip archive. - New support in the Properties Mapper dialog to import and export configurations. [Q&A 4848], [Q&A 3747], [Q&A 3575]
Improvements
- Enhanced the support for non-tree graphs in the tree layout algorithms. Non-tree graphs are automatically accepted and appropriately handled.
- Added support for importing JPEG image files using CMYK or YCbCr color models into the palette. [Q&A 2491]
- Improved browser selection mechanism on Linux systems that takes into account a user's default browser configuration. [Q&A 4659]
- The GEDCOM import additionally supports an alternative, simpler node visualization style.
- Updated IconFinder communication using new request parameters.
- Made the error reporting tool more robust.
- Added sample graphs for the radial layout and the multi-parent support in the Directed tree layout algorithm.
- The Mac installer now provides a true Mac drag-and-drop installation experience.
- Several smaller improvements to the application's user interface (text in dialogs).
Bugfixes
- Addressed the
java.lang.ArrayIndexOutOfBoundsException: at apple.awt.CWindow.displayChangedissue on multi-monitor Mac systems running Apple Java SE 6. - Many other bug fixes as well.
yEd 3.12.2 - Changes Since 3.12.1
Bugfixes
- Fixed a regression introduced in yEd 3.12.1
yEd 3.12.1 - Changes Since 3.12
Bugfixes
- Fixed a regression introduced in yEd 3.11.1 in the "Select Elements" tool where the results of the various 'Select edges at selected nodes' queries were incomplete. [Q&A 4343], [Q&A 4368]
- Improved clipboard behavior when yEd can't access the
vectorgraphics.jarfile. - Addressed an issue where a missing GraphML encoding of a group node's closed state representation could result in an exception.
- Improved undo behavior of interactive move node gestures. Bends that were removed as a result of a node being moved over them are now restored on undo.
- Many other bug fixes as well.
yEd 3.12 - Changes Since 3.11.1
New Features
- Added support for aborting automatic layout algorithms.
- New alignment options in the Balloon style tree layout algorithm.
- New swimlane support of organic layout algorithm.
- New node label and edge label layout options in the Balloon style tree layout algorithm.
- Intuitive mouse gesture to change node representations in the editor window by Shift-dragging the new node representation from the palette onto them.
Improvements
- Added node label and edge label selection options in the "Select Elements" tool.
- Added hierarchy-related selection options in the "Select Elements" tool to enable selecting child nodes or selecting parent group nodes.
- The Properties View also shows properties of edge bends.
- Added alignment options to the printing setup dialog that enable center-aligned and side-aligned printing.
- Cyclic selection also works for table nodes now, which enables selecting the column labels and row labels.
- Switched to platform-specific text anti-aliasing support. This enables subpixel text anti-aliasing on platforms that support this.
- Added support for custom properties to XML+XSL import.
- Updated the descriptions of layout algorithms (Partial Layout, Orthogonal Layout).
- Many smaller improvements to the application's user interface (text in dialogs).
Bugfixes
- Addressed a possible issue when changing the representation of a group node.
- Corrected PNG export options.
- Addressed an issue of the Excel import where property names of edges weren't properly handled.
- Corrected problems with localized text in print settings and some of the layout algorithm dialogs.
- Fixed an issue where closing an editor tab could result in an exception.
- Fixed an issue that could result in:
IllegalArgumentException: No resolver found in RepositoryNode{name='Description', path='Description'} - Corrected a problem of full screen mode where the details threshold was not taken into account.
- Corrected an issue in the "Fit Node to Label" command that could grow group nodes indefinitely.
- Fixed an issue in the "Select Elements" tool that could occur when selecting colors.
yEd 3.11.1 - Changes Since 3.11
New Features
- New edge style that draws the outline of an edge path.
Bugfixes
- Addressed a severe incompatibility introduced with JRE 1.7.0_25 that caused a
java.awt.image.ImagingOpException: Unable to transform src imageexception when yEd was run using this JRE version (Windows and Mac OS X systems). The exception appeared when displaying a diagram with SVG nodes. [Q&A 2841] - Fixed communication issues with www.iconfinder.com. [Q&A 3041]
- Many other bug fixes as well.
yEd 3.11 - Changes Since 3.10.2
New Features
- New layout algorithm for radial layout that places nodes in a concentrical fashion.
- New support for importing group nodes from Excel spreadsheet files. [Q&A 497]
Bugfixes
- Addressed a severe incompatibility introduced with JRE 1.7.0_25 that caused a
java.awt.image.ImagingOpException: Unable to convolve src imageexception when yEd was run using this JRE version (Windows and Mac OS X systems). The exception appeared from any attempts to work with the palette. [Q&A 2841] - Corrected the resizing behavior of table headers in table/swimlane nodes.
- Fixed an issue in the XSL stylesheet file for importing Ant build files where edges for multiple 'depends' relations were not properly generated. [Q&A 2674]
- Importing an icon of unsupported image format (e.g. TIFF) no longer gives an exception.
- Fixed a problem in the 'Current Elements' section of the palette where the currently active default representations of nodes/edges were not properly indicated.
- Corrected an issue of the Excel import where adopting data from an Excel spreadsheet file could result in an exception when there was nothing selected in the sheet/table preview.
yEd 3.10.2 - Changes Since 3.10.1
New Features
- Added a straight-line edge routing algorithm to the 'Layout' menu.
- Group nodes, both open and closed, can now be used as a selection criterion in the Select Elements... tool.
Improvements
- Improved regular expression support in the Properties Mapper dialog.
- Improved feedback for error conditions when saving to YGF file format.
Bugfixes
- Fixed issues where PDF export failed on Mac OS X 10.7 (Lion) and 10.8 (Mountain Lion) when running yEd via Java Web Start using the Oracle Java 7 JRE.
- GEDCOM import now properly handles files with blanks in their name. [Q&A 2251], [Q&A 2258]
- Corrected the enabled/disabled state of the 'Save' command.
- Corrected an issue where the end points of incident edges were not adjusted when a node was manually resized.
- When using the Select Elements... tool to select elements in the diagram, the modified/unmodified state of the diagram is no longer affected.
yEd 3.10.1 - Changes Since 3.10
Improvements
- Enhanced the Properties Mapper dialog to support the built-in URL and Description properties as sources for mapping.
- The Structure View can show values of the built-in URL and Description properties also.
Bugfixes
- Several bugs fixed, including text orientation issues with PDF export [Q&A 2139].
yEd 3.10 - Changes Since 3.9.2
New Features
- Added a new edge routing algorithm that can generate orthogonal edge paths as well as octilinear edge paths. The new octilinear style is a variation of the orthogonal edge routing style where diagonal transitions connect the horizontal and vertical segments of an edge.
- Added support for octilinear edge paths to the hierarchical layout algorithm.
- New configuration support in the properties table/properties dialog for preferred placement options and preferred rotation behavior for edge labels.
- Introduced a new edge split gesture where a node dragged from the palette and dropped onto an edge in the canvas automatically splits the edge in two and inserts the node as an intermediate stop connecting the two edges. [Q&A 123]
- Added support for scrolling the canvas using the mouse wheel. [Q&A 596]
Improvements
- Enhanced the printing dialog with support for adding a footer to the print-out of a diagram.
- Enhanced the printing dialog with an option to place the header/footer on each page of the print-out of a diagram.
- The resizing behavior of nodes in a diagram when changing their width/height in the properties dialog/table is now configurable in the Preferences dialog. Options include resizing from upper left corner and resizing from center.
- A new option in the Preferences dialog configures automatic 'fit content' behavior after resizing the canvas.
- The Mac installer file is now properly recognized by Mac OS X 10.8 (Mountain Lion) to come from a trusted source. [Q&A 1487]
Bugfixes
- Lots of minor bug fixes and improvements.
yEd 3.9.2 - Changes Since 3.9.1
New Features
- Added support for specifying the header size of columns and rows in table nodes.
Bugfixes
- Fixed an issue that resulted in NullPointerExceptions in dialogs where colors can be specified (e.g., Find... dialog, or the UML layout algorithm).
- Fixed several errors that resulted in InvocationTargetExceptions and IllegalStateExceptions.
- Many other minor bugfixes.
yEd 3.9.1 - Changes Since 3.9
New Features
- Added BPMN 2.0 Artifact and Conversation elements and enhanced Task and Marker support of Activity elements.
Improvements
- Greatly optimized yEd's memory usage.
- Enhanced the GEDCOM import with support for reading IDs containing non-alphanumeric characters.
Bugfixes
- Fixed invalid label bounds errors, reported as "IllegalArgumentException: Invalid label bounds: y.J.M[anchorX=NaN;anchorY=NaN;width=...;height=...;upX=...;upY=...]", for example.
- Corrected an error that prevented layout of flowcharts with group nodes, reported as "IllegalArgumentException: Graph contains group nodes with zero width/height. Please enlarge those nodes manually or by using LayoutStage y.layout.MinNodeSizeStage."
- Corrected an issue in the Properties Mapper dialog where a single template setting was not properly restored on reopening.
- Corrected the update behavior of mapping details after switching the source of a discrete mapping in the Properties Mapper dialog.
- Fixed a rare issue that manifested as a ClassCastException when working with the Structure View.
- Fixed errors reported in the yEd forum: [Q&A 651], [Q&A 695]
yEd 3.9 - Changes Since 3.8
New Features
- The new SmartFree label models make interactive placement of node labels and edge labels easier than ever. They combine free placement with support for interactive snapping to dedicated positions like, for example, the border of nodes and the middle of an edge.
Further improvements include support for automatic edge label rotation corresponding to the direction of a label's associated edge segment, and fixed as well as proportional node label alignment with node borders. - Enhanced GEDCOM import with new support for ANSI, ASCII, UTF-8, and UTF-16 file encodings. A broad range of common GEDCOM data records is imported as custom properties. [Q&A 275], [Q&A 435]
- Enhanced BPMN 2.0 support with palette symbols for all Event, Gateway, and Activity Markers. [Q&A 109]
- Added a new dedicated layout algorithm for flowchart diagrams.
Improvements
- Rendering of the group state icons is configurable in the Preferences dialog. It can be turned off, either only for exporting or for all views. [Q&A 83]
- Simplified entering and editing of color values: it's now possible to type and to copy/paste them. Also, hexadecimal values (like
#3399FF) are supported as well. - The Family Tree layout algorithm produces better results for complicated family ties and is, in general, more stable with respect to the GEDCOM input data.
- Even for small zoom factors, the graph view always paints the true shape of Shape nodes and the true path of curved edges. Similarly, the overview now paints the true shapes and paths of these elements, too.
- Context views display the groups containing selected nodes, if the new setting 'Hierarchy Aware' is enabled in the Preferences dialog.
- The display time of tooltips is customizable in the Preferences dialog. [Q&A 191]
- Rendering the currently selected elements in the foreground can be turned off in the Preferences dialog.
- Analogous to custom properties of nodes, all custom properties of edges are considered by a copy/paste operation. [Q&A 342]
- The Duplicate command works for node labels and edge labels, too.
Bugfixes
- Improved compatibility with Java 7 and OpenJDK which resolves errors like 'Could not initialize class org.freehep.graphicsio.ImageGraphics2D' and 'java.lang.ExceptionInInitializerError'.
- Corrected an error in the Centrality tool which resulted in a NullPointerException.
- Corrected an error in the Excel import which required the node list data range to start in the first column of a sheet.
- Various corrections in all layout algorithms.
yEd 3.8 - Changes Since 3.7.0.2
New Features
- Initial support for shapes from Microsoft Visio. The Import Section... and Import Symbol... commands of the palette can now convert stencils of Visio XML files (*.vsx, *.vdx) into node symbols. From there, you can use these symbols like symbols of any other type as templates for creating nodes in your diagram.
- Launched new online support resources: the yEd manual is now available online, as is a new forum where you can ask yEd-related questions or tell us your most wanted yEd feature requests.
Improvements
- Added missing Flowchart symbols for End Loop, User Message, and Network Message.
Bugfixes
- Fixed the error that caused the Add Child command and the Duplicate command to freeze yEd.
- Resolved various other errors and problems.
yEd 3.7.0.2 - Changes Since 3.7.0.1
Bugfixes
- Fixed a label-related regression that manifested for specific label models when trying to open the label's properties dialog, for example.
yEd 3.7.0.1 - Changes Since 3.7
Improvements
- Added context menu commands to conveniently remove single elements/all elements from user-defined palette sections.
- Re-introduced context menu command to reset defaults in palette sections.
- Through a command-line switch, the cross-platform Look-and-Feel can be used to avoid illegible menu entries with non-standard system-wide menu font colors.
Bugfixes
- Many bugfixes, great and small.
yEd 3.7 - Changes Since 3.6.1.1
New Features
- The new Palette Manager provides a comfortable means to manage palette sections. It allows to define which sections to display in yEd and the order in which the sections should be arranged. Additionally, the Palette Manager also allows to create new sections, change the content of existing sections, and import/export sections as GraphML files. Finally, it enables import of images and/or SVG symbols into user-created palette sections.
- The new Properties Mapper is a powerful tool to visualize custom properties of a graph's nodes and edges. It enables turning user-defined additional data that is stored with graph elements into visual properties of the corresponding elements, like, e.g., their line width, fill color, label text, width, line type, ...
- A new interface for conveniently using the IconFinder icon search engine from within yEd allows importing symbols (live from the Internet) into user-created palette sections.
- Added a new palette section that supports Entity Relationship diagrams (ERD). In particular, this new section provides edges with domain-specific arrowheads and adornments for Crow's Foot notation.
- New palette sections with vector graphics (SVG) symbols for computers/network devices and for people.
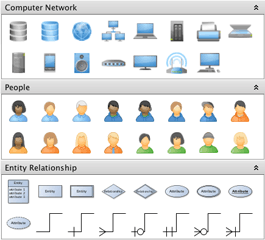
New palette sections
Improvements
- The Structure View tool window now supports searching in custom node properties. As a by-product, custom node properties can also be displayed and edited in the Structure View.
- Added support for PNG image export with transparent background.
Bugfixes
- Addressed an SVG import issue where umlauts were broken despite UTF-8 encoding of the file.
- Fixed "IllegalArgumentException: offsetLimit must be after current position" that could occur for CroppingLabel configurations.
- Fixed "/ by zero" error that occurred when double-clicking into an editor with a very low zoom level.
- Fixed "IllegalArgumentException: fromKey > toKey" that could occur when working with the Palette.
- ...and some more.
yEd 3.6.1.1 - Changes Since 3.6.1
Bugfixes
- Fixed a regression which affected, for example, the labels of a UML class node (stereotype, constraints, methods).
yEd 3.6.1 - Changes Since 3.6
New Features
- New auto-rotation and auto-flipping support for edge labels. Edge labels can be configured to stay parallel to their corresponding edge segment, even in a dynamic scenario where the slope of the edge segment changes.
Auto-flipping automatically flips the presentation of a label when it is upside-down, thus ensuring that users can understand the textual information in rotated labels. - A new bus-style edge routing algorithm can be used to combine the edges in parts of a diagram where each node is connected to each other node. It produces edge paths that together form a concise, tree-like structure consisting of vertical and horizontal line segments.
- Local views, like, e.g., the Neighborhood view of a diagram, can be turned into documents of their own right. A new command in the context menu of local views enables this conversion.
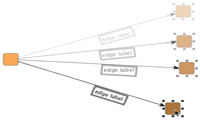
Auto-rotating edge label
Improvements
- When moving a label, the box that indicates where it will be positioned after releasing the mouse button is now highlighted.
- Editor tabs now have each a small close icon: [X].
- Added new option in the label properties that enables underlining a label.
- Saving a diagram no longer deletes/resets the undo queue.
- Copying (parts of) a diagram to the clipboard now also copies the current background of the active editor. This behavior is now similar to exporting (parts of) a diagram.
- The markers of selected elements are no longer present in exported bitmap images or vector graphics. The previous behavior can be restored using a corresponding option in the respective export dialogs.
- Mouse double clicking when in Navigation Mode now toggles between zooming in on the view and restoring the previous zoom factor.
- Changed keyboard shortcut for switching to Full Screen presentation on Mac OS X to Command-Option-F. The previous shortcut conflicted with the Mac OS X keyboard command for minimizing the active window to the Dock.
- Changed keyboard shortcuts for switching to Edit Mode and Navigation Mode on Windows and Linux to Ctrl-Shift-E and Ctrl-Shift-W, respectively. This freed Ctrl-Shift-S to be used for the "Save As..." command.
- The rounded corners of BPMN symbols now use a fixed radius.
- Improved label selection behavior of Area Selection with Shift button pressed.
Bugfixes
- Fixed NullPointerException that occured when typing into the search field of the Structure View without any open document.
- Addressed problems with SVG nodes sometimes not printing.
- Fixed "java.lang.ClassCastException: java.lang.String cannot be cast to B.A.B.A.A.F" exception which occurred for some BPMN graphs.
- Fixed "/ by zero" errors in Colorize Graph tool.
- Fixed "java.lang.IllegalStateException: path without any coordinates" exception.
- Fixed IllegalArgumentException which occurred when setting the straightness of a quadcurve edge to a value outside the legal range of 0.0 to 1.0.
- Corrected printing behavior when using 'Landscape' orientation.
- Corrected multi-selection issues when changing the colors of graph elements that had different colors.
- ...and many more.
yEd 3.6 - Changes Since 3.5.0.2
New Features
- A specific layout algorithm for BPMN (Business Process Modeling Notation) was added that lets you arrange your BPMN diagrams faster than ever.
This dedicated automatic layout algorithm supports BPMN diagrams with or without pools, and calculates a clear representation of your diagram both from scratch or using a given arrangement as sketch. - Multiple labels per node are now supported by the user interface.
- Labels now support an icon which can be used stand-alone or in combination with the label text.
- Labels now also support bold and italics font styles.
- New convenient support to instantly convert nodes to labels and vice versa.
- As a new option, labels of open and closed group nodes (also called folder nodes) can automatically use the same text.
- The user interface now supports selection cycling of graph elements that are stacked on top of each other by means of CTRL-mouse clicking [Mac OS: Option-mouse clicking].
- Nodes that are being dragged are now by default drawn on top of other graph elements. The same holds for selected nodes in general.

Use multiple (icon) labels
to compose your node presentation
Improvements
- The yEd application settings are now stored in OS-specific places and the directory name was changed from
.yed3toyEd. Existing settings are copied to the new location on first use. On Windows versions, the new location is within the Application Data directory. On Mac OS X, it is/Users/yourUserNameHere/Library/yWorks/yEd, and on Unix/Linux, it isyourUserNameHere/.yEd. - More symbols added to the BPMN (Business Process Modeling Notation) and the Flowchart section of the palette.
- The duration of the morphing animation for layouts can be set in the preferences.
- Improved handling of mouse selection and the Select All command.
Bugfixes
- Addressed printing problems which manifested as "PrinterException: Invalid name of PrintService."
- Fixed an inconsistent state during graph creation which resulted in "EdgeRealizer not yet created!" messages.
- Fixed a bug in Excel® XLS (spreadsheet data) import.
- Corrected an issue in Excel® XLS (spreadsheet data) import which resulted in "No URL given" messages.
- The printer page format is now also persisted between sessions.
- Addressed broken PDF export of some BPMN node representations.
- Fixed PDF export of UML Class node representations which could result in black boxes.
- Fixed an error which prevented the import of some SVG symbols ("The current document is unable to create an element of the requested type").
- The "Colorize Graph" and "Centrality" tools sometimes did not use the specified boundary colors.
- Addressed an issue with duplicated edges in GraphML files, which were caused by specific nested group nodes.
- When importing a TGF file, the current node and edge symbols from the palette are used.
- Fixed several errors which occurred if an edge was deleted while another action, e.g. a bend movement, took place.
- Prevented a skip at the beginning of the morphing animation of layouts.
yEd 3.5.0.2 - Changes Since 3.5.0.1
Improvements
- Abnormal low application responsiveness of installed yEd versions on some Linux flavors has been rectified.
- The "Go to URL" command now also works for elements of unsaved diagrams.
- Changed the default installation folder on Mac OS to /Users/Shared/yWorks/yEd to allow installation without administrator permissions.
Bugfixes
- Addressed issues introduced in yEd 3.5.0.1 where graphics of SVG nodes were missing when exporting the diagram to SVG.
- The contents of context views are correctly displayed again when inside a folder node.
- Fixed NullPointerException that could occur when using the Centrality Measures tool.
- Corrected the behavior of the "Go to URL" command when only bends are selected.
- Addressed printing issues when printing repeatedly with a changing print environment.
- Fixed IllegalStateException "No view mode found where the child mode could be added" that could occur when activating Area Zoom.
- Fixed an issue where the relative position of ports at a node were not properly maintained when the node size changed due to the "Dynamically Adjust Node Size to Label Size" option from the preferences.
- Addressed an issue where some icons in the top right corner of the file dialog on Windows 7 were not correctly displayed.
- Fixed a NullPointerException that could occur during import of Excel spreadsheets.
- Selecting the "Area Zoom" command in the middle of an edge creation now properly cancels the edge creation gesture.
- Fixed a NullPointerException that could occur when opening the Welcome dialog.
- Corrected the saving of port constraints in GraphML files which was broken since yEd 3.5.
- Fixed a NullPointerException that could occur when the Apply button in a floating window of a layout algorithm was repeatedly clicked.
- Executing a layout or a tool when there is no graph document present no longer throws an exception.
- Importing bipartite graphs from Excel spreadsheets no longer generates an additional isolated node. Also, the information fields show the correct element counts for this type of graph.
- Fixed an exception that was triggered by the setting "Use Natural Clustering" of the Smart Organic Layout. Also, help was added for this setting.
- Natural Clustering now handles multiple edges and self-loops correctly, which prevents a NullPointerException.
- Fixed a rare issue with Circular Layout which could occur for certain graphs when using "Use Drawing as Sketch."
- Fixed a rare issue with Hierarchical Layout which could occur when using compact component arrangement.
yEd 3.5.0.1 - Changes Since 3.5
Bugfixes
- The "Bad version number in .class file" problem that affected early downloaders of yEd 3.5 with JRE 1.5 has been addressed.
- Direct printing, i.e., without using the print preview, now works again.
- Fixed a problem with EMF export that manifested itself especially when exporting diagrams that used BPMN symbols. On Windows, the problem could also happen when copying such diagrams to the system clipboard.
yEd 3.5 - Changes Since 3.4.2
New Features
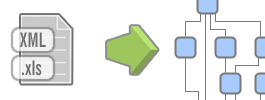
- Support for import of Microsoft Excel® files to create graphs. A comprehensive import dialog allows to comfortably specify graph data in spreadsheets. Graph structure and labels, as well as arbitrary user-defined properties for nodes and edges can be imported easily.
The dialog also allows to choose the visual representation of nodes and edges and the layout algorithm to compute an initial layout of the imported data. - New section in the Palette tool window that provides high-quality symbols for the Business Process Modeling Notation (BPMN).
- Support for arbitrary, user-defined properties for nodes and edges of a graph, and the graph itself. New properties are displayed in the "Data" section of the Properties view, and are accounted for when saving and loading graphs (GraphML file format).
- New support for partial layout of diagrams. Selected parts of a diagram can be arranged without destroying the layout of the non-selected remainder.
- Added "Add Child Node" command to the Edit menu. This command allows to add a new node to the graph that is connected to all selected nodes of the editor window.
Excel import
BPMN diagram
Improvements
- The "Layout Parallel Edges" tool now provides several configuration options. They allow, for example, to specify the distance between parallel edges, choosing a "master" edge, or restricting the effect to a subset of edges.
- Added new options to the directed tree layout algorithm that allow to specify the arrangement of a tree's leaf nodes.
- Added several configuration and presentation options to the "Auto Grouping..." tool and moved it to the Grouping menu.
- Print and print preview settings persist during yEd sessions and between sessions.
- A visual indication is drawn around possible target group nodes when re-parenting a node, i.e., moving a node into a group node, respectively from one group node into another.
- Switching the selection from nodes to edges and vice versa has been simplified. No extra mouse click is necessary.
- yEd now starts up with an empty document already open.
- Sending feedback no longer requires a subject. Also, the email address persists now.
- Removed the "Refresh" command from the View menu.
- Support for reading the graph structure from GraphML files with port information in it (as written by yFiles FLEX, or yFiles for Silverlight, for example).
Bugfixes
- Corrected "Apply Type" command in the palette to no longer overwrite the Description and URL attributes of graph elements.
- Opening multiple files in a single yEd instance now also works on Windows 7.
- Fixed several errors in EMF export.
- Addressed an issue where an editor window could end up in an inconsistent state due to the popup menu that enables removing rows/cols of table nodes.
- Addressed an issue where an editor window could end up in an inconsistent state after deleting a selected label.
- Fixed inconsistent behavior where empty group nodes got an incorrect position upon opening.
- Fixed inconsistent behavior where selected node labels did not follow the mouse while being moved.
- The export dialog for SVGZ file format (Zip-compressed SVG) has been localized.
- Worked around a JDK bug on Windows which manifests as a crash when trying to open a file ("sun.awt.shell.Win32ShellFolder2").
yEd 3.4.2 - Changes Since 3.4.1
New Features
- Reintroduced the grid, which now works together smoothly with snap lines and orthogonal edges.
- The Go to URL (F8 [Mac OS: Cmd-L]) command now supports relative URLs.
- Label editing can be conveniently initiated by double-clicking a label.
- Added a search field to the structure view.
- Added configuration option in the preferences for newline creation in multi-line labels: Enter vs. Shift-Enter.
- Added configuration option in the preferences for viewport adjustment while/after layout morphing. Available policies are: fit content vs. keep focus.
- The graph coloring tool provides additional options.
- Added "Apply Type" command for graph elements in the palette.
- Added "Center Selection" command.
Improvements
- The Go to URL (F8 [Mac OS: Cmd-L]) command now opens referenced GraphML files in a new yEd tab across all platforms, i.e., independent of Operating System support.
- The structure view automatically scrolls to show the currently selected node(s) of the active editor.
- Context views are additionally updated when an edge is created.
- On Mac OS, the irritating rectangle that indicates a drag operation from the palette to the active editor is now suppressed.
- The Navigation Mode supports an alternative mouse-drag navigation gesture.
Bugfixes
- Fixed a problem where the Description and the URL attribute were ignored when dragging nodes/edges from the palette into the active editor.
- Corrected handling of default values for the preferences. Resetting preferences to defaults should put yEd in the same preferences state as if it was started the very first time.
- Addressed an issue where copying/pasting from one editor to another sometimes failed.
- The View Mode toggle buttons in the tool bar should no longer be both deselectable.
- Corrected inconsistent group node sorting behavior in the structure view upon graph loading.
yEd 3.4.1 - Changes Since 3.4.0.2
New Features
- Added new "Flowchart" section to the Palette tool window that provides high-quality flowchart symbols.
- New 'Duplicate Selection' action (CTRL-D [Mac OS: Command-D]).
Improvements
- SVG export no longer ignores bridges and background.
- New 'Import Symbols...' action that allows to easily import visual representations for nodes.
- Edges connecting child nodes of a group node are no longer invisible if draw nodes over edges is activated.
- The Report tool dialog is no longer modal, i.e., it is possible to check some settings while writing a report.
- Added edges with arrowheads to "Edge Types" section of the Palette tool window.
- Added two flowchart sample graphs, plain and with swimlanes (problemsolving.graphml and studentRegistration.graphml).
- HTML Flash Viewer export supports table and swimlane nodes, and flowchart symbols.
Bugfixes
- Typing the NumPad keys "+", "-", or "/" into a text field in the Properties view no longer triggers a zoom action.
- Fixed NullPointerException in findMouseInputEditor.
- Applying a node template from the palette to a selected node now honors minimum size constraints of the template, i.e. applying a table node template to a tiny selected group node no longer shrinks the table node too much.
- Fixed 'URI scheme is not "file"' exception.
- Fixed occasional NullPointerExceptions while trying to save a file.
- No more StringIndexOutOfBoundsException in ImageMapOutput when the
${DIAGRAM}element in the HTML page template was deleted. - Addressed inconsistent creation behavior for swimlane nodes. It is no longer possible to add swimlane nodes to the graph that cannot have child nodes.
- Fixed a rare bug which caused yEd to hang on startup on some systems.
- Fixed bug "Unknown String value for enumeration" related to GraphML I/O.
- Added workarounds for Java bugs in the file chooser dialog on Windows ("Could not get shell folder ID list").
yEd 3.4.0.2 - Changes Since 3.4.0.1
Bugfixes
- Fixed version check.
yEd 3.4.0.1 - Changes Since 3.4
Improvements
- The improved edge routing that is applied after closing or opening a group node now takes all edges into account where the segment connecting to the group node is vertical/horizontal.
- Width and height fields in the properties view now honor node size constraints (e.g. for Swimlane/Table nodes). Size constraints are also honored by the section "Current Elements" of the palette.
- Nodes can no longer be set to have zero width or height.
- Swimlane/Table nodes from the palette no longer have a predefined text in their tooltip.
Bugfixes
- Fixed issue with exporting/saving diagrams to files with spaces in their name or in the file's path.
- Corrected GraphML output so that files can be read with yEd 3.3 again.
- Enabled editing empty column labels/row labels in a Swimlane/Table node using the F2 key [Mac OS: ENTER].
- When importing files using the XML/XSL support with one of the predefined XSL templates, the node sizes are adjusted to the length of their labels again.
- Trying to export a diagram with Swimlane/Table nodes in it to GML or XGML format no longer causes an application exception.
- Fixed issue where not all edge group constraints were correctly restored after saving/loading a diagram to/from GraphML format.
- Addressed artifacts when morphing the layout of a diagram with Swimlane/Table nodes.
- Fixed issues with malformed or empty image files that could occur when saving a GraphML file or when dragging into the active editor.
- Fixed a painting issue with SVG icons and incorrect node sizes when using SVG files.
- Addressed incorrect behavior of the Scope setting in the organic layout algorithm.
- Fixed application exception that could occur with damaged application settings files.
- Fixed an issue where image files that have been dragged into the active editor were not released by yEd, which prevented modifying/deleting such images in Windows Explorer.
yEd 3.4 - Changes Since 3.3.0.2
New Features
- New comprehensive support for Swimlane diagrams has been added which comprises visual representation, user interaction, and support for automatic layout.
Swimlane diagrams can be easily modeled using the new swimlane nodes from the palette which provide representations for rows and columns to which other nodes (group nodes also) can be added. Rows and columns can be interactively added, removed, resized, reordered, and also nested.
The nodes from a Swimlane diagram can be automatically arranged by a new dedicated Swimlane layout algorithm. - Four new tool windows, so-called context views, have been added that display specific information related to selected nodes or edges, including neighborhood, predecessors, successors, and the contents of folder nodes.
- A new tool has been added that can check whether a newer version of yEd is available for download from the yWorks website.
- New paste behavior allows to paste subgraphs directly into selected group nodes.
- Links to the yWorks home page and to the section with yEd-related articles in the yWorks Knowledge Base have been added to Help menu.
- Port constraints and edge groups are now persisted when the graph is saved to GraphML file format.
Improvements
- Additional style properties for modern nodes can now be changed.
- Improved edge routing after closing and opening group nodes.
- The yEd Help has been updated.
Bugfixes
- Addressed a Mac OS X/Java 6 combo box selection problem where re-selecting the currently selected item from a list resulted in an application crash.
- Toggling between navigation mode and edit mode no longer resets the edit mode's configuration.
- Fixed problems with SVG nodes when printing in landscape orientation.
yEd 3.3.0.2 - Changes Since 3.3.0.1
Bugfixes
- Fixed several undo-related issues, for example in conjunction with group node creation, and going into and out of group nodes.
Improvements
- JIDE version update.
- Reporting tool enhanced.
yEd 3.3.0.1 - Changes Since 3.3
Bugfixes
- Fixed NPEs that could happen after the very first right mouse button release if the user is in Zoom To Area mode.
- Fixed NPE that happens if the user tries to change the application preferences while not in Edit Mode.
- Improved Report tool to not come up for expected exceptions (saving to read-only filesystems, malformed URLs, etc.)
- Fixed creation of self-loops with the Arc edge style leading to NPEs in orthogonal edge creation mode.
- Fixed exception that corrupted the graph structure that happened after undoing/redoing hierarchy operations.
Known Issues
- The Look and Feel for Mac OS X is broken for 64bit JDK 1.6 - switch to JDK 1.5 instead in the meantime.
yEd 3.3 - Changes Since 3.2.0.1
New Features
- New support for so-called snap lines enables instant alignment of graph elements and makes editing a diagram easier than ever.
When moving or resizing graph elements, the mouse snaps to suitable coordinates where other graph elements have their borders or centers and rests for an instant. Indicative lines are displayed to provide the user with an additional visual feedback.
Node alignment functionality covers alignment of node centers and sides of nodes. Node resizing takes into account widths and heights of other nodes. Support for equidistant placement and placement according to preferred distances is provided for nodes and edges. - New support for interactively creating and editing orthogonal edges.
Edge creation yields an orthogonal edge path with alternating horizontal and vertical edge segments. Edge segments and bends can be easily moved while maintaining the orthogonal characteristic of an edge path. - New distribution tools. Selected nodes can be distributed in horizontal or vertical direction so that they there is an equal distance between the graph elements.
- Visual feedback around nodes that indicate valid targets during edge creation and port relocation gestures.
- A new mechanism that allows for direct feedback has been added to yEd. In case of erroneous behavior, a comprehensive error report and additional comments can be sent to yWorks.
yEd 3.2.0.1 - Changes Since 3.2
Improvements
- Simplified using the files produced by the HTML Flash Viewer export on a website.
Bugfixes
- Fixed file filter handling in Save and Export dialogs which sometimes produced exceptions like "ArrayIndexOutOfBoundsException: -1."
yEd 3.2 - Changes Since 3.1.2.1
New Features
- New export option "HTML Flash Viewer" that exports a graph to standard GraphML format together with a wrapping HTML page and a SWF file.
The SWF file can be conveniently opened in a web browser by means of the HTML page. It contains an Adobe® Flash® Player-based viewer for displaying the GraphML file.
Compared to the already existing export as a plain Flash file ("SWF Format"), the viewer adds several configurable features like an overview and zoom buttons. - Added new "Current Elements" section to the Palette tool window that shows representatives of the current kinds of nodes and edges from the displayed graph. The representatives are dynamically updated when the graph changes.
The criteria used to decide whether graph elements are considered equal are conveniently configurable. - New "Editor" tab in the Preferences dialog that provides a variety of new configuration options for graph editing.
- Dragging an edge from the Palette tool window onto a node in the editor starts the creation of an edge of the corresponding type at the drop node.
- Dragging a node from the Palette tool window onto a group node adds the node to the group.
Improvements
- During a yEd session, the file format of the previous export is retained and preselected when the Export dialog is opened again.
- Diagram export to the TGF file format (Trivial Graph Format) has been reintroduced.
- Representations of large nodes in the palette were not properly centered.
- Added tooltips for entries in tabular views, i.e., entries in property tables and layout options/tool options that are docked.
Bugfixes
- Description and URL data for nodes or edges were ignored in the User Defined section of the Palette tool window. They are now properly handled.
- The yEd installer on Mac OS X no longer prompts for an administrator or root password.
- Application quit on Mac OS X can be canceled again.
- The overview is now properly updated with respect to selected graph elements on mode changes.
- It is no longer possible to apply a normal node's representation from a palette to a group node in the editor.
- Bends of edges inside folder nodes were displaced by Copy and Paste operations.
- A NullPointerException occurred when the Type combo box from the tabular properties view for a selected node or edge was opened followed by a click in the editor window.
- Multiline tooltips on the right side of an exported page had more line breaks than expected.
- The target editor window of a Drag and Drop operation from the palette did not gain focus, which prevented Paste operations using the keyboard shortcut (CTRL-V/Command-V on Mac OS X).
yEd 3.1.2.1 - Changes Since 3.1.2
Improvements
- Problems during the setup for reusing an already running yEd application instance are handled more gracefully. If the setup fails, yEd starts up as in the pre-3.1.2 days.
yEd 3.1.2 - Changes Since 3.1.1
New Features
- When opening graph files, there is no longer a new yEd application instance created for each single file. Instead, an already running instance is "reused."
- Added Mac-specific key bindings for menus, etc. Also, a new application icon has been added.
Bugfixes
- Added a workaround for a bug in Java 1.6.0_10 which prevented checkboxes in yEd's property dialogs and property tables from working properly.
- Fixed a bug which occurred when edge grouping was used with multiple documents.
Improvements
- The yEd Windows installers (and uninstallers) no longer depend on the C runtime library file MSVCR71.dll to be accessible in the C:\Windows\System32 directory.
yEd 3.1.1 - Changes Since 3.1
New Features
- Added panning support to the editor windows when in Edit Mode. Right-dragging the mouse (Command key-dragging on Mac OS X) moves the canvas.
- Label text optionally automatically adjusts to the width, the height, or both width and height of their nodes.
- Support for importing image files and SVG files via drag and drop gesture. Image files and SVG files can be dragged to the section for user-defined graph elements in the Palette tool window.
Also, when dragged directly to the active editor window, a new image node is created at the drop location. - The Palette tool window supports clearing all user-defined graph elements at once.
Bugfixes
- Corrected scroll bar behavior with regard to undo, area zoom, and navigating folder nodes (closed group nodes).
- Corrected language switching for node label options.
- Fixed incorrect behavior where multiple property dialogs could be opened.
- Corrected visual feedback for cut/copy/paste icons in the tool bar.
- Fixed inconsistent behavior when deleting nodes in group nodes.
- Addressed issue with node label placement where sometimes settings from the property dialog were not adhered to.
yEd 3.1 - Changes Since 3.0.1.1
New Features
- Added new layout algorithm for genealogical family trees.
- yEd supports importing files in GEDCOM file format, the most common format for encoding genealogical data.
- New full-screen mode for browsing graphs.
- New palette that makes available "Modern"-style node representations.
- Labels can be selected just like other graph elements.
- Group nodes offer a new option to take into account their label's size for minimum size calculation. Effectively, this means that they will never get smaller than their label.
Improvements
- Help pages that explain a layout algorithm and its options can be opened directly from the algorithm's settings dialog.
- Loading graphs from URL now also supports non-GraphML file formats like, e.g., GML or YGF.
- Mouse wheel zooming considers the current position of the mouse.
- A warning dialog is presented before resetting to the factory defaults in any of the settings dialogs.
- Removed "Powered by yFiles" watermarking from the editor windows and from exported documents.
- If a layout algorithm cannot handle a given graph, it signals so by displaying a descriptive message. (Most notably, this includes the tree layout algorithms and the family tree layouter.)
Bugfixes
- Corrected printing of SVG nodes.
- Switching the language now works again for the Help pages.
- Fixed rare inconsistencies between used and displayed layout algorithm settings.
- Corrected inconsistent behaviors related to empty group nodes.
- Changing node labels in the Structure View is now undoable.
yEd 3.0.1.1 - Changes Since 3.0.1
Bugfixes
- Saving files with short file names like
g.graphml(with a prefix of less than three characters) works again. This bug was introduced in yEd 3.0.1.
yEd 3.0.1 - Changes Since 3.0.0.8
Bugfixes
- Diagram files no longer get truncated when an out-of-memory situation occurs during saving.
- The Unix shell script installer now finds the JRE it is optionally downloading.
- Erroneous behavior with YGF diagram files that contain SVG node definitions has been fixed.
- Specifying arbitrary coordinates by holding down the SHIFT modifier when relocating an edge port using the mouse is enabled again.
- Fixed an exception that could occur with the Auto Grouping tool when using 'Biconnected Components' as the grouping type.
- Fixed label handling when applying a shape from the palette to a selected node in the editor.
Improvements
- The menu actions for opening and importing diagram files have been merged.
- The file open dialog now supports opening multiple diagram files, which can have different file formats, at once.
- Diagram files can be reloaded now.
- Except TGF files and files that were opened using the XML/XSL support, most diagram files can be saved to their original format.
- Removed unnecessary file save dialogs for unaltered diagrams.
- Added 'Copy to Clipboard' action to the Edit menu.
- Improved edge routing in hierarchical layouts for certain situations.
yEd 3.0.0.8 - Changes Since 3.0.0.7
Bugfixes
- Fixed a bug in the Selector tool where the set of available colors could get empty after color changes of graph elements.
- Corrected an exception in the Port Constraints tool that could occur when used with multiple documents.
- Damaged history files ('history.xml' in the '.yed3' profile directory) are ignored at startup, there is no longer an exception thrown.
Improvements
- Larger initial size for the multi-line text fields in popup windows (used for editing node label and edge label text and also additional descriptions).
yEd 3.0.0.7 - Changes Since 3.0.0.6
Bugfixes
- Fixed a bug that occurred when searching for edges using CTRL-F.
- Changing a property for a selection of multiple graph elements sometimes failed (e.g. setting the color of differently colored nodes to black). This has been fixed.
- When leaving a folder node that is at the top-level, i.e., returning to the view of the root graph, the '(Back to the) Previous View' button in the tool bar is now properly disabled.
Improvements
- Improved startup time for the JNLP version with Java 1.6.
- Leaving a group node, i.e., returning to the view of the hierarchy level above, now centers the view so that the group node is in the middle of the canvas.
- yEd is more lenient when parsing GraphML files.
- Hot keys for switching to navigation mode or edit mode (CTRL-SHIFT-S and CTRL-SHIFT-D, respectively).
- Mac OS X support for the 'Go to URL' function has been improved.
yEd 3.0.0.6 - Changes Since 3.0.0.5
Bugfixes
- XML/XSL import has been corrected.
- Re-enabled lexicographical sorting for the nodes of a graph (more precisely their labels) in the Structure View tool window.
- Re-enabled mouse wheel zooming in the Overview tool window.
- Corrected an exception in the Selector tool.
Improvements
- yEd file size has been reduced.
yEd 3.0.0.5 - Changes Since 3.0.0.4
Bugfixes
- Corrected an exception relating to closed group nodes that was introduced in the previous version.
yEd 3.0.0.4 - Changes Since 3.0.0.3
Bugfixes
- Layout algorithms give feedback if an exception has occurred during calculation.
- Added missing localizations for Directed Orthogonal Layout (UML style layout).
- Help system handling has been changed so that only a single help window is opened.
- Setting the color value that is used to identify directed edges for Directed Orthogonal Layout to 'no color' no longer corrupts the layout algorithm's setup.
- Copy/Paste and Undo/Redo correctly handle additional data for nodes and edges, i.e., URLs and descriptions.
Improvements
- The color of the resize knobs at selected nodes has been set to dark gray.
- Dialogs for both layout algorithms and tools that were closed when in 'docked' state are opened standalone again the next time.
- In the 'Save As...' and 'Export...' file choosers the base name of the current graph is used as a suggestion for the file name.
- Re-enabled the GML graph exchange file format for diagram export.
- Settings that were modified in a standalone dialog for either layout algorithm or tool are kept when switching the dialog to 'docked' state.
yEd 3.0.0.3 - Changes Since 3.0.0.2
Bugfixes
- The default language that is used for yEd's menus, etc. when no persisted language setting is available has been corrected.
yEd 3.0.0.2 - Changes Since 3.0.0.1
Improvements
- Standalone dialogs can be closed using ESC (Escape key).
- The Properties dialog is no longer modal. When opened standalone, interaction with the canvas is possible.
yEd 3.0.0.1 - Changes Since 3.0
Bugfixes
- Fixed incompatible behavior with YGF diagram files created by yEd versions prior to 3.0 that contained nodes of type UML Note.
