
Balloon Layout How to draw a graph with the balloon layout.
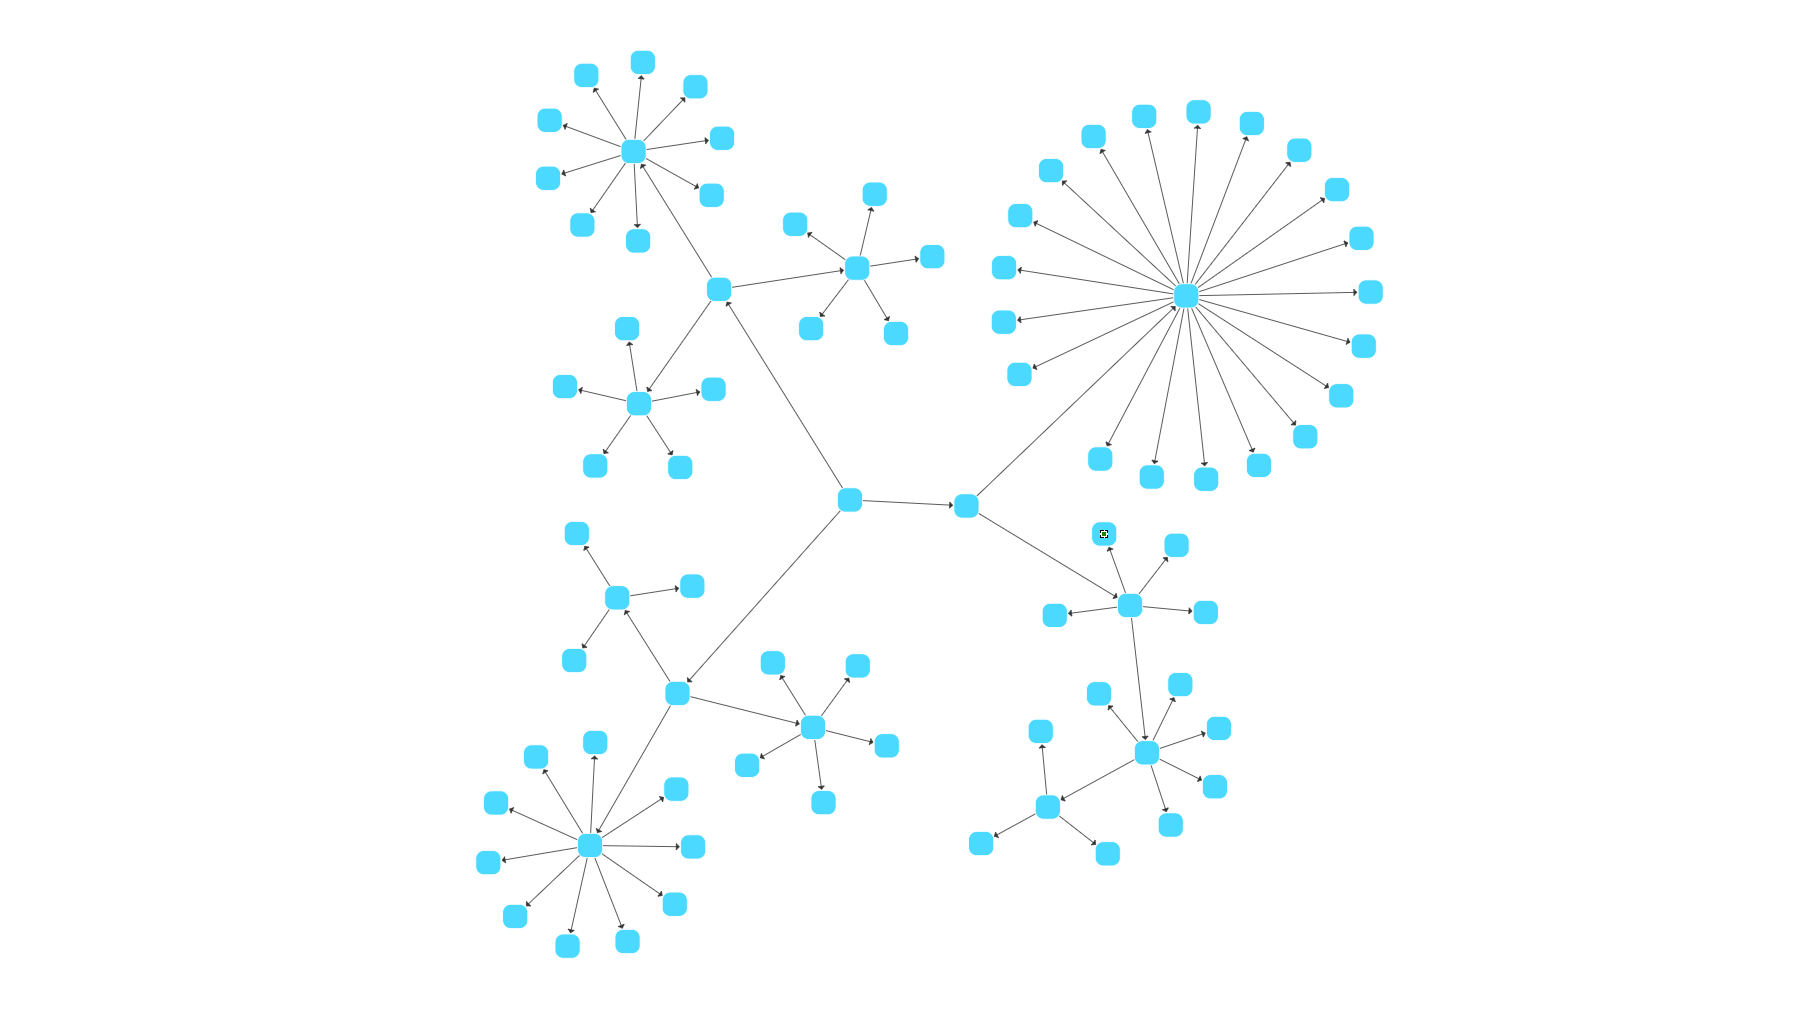
[ChatGPT] Explore the world of Balloon Layout, an innovative approach to graph organization and visualization. In today's data-driven landscape, presenting complex information in a clear and visually engaging manner is paramount.
[ChatGPT] Balloon Layout offers a unique solution for arranging hierarchical structures, such as organizational charts, family trees, and network diagrams. By intelligently organizing nodes and edges, Balloon Layout creates visually appealing diagrams that enhance comprehension and aid decision-making processes.
yFiles React Organization Chart Component
The yFiles React Organization Chart Component uses the yFiles library in order to seamlessly incorporate dynamic and interactive organization charts and diagrams into your React applications.
This enhances the user experience and facilitates an intuitive exploration of complex organizational setups.
yFiles React Supply Chain Component
Our powerful and versatile React component based on the yFiles library, allows you to quickly incorporate dynamic and interactive supply chain diagrams seamlessly into your applications.
This enhances the user experience and facilitates an intuitive exploration of complex manufacturing processes, allowing users to gain insights into their supply chain data.
yFiles React Company Ownership Component
Our reliable React component, leveraging the powerful yFiles library, enables you to effortlessly integrate dynamic and interactive company ownership charts into your applications.
Enrich user engagement and simplify the exploration of intricate company hierarchies.
yFiles React Process Mining Component
This React component extracts process mining diagrams from event logs. This technique reveals the actual flow of processes and helps identify bottlenecks, deviations, and opportunities for improvement.
The yFiles React Process Mining Component is built upon the yFiles for HTML library, integrating powerful visual tools to facilitate the exploration of temporal data.


