
yFiles Graphs for JupyterVisualize graph networks with Python

The graphing extension that makes your data more usable
yFiles Graphs for Jupyter is a free diagram visualization extension for JupyterLab and Jupyter Notebook. You can easily load structures from your favorite Python graph package and benefit from the superior visualization and automatic layouts of our established yFiles SDK.
Gain new insights into your data and create readable representations of your network by utilizing the automatic layout algorithms, inspecting the item’s neighbors and associated data, mapping data to colors, and more.
You can use this extension in the default Jupyter environments, but also in other environments like VS Code or Google Colab.
Looking for an easy way to visualize your Neo4j database? Our thin, open-source wrapper Python widget yFiles Jupyter Graphs for Neo4j provides an easy to use API for this use case.
yFiles Graphs for Jupyter is a free diagram visualization extension for JupyterLab and Jupyter Notebook. It can import structured data from popular Python graph packages like NetworkX, igraph, PyGraphviz, Neo4j, or any structured list of nodes and edges.
Powerful layout algorithms from our established yFiles SDK are included. You can easily apply the whole range – organic, hierarchic, tree, orthogonal, circular, and radial – to your graph structure. A suitable, clear visualization helps you gain a better understanding of your data.
The embedded extension provides interactive features like automatic layouts, item neighborhood and data views, and search capabilities, as well as an API to integrate the high-performance algorithms and specify data-driven mappings for item color or geometry.
Looking for an easy way to visualize your Neo4j database? Our thin, open-source wrapper Python widget yFiles Jupyter Graphs for Neo4j provides an easy to use API for this use case.
What to expect on this page

Why use yFiles Graphs for Jupyter?
Import and Visualize
Import from popular Python graph packages and create revealing yet concise visualizations. Just pass the graph data of NetworkX, graph-tool, igraph, PyGraphviz, or structured node and edge lists to the widget and interactively explore your network.
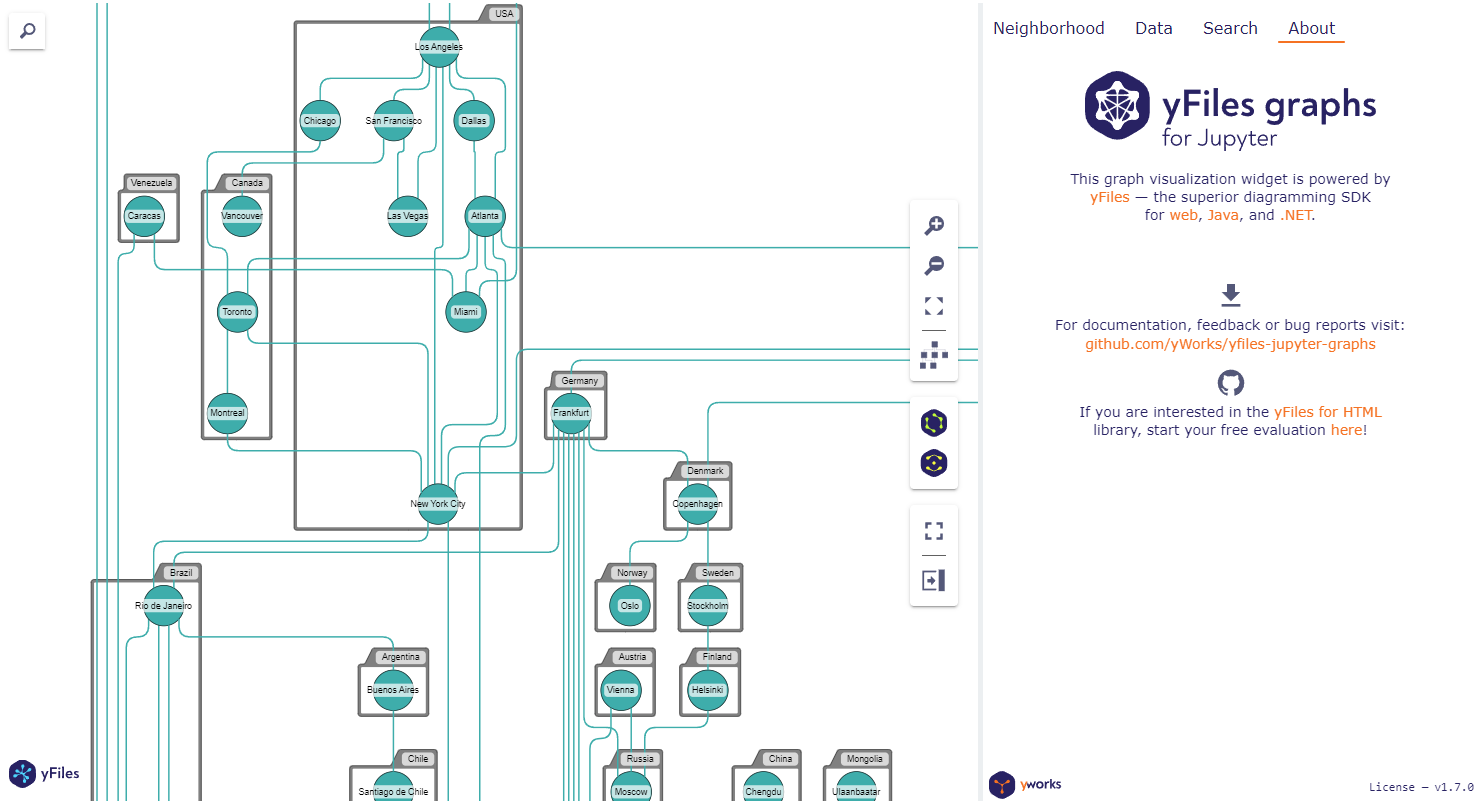
Automatic Layouts
Benefit of yFiles' superior automatic layout algorithms. Easily arrange your graph with different layout styles: Hierarchic, organic (force-directed), tree, orthogonal, circular, or radial. Each layout style highlights different structural features of the graph and helps you gain new insights into the data.
Data-driven mappings
yFiles offers customizable, data-driven mappings for nodes and edges. These mappings let you adjust visual aspects of the diagram - like color, scale, and edge thickness - as well as structural aspects like an item label or position.
Features
See item neighborhood
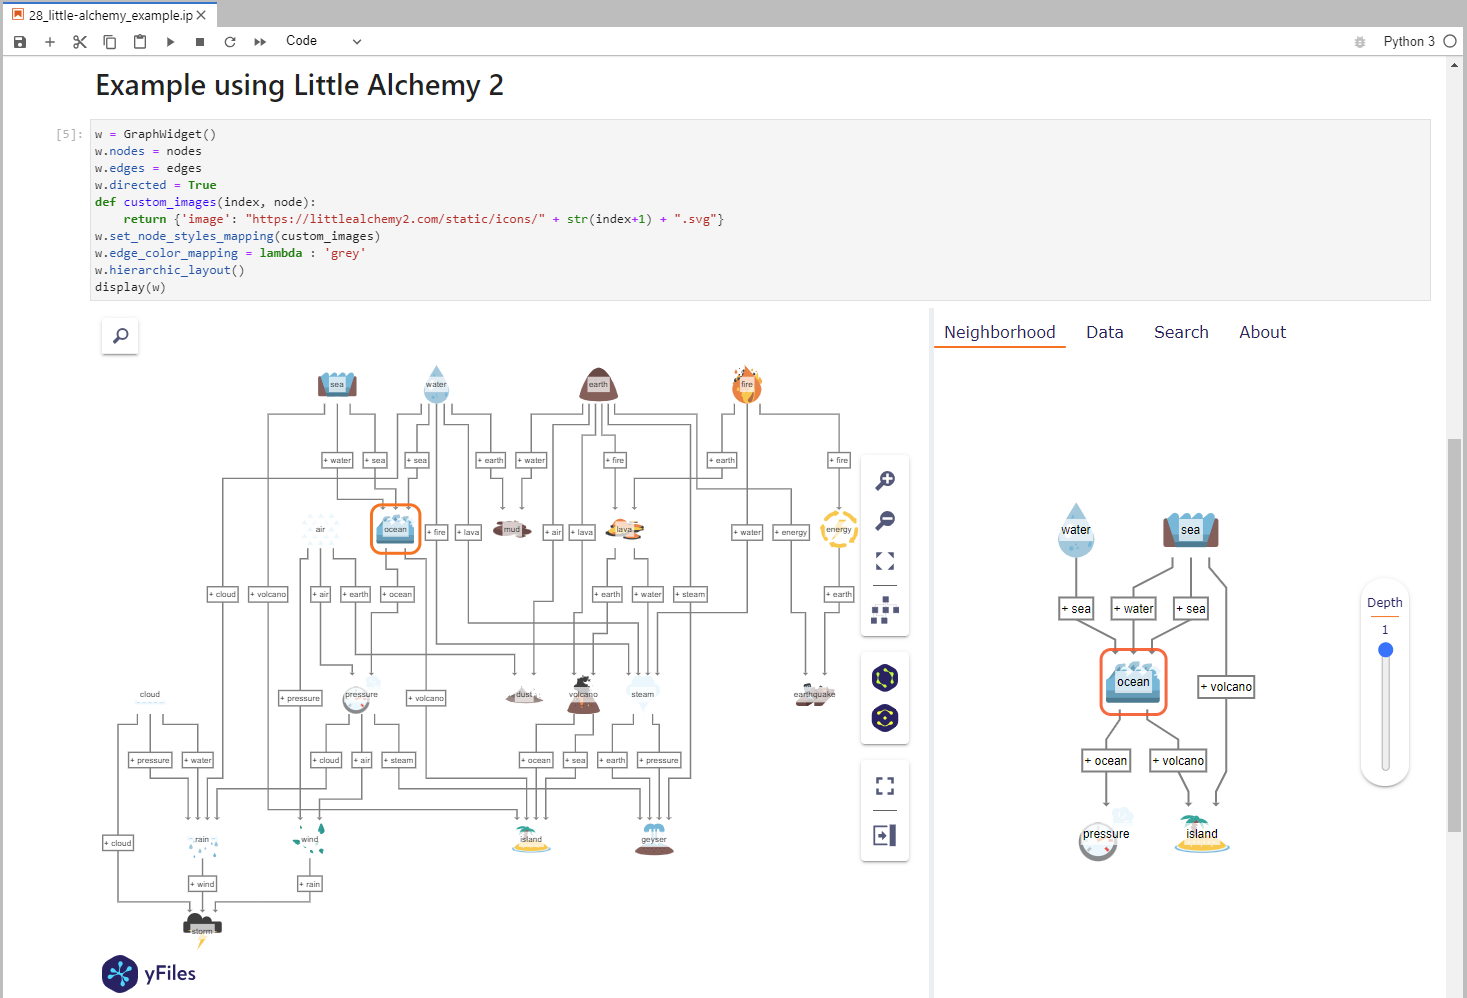
Check the sidebar's Neighborhood tab to explore node connections and view their adjacent items.
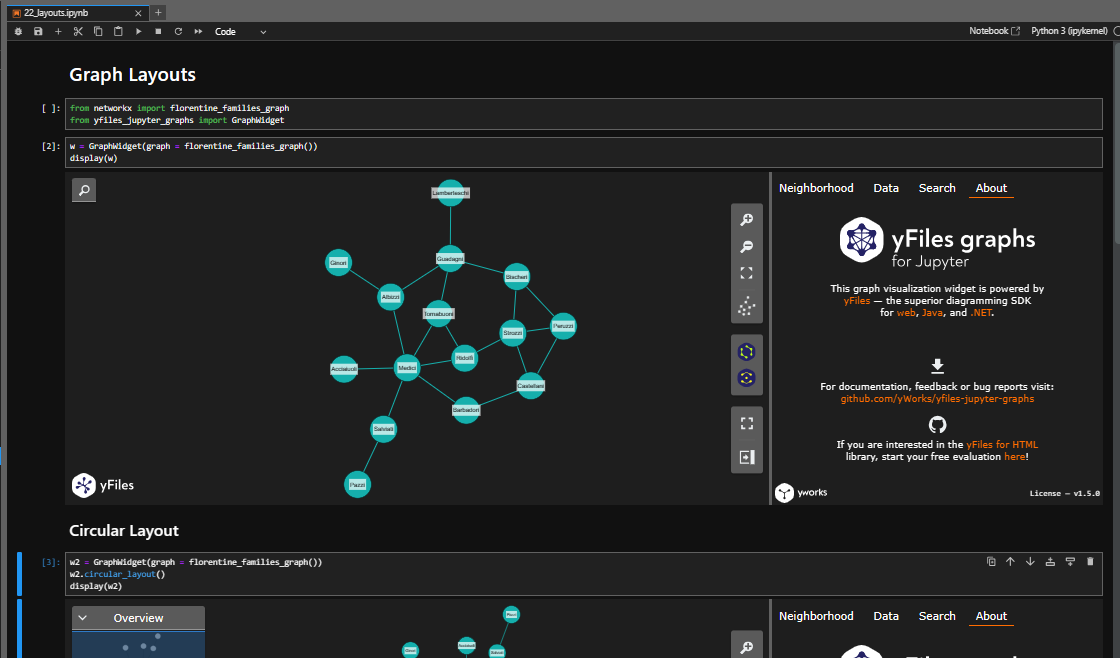
See how it worksChoose graph layout
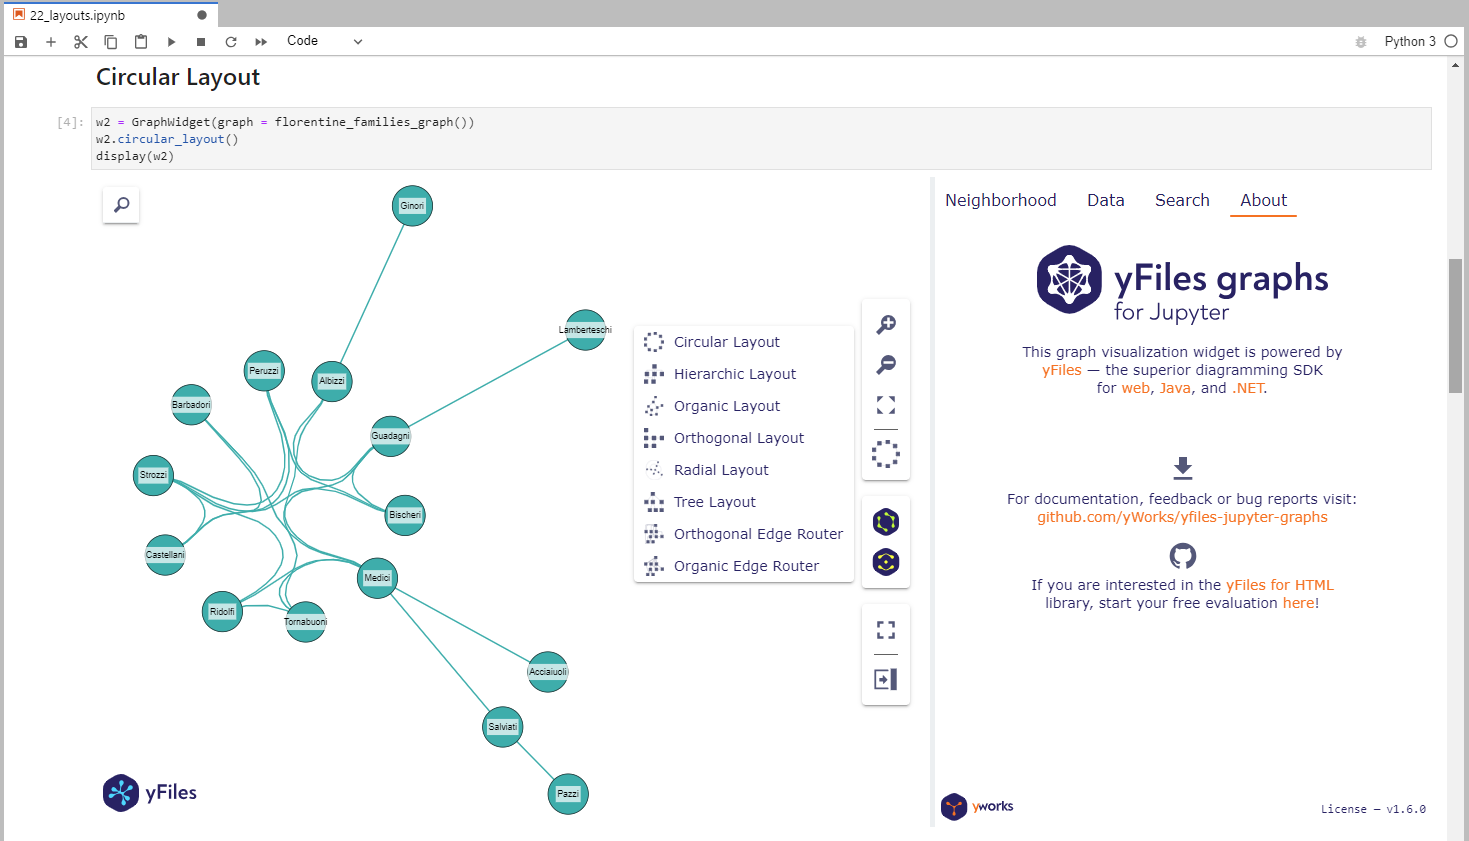
Select a graph layout from the toolbar to rearrange your graph items automatically.
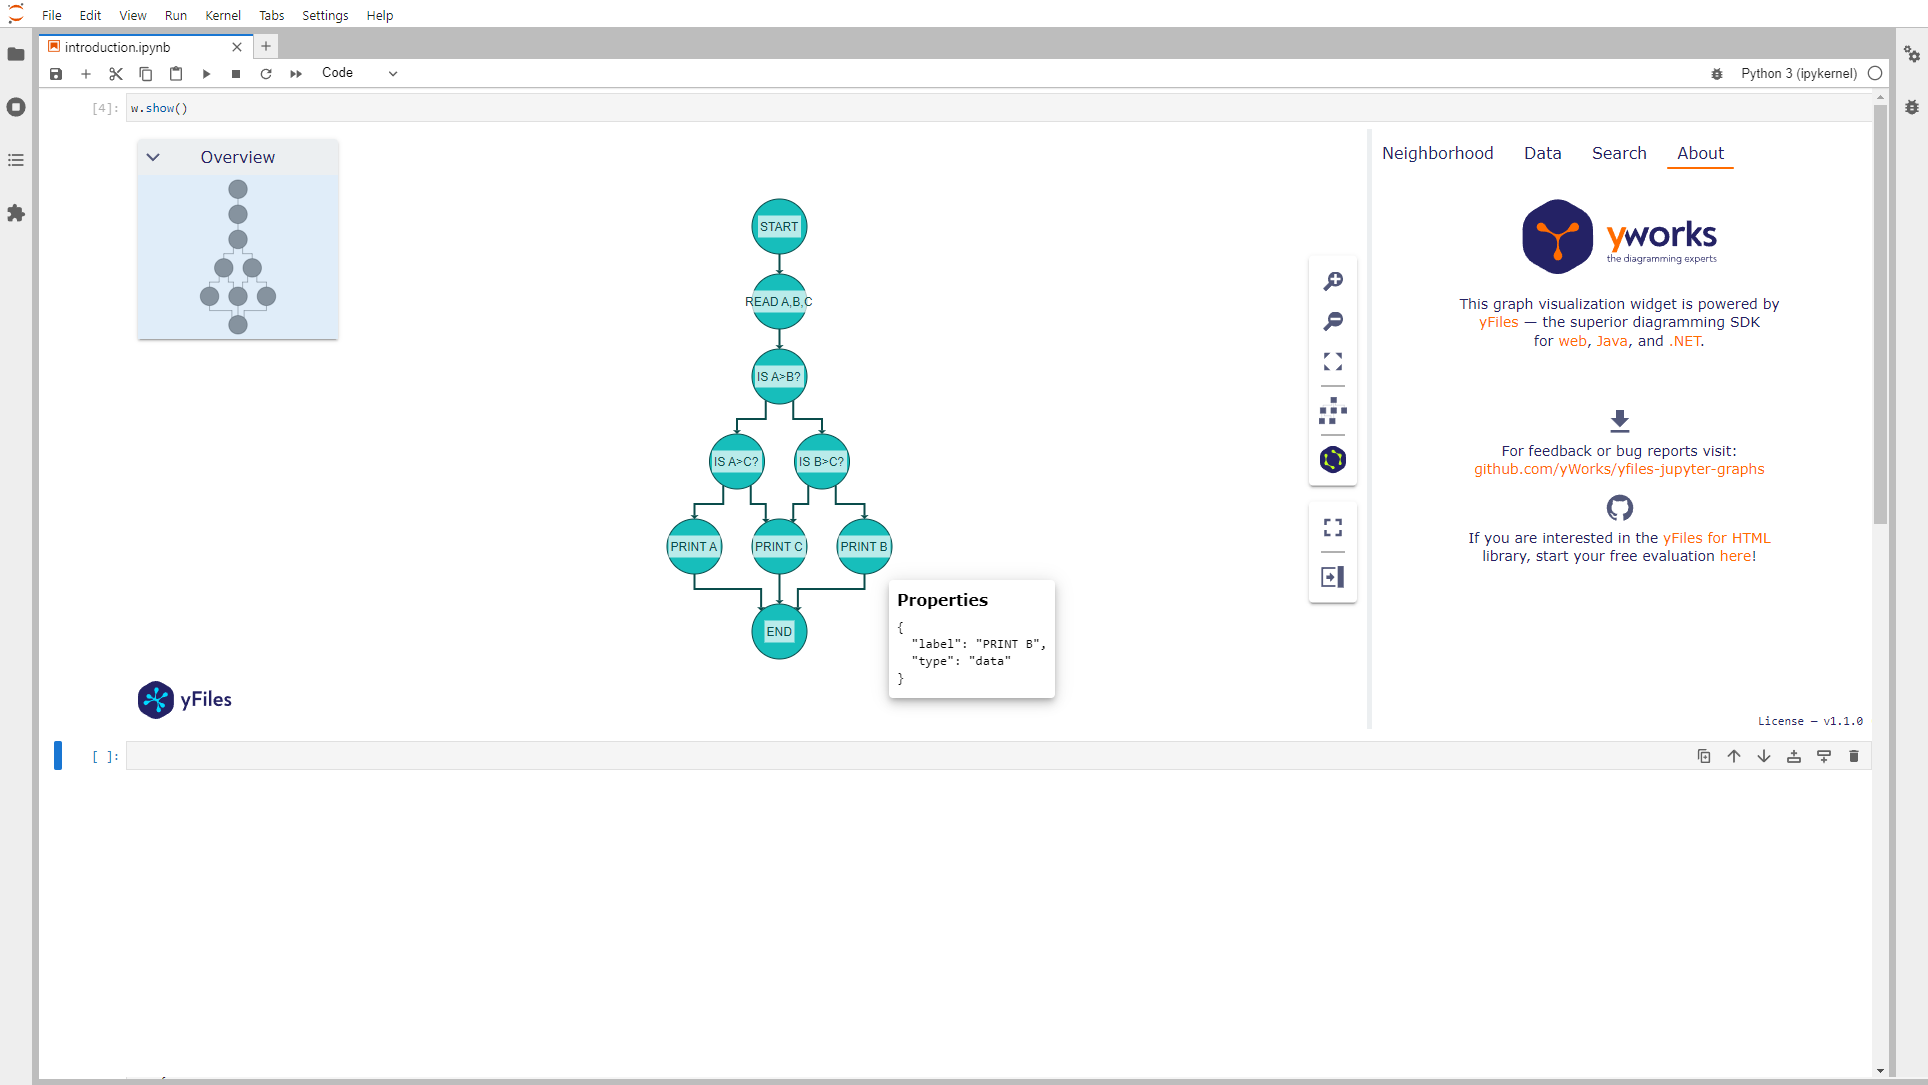
See how it worksInvestigate node or edge data
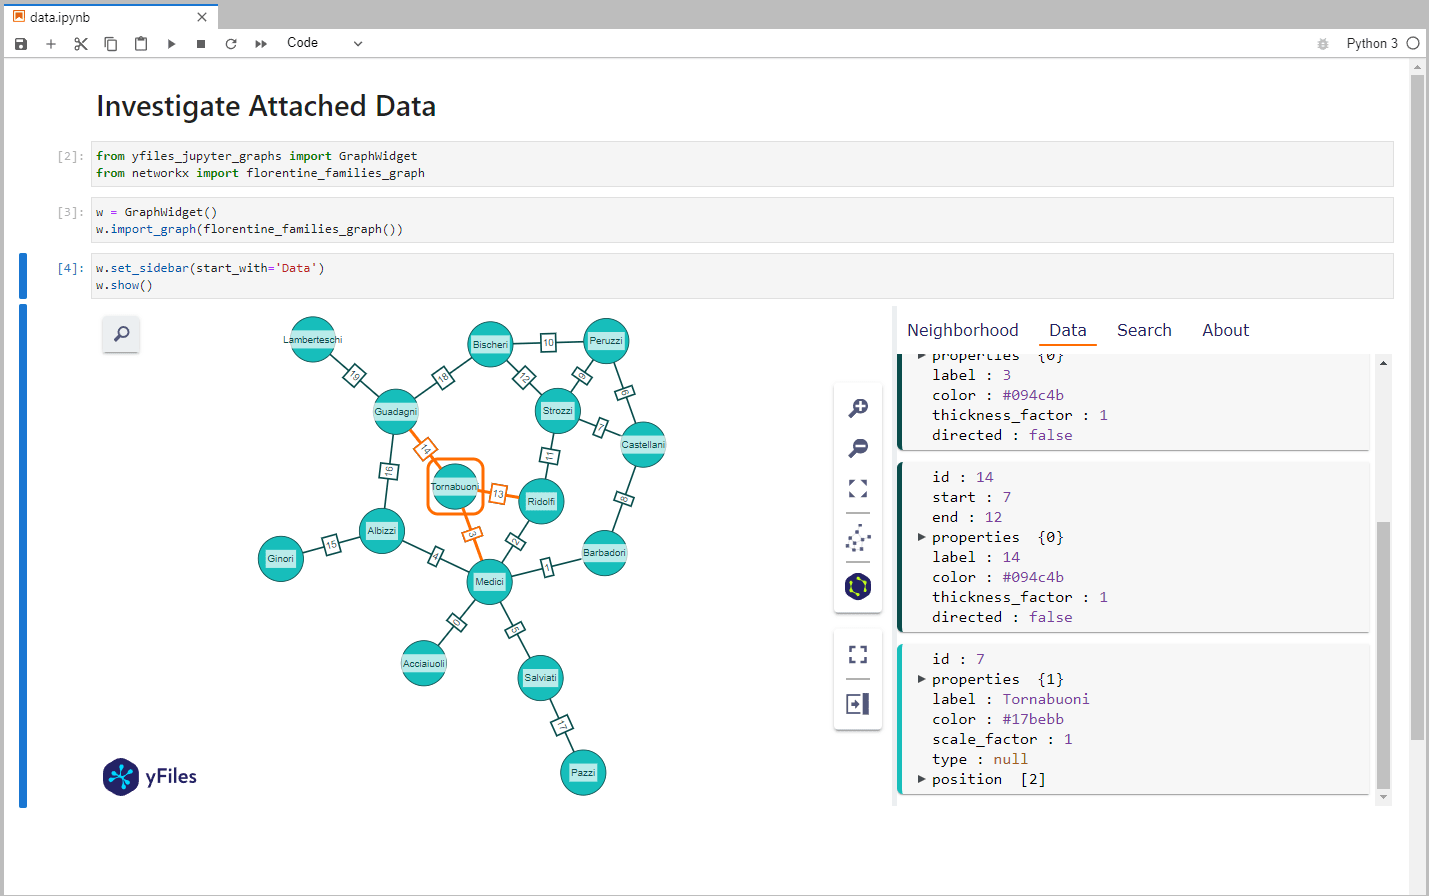
Explore node and edge properties in the data tab of the sidebar to inspect your item's data.
See how it worksSearch for nodes or edges
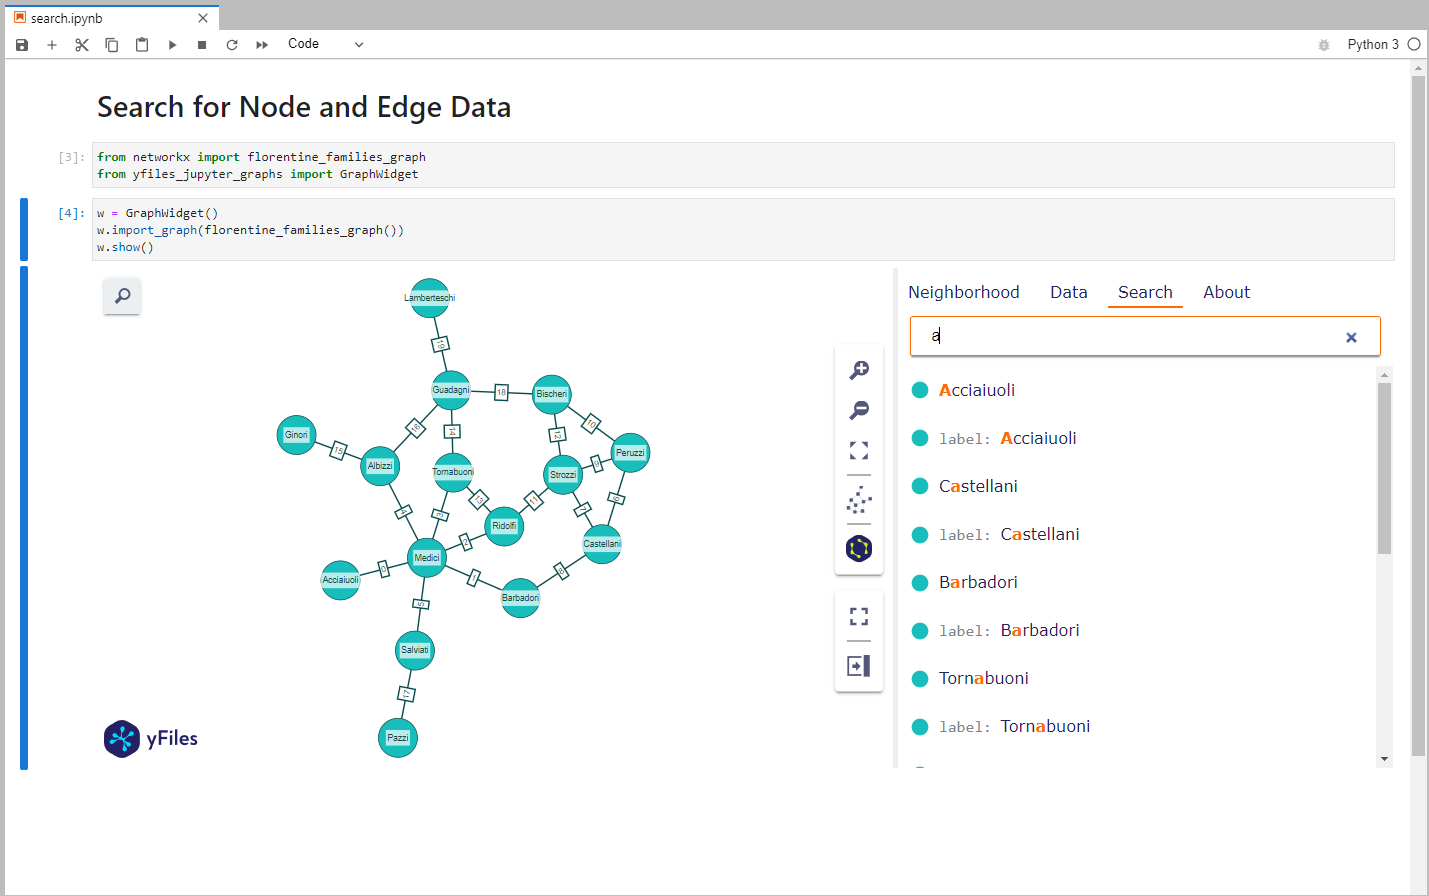
Find specific nodes and edges in your graph with the integrated graph search.
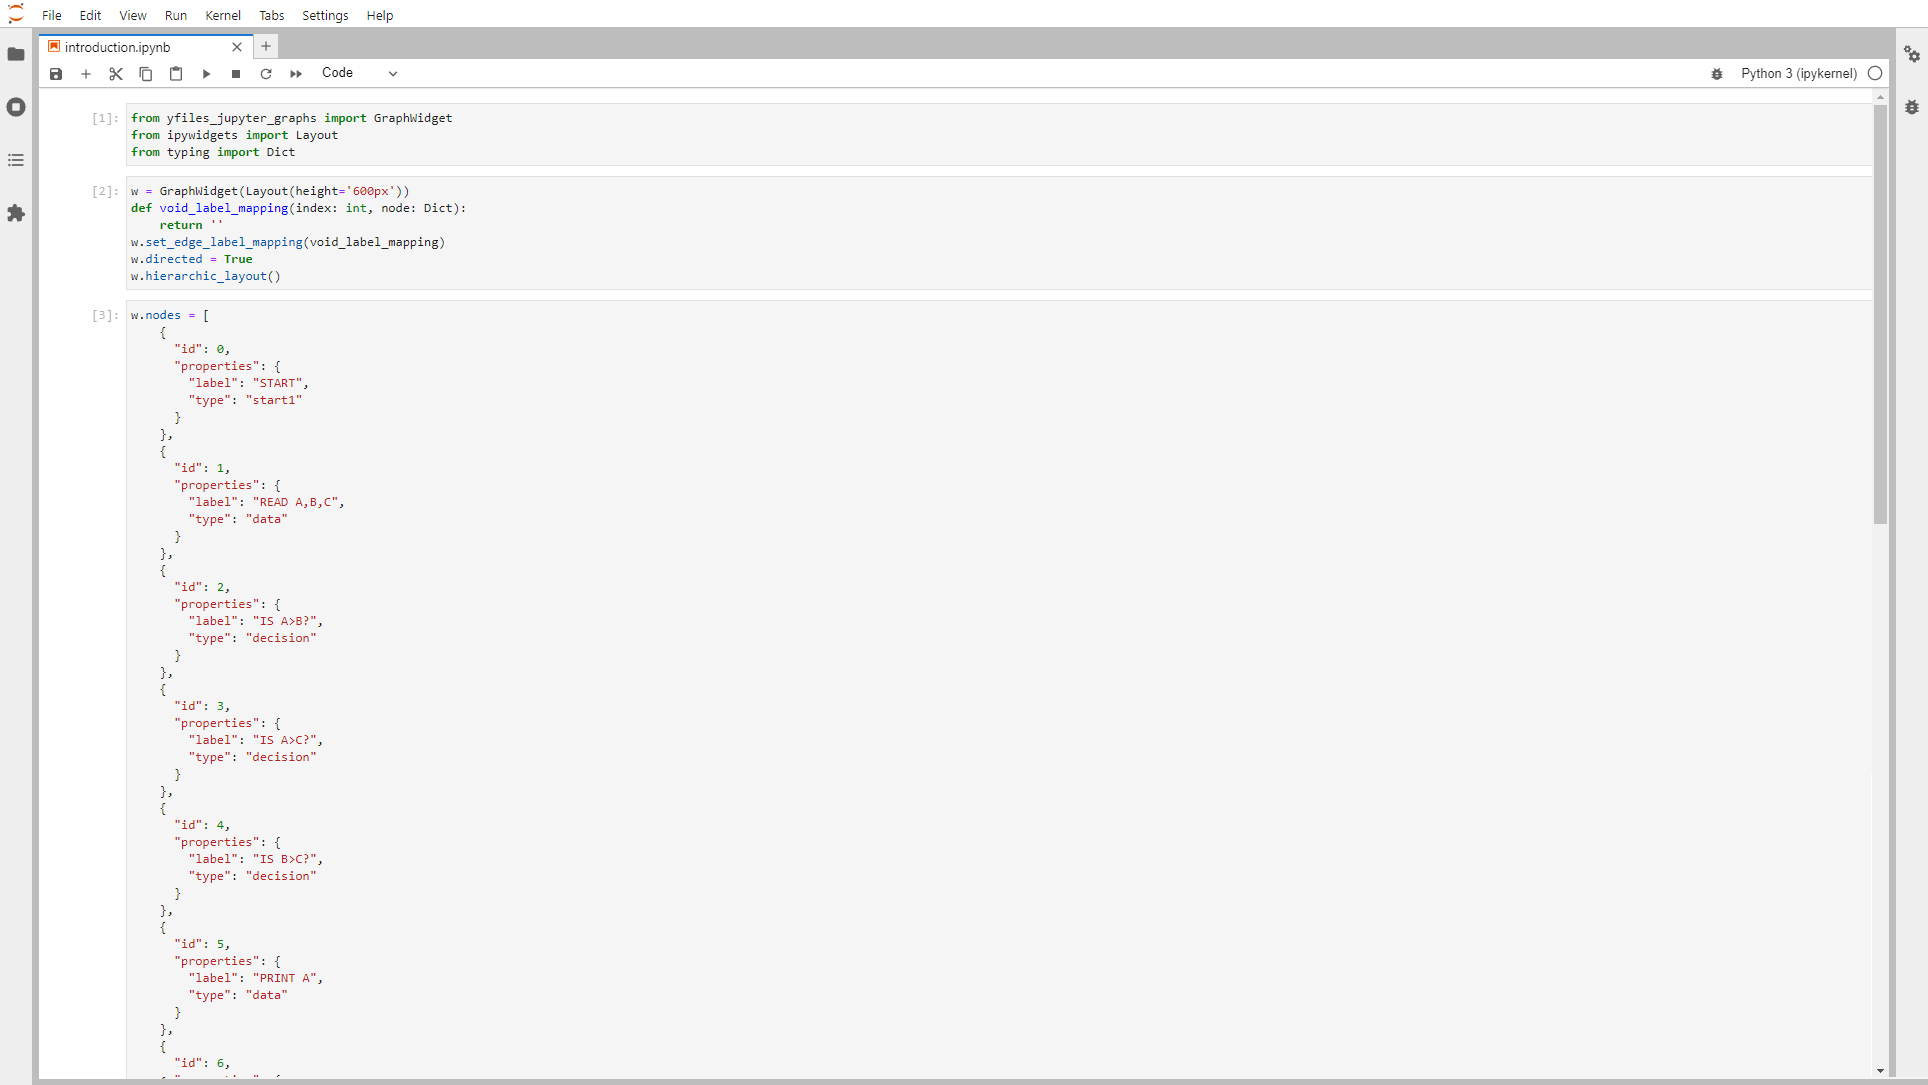
See how it worksImport graph data
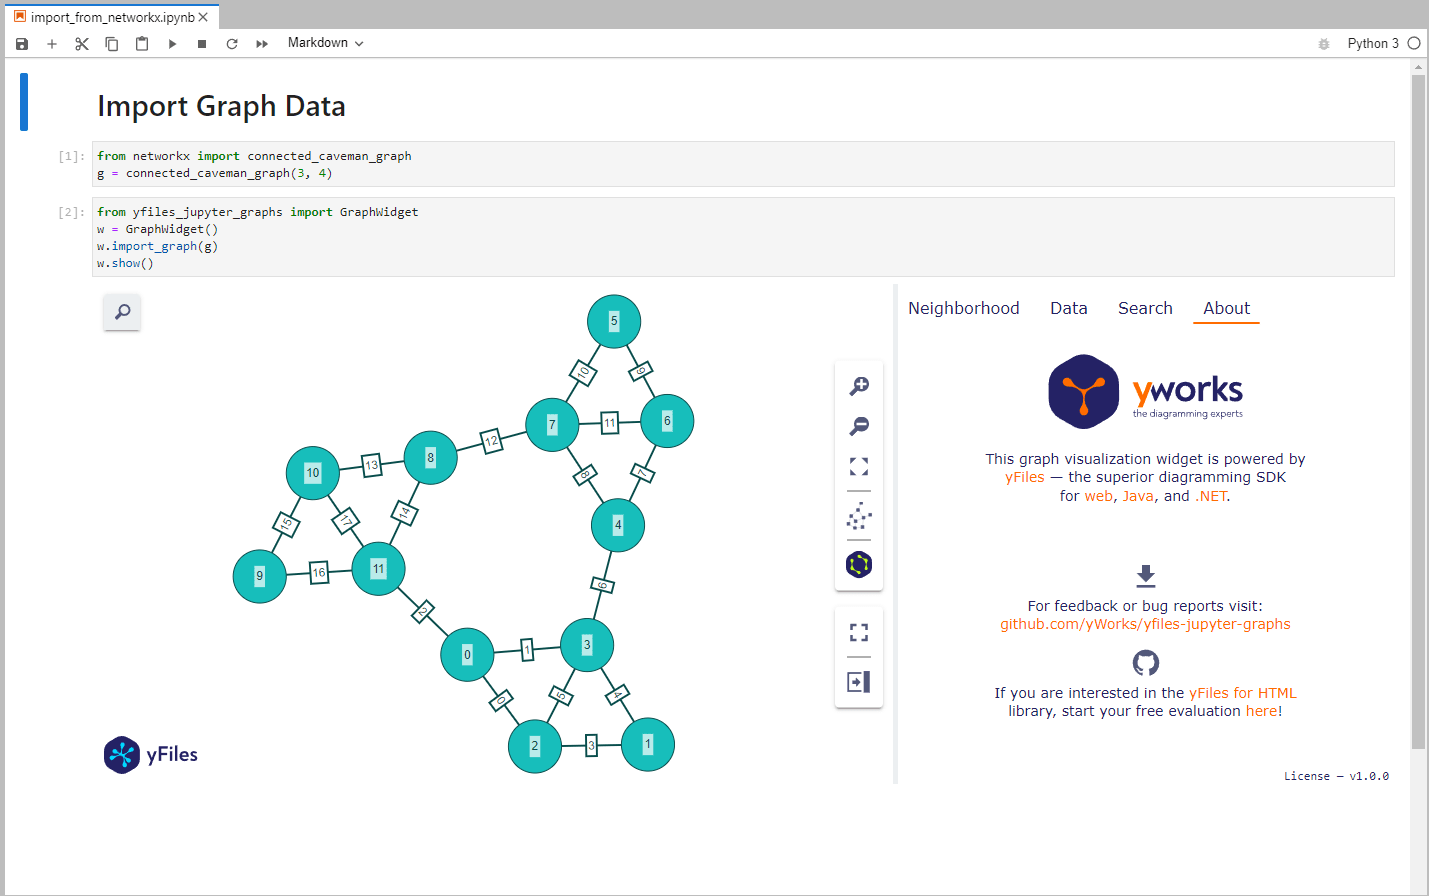
Import your graph data from popular Python packages like NetworkX, igraph, PyGraphviz, Neo4j, or any structured list of nodes and edges.
See how it worksChange properties based on data
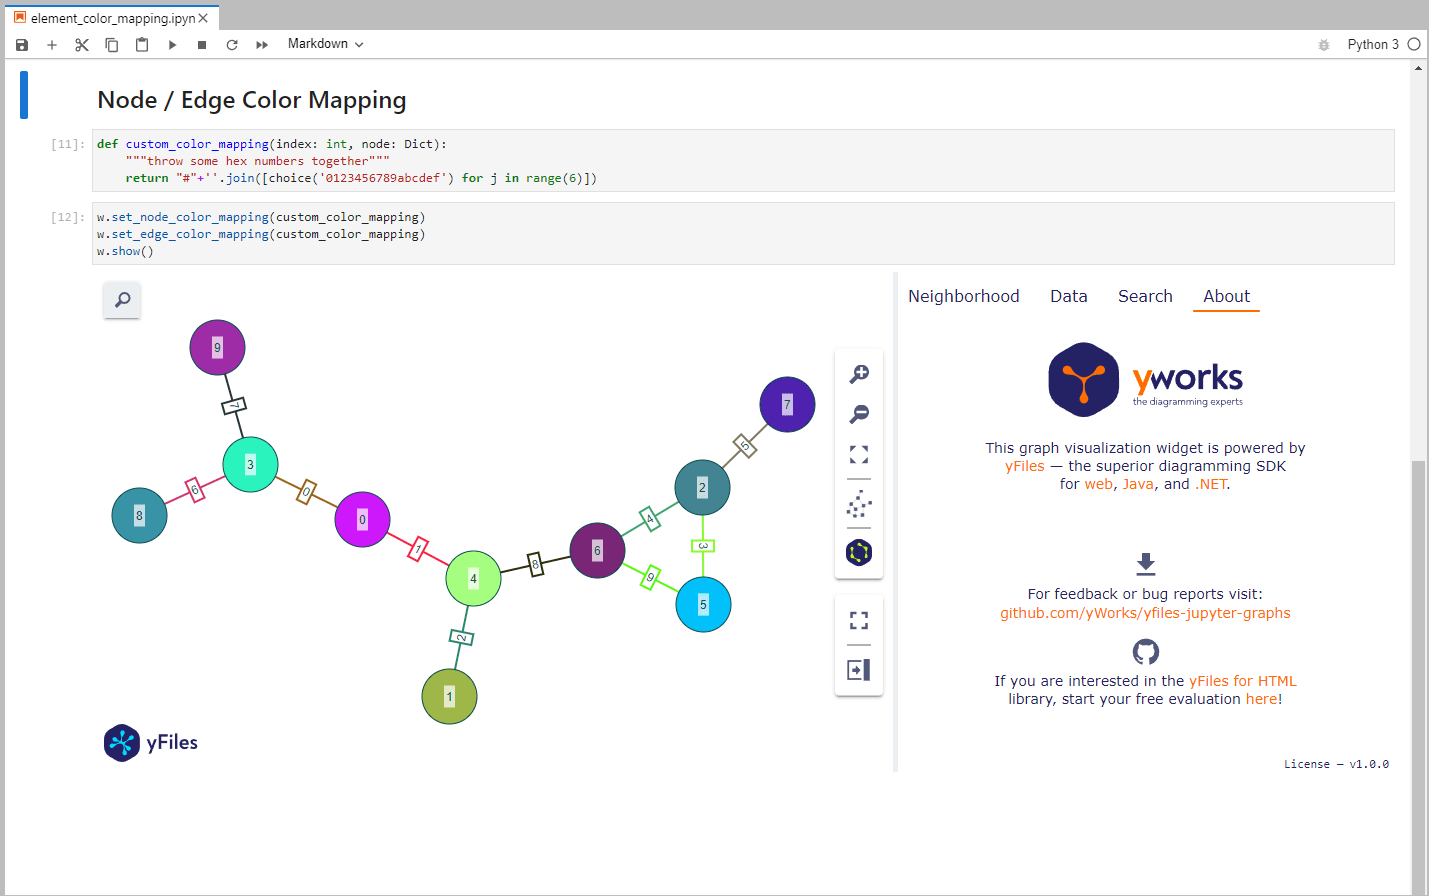
Use your business data to adjust the visualization of nodes and edges with versatile data mapping functions.
See how it worksDark theme
The widget automatically matches your preferred theme of the Jupyter notebook or your browser.
See how it worksUse selected items
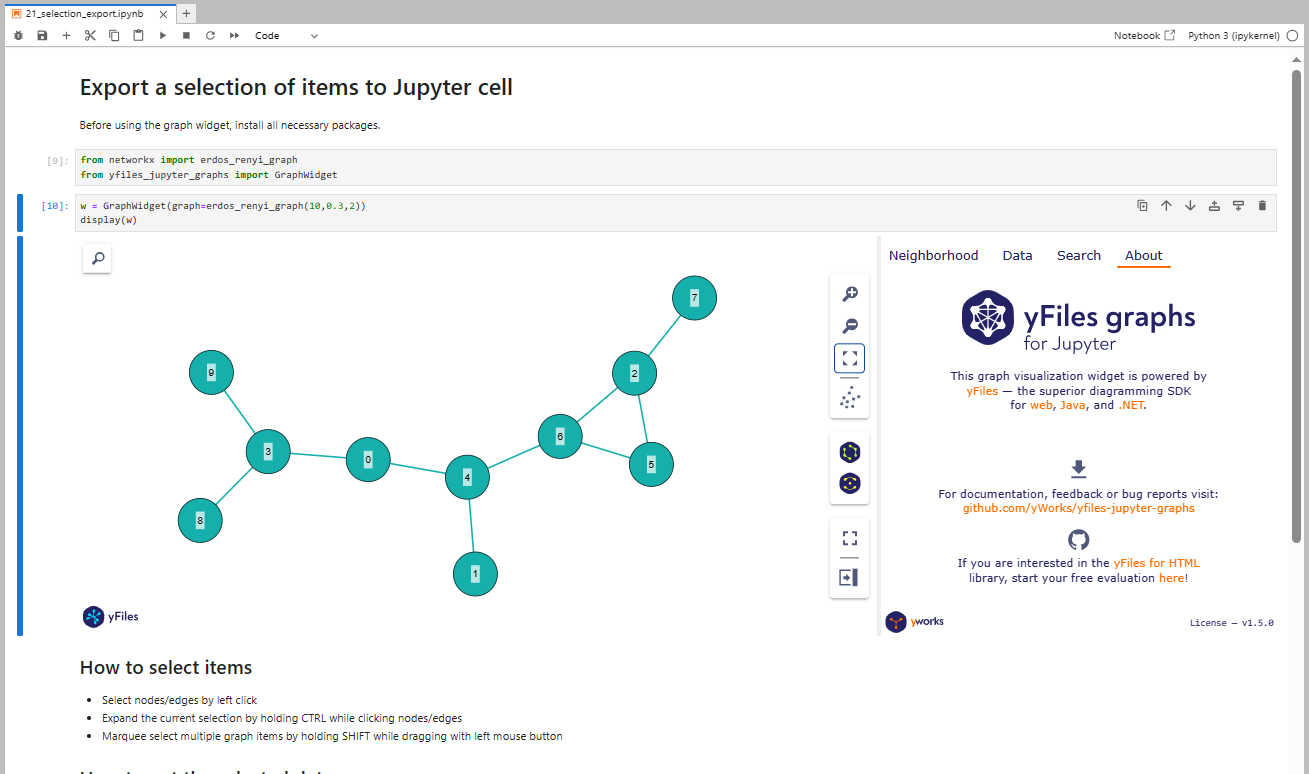
Extract the data of interactively selected items back to your Jupyter notebook cell.
See how it worksVisualize data as heatmap
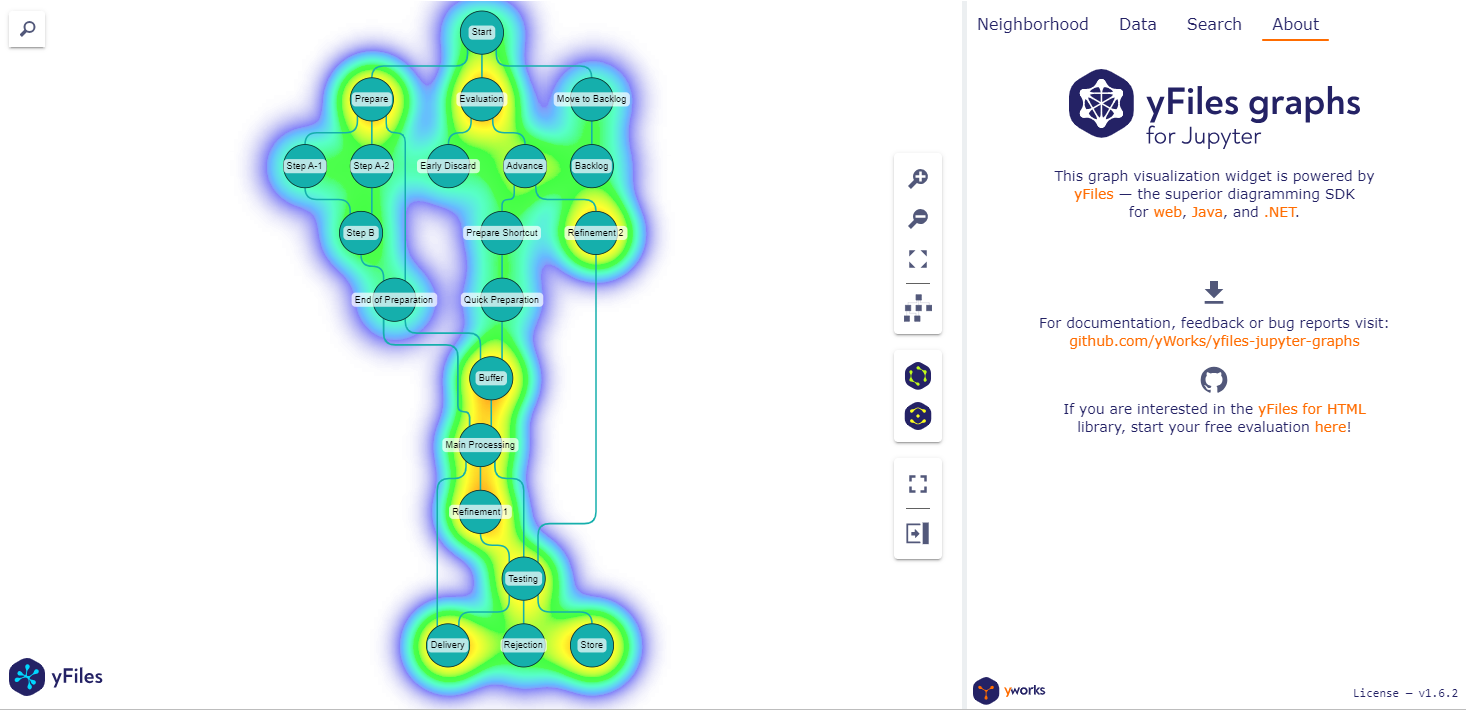
Visualize data as a heatmap overlay for an additional information layer.
See how it works
Feedback?
Let us know about your use case and what features you would like to see in the future.
Contact usMore Features
Sample projects
Explore our numerous sample Notebooks that showcase the most popular features:
Free license
Valuable visualizations – at no cost
We are pleased to offer you a perpetual, free, non-transferable license to install and dynamically use this extension in your browser on top of your Jupyter system.
Technical information
yFiles Graphs for Jupyter is an extension for JupyterLab and Jupyter Notebook. Besides the default Jupyter environments, the extension is also supported in other environments like VS Code or Google Colab.
It is based on yFiles - the superior diagramming SDK. You can try a fully-functional version of yFiles free of charge. Explore the whole scope of graph drawing and integrate interactive visualizations into your own software products!
Supported Environments
You can use yFiles Graphs for Jupyter in many environments that support Jupyter notebooks:
In case you need a specific activation for your domain, contact us.
Help
Have more questions?
Find helpful information here:
Video guides and tutorials
Quick start tutorial

Webinar yFiles Graphs for Jupyter

Frequently Asked Questions
Getting started
Install the yFiles Graphs for Jupyter extension with
pip install yfiles_jupyter_graphs
Instantiate the extension, import structured graph data, and start exploring!

you might want to explore


Why, how, what? —Just ask the diagramming experts!

Our team is happy to advise you – no strings attached. Let's talk about your project and find the perfect solution for your needs!
E-mail: hello@yworks.com
Your message has been sent.
Your request could not be sent. Please reload the page and try again.
If the problem persists, please report the error to webmaster@yworks.com.
Learn more in our privacy policy.