Products
Downloads
Demos
RSS Newsfeed
2022-1-11
yWorks Year in Review: 2021
As we reflect on 2021, collaborative work and visualizing large datasets stand out as diagramming challenges, creatively solved. Let’s revisit the highlights together...
2021-12-21
Remote teamwork – powered by graphs
How ArenaCore supports collaborative development of ICT solution architectures.
2021-12-17
yWorks software and services are NOT affected by Log4j vulnerability
Good news for yWorks customers: yWorks doesn't use the Java-based Log4j logging utility.
2021-11-17
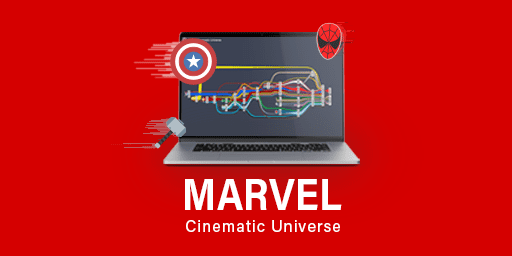
Mapping Marvel’s ‘Universe’ as a Graph
Making of: How we visualized all of the Marvel movies in a beautiful – and interactive – diagramm with yFiles.
2021-6-30
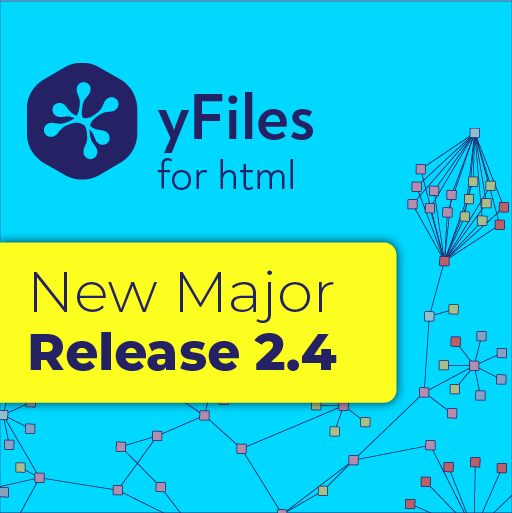
yWorks releases version 2.4 of yFiles for HTML!
The new yFiles versions in 2021 come with a many new features. Specifically for the web version yWorks invested heavily into developer experience and performance.
2021-6-8
Visualizing factory workflows at Airbus
How Airbus visualizes specific technical dependencies, without building a graph library from scratch.
2021-5-25
Outsmarting cybercrime — with network diagrams
How Langner, Inc. uses CAD-like visualization to protect power plants and factories.
2021-4-14
Case Study: DbVis Software AB
For businesses today, working with large volumes of data is often essential for securing market share and ensuring a strong future. DbVisualizer offers a universal database tool that runs on all major OSes.
2021-1-12
yWorks Year in Review: 2020
In retrospect, we found lots of bright moments among the challenges in 2020. Let’s revisit the highlights together. Surprises await…
2020-11-10
Hacktoberfest 2020
Open-source software is crucial for the software industry. yWorks took part at Hacktoberfest 2020 to celebrate this during the month of October.
1
2
3
4
...
16
Latest Blog Posts
Working with Graphs in Augmented - and Virtual-Reality
RobyGraph Cosmic Graph Strategy
From Experiments to Agents: How yWorks Uses AI to Democratize Graph Visualization
Making AI-generated diagrams useful and interactive
Enabling LLM development through knowledge graph visualization
Use Cases
Business process management
Company structures
Data management
Supply chain management
Test and experience
yFiles free
of charge!
Free support
Fully functional
100+ source-code examples
Try now