Products
Downloads
Demos
RSS Newsfeed
2023-7-10
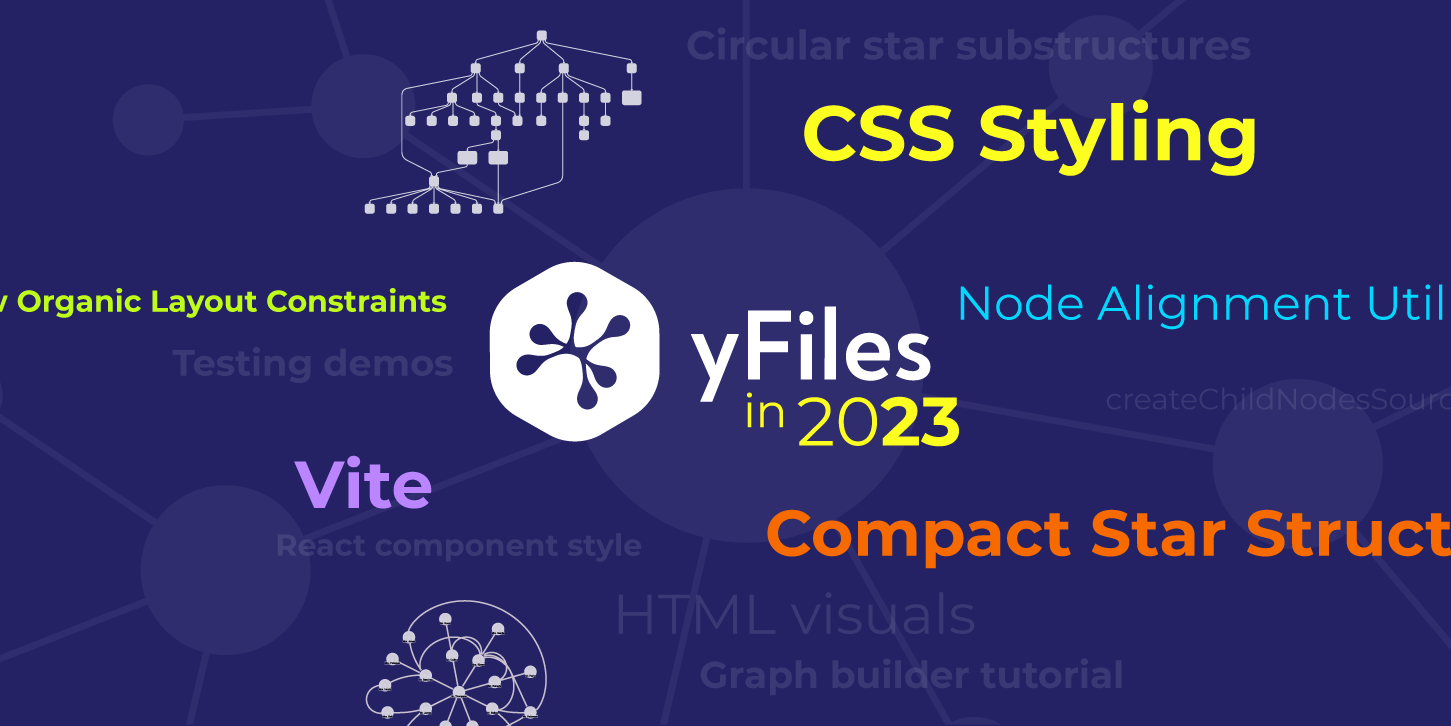
Introducing yFiles for HTML – Major Release Version 2.6
yFiles for HTML version 2.6 brings a wealth of powerful new features and improvements that strengthen the graph visualization capabilities of developers.
2023-6-7
ChatGPT and yEd Live
Generate diagrams from a simple text description in yEd Live with ChatGPT.
2023-5-4
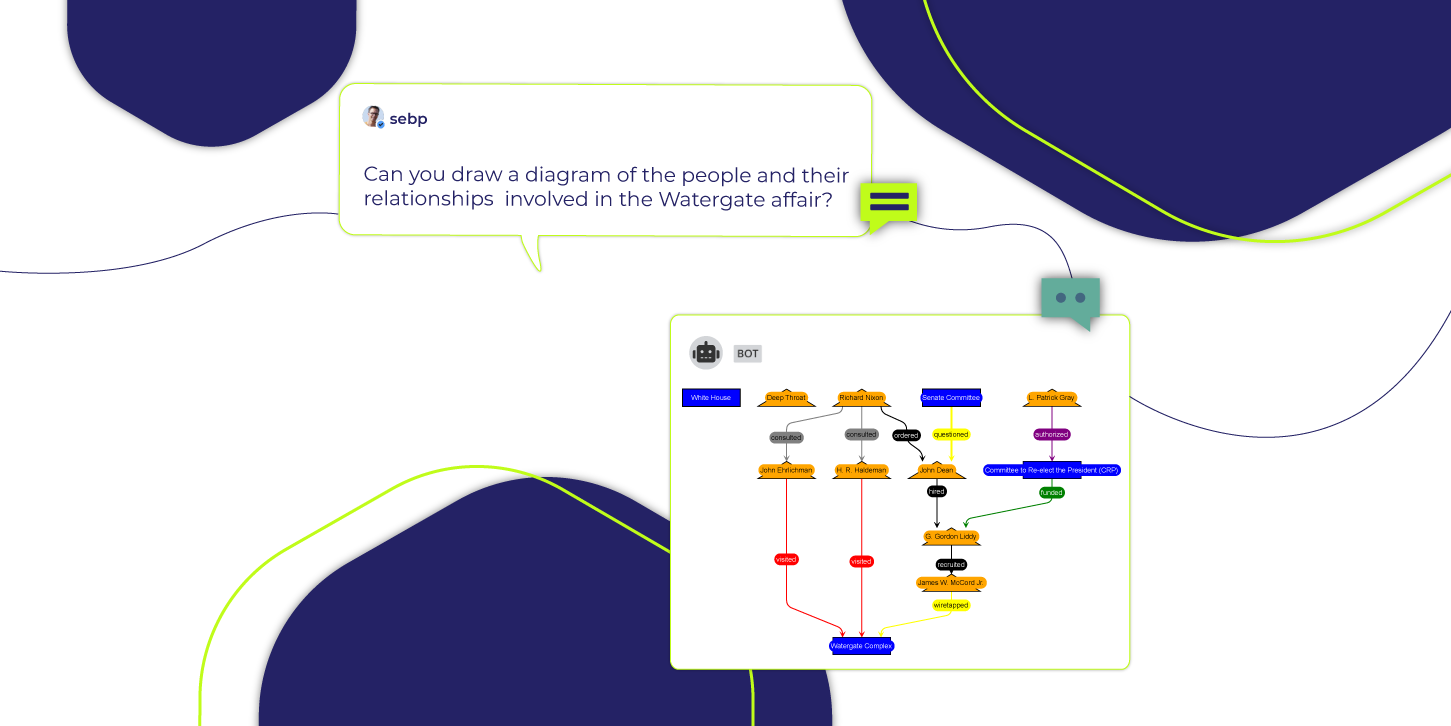
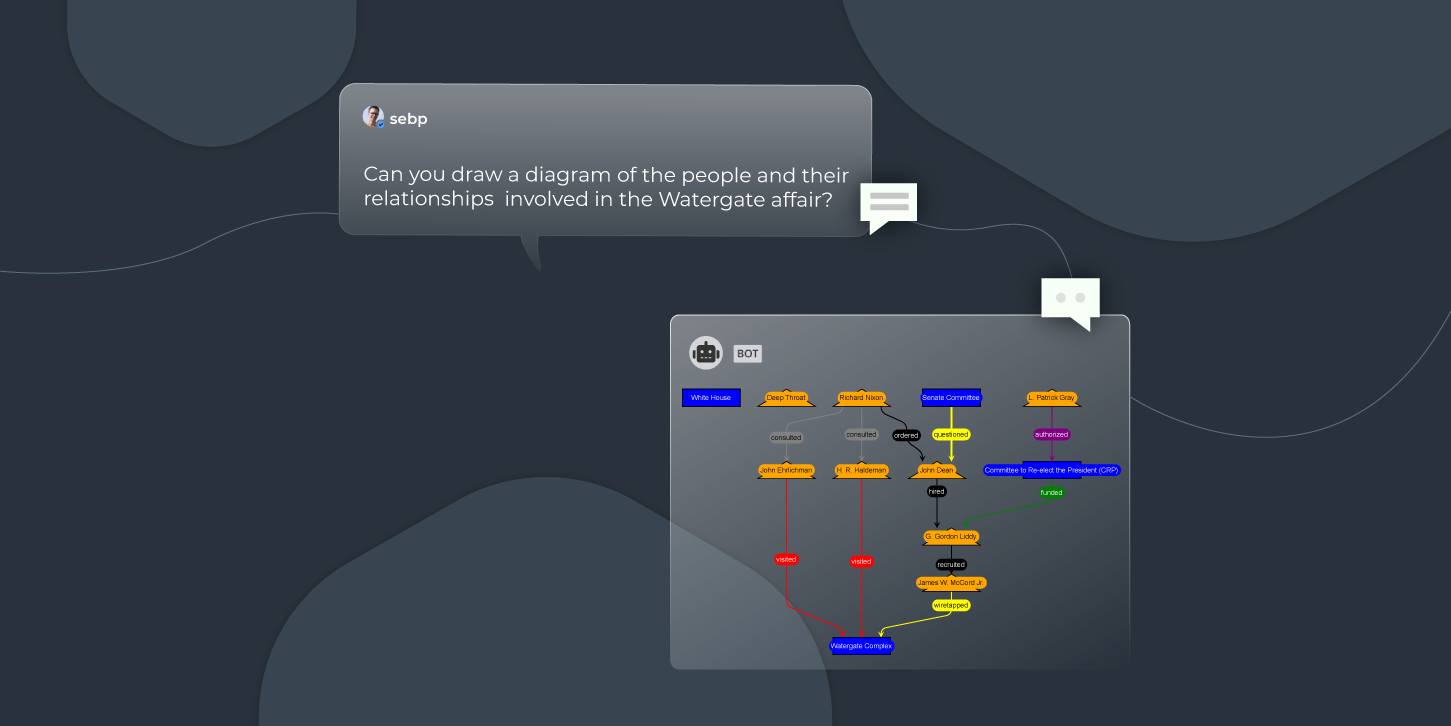
Diagramming with ChatGPT! 🤖
Unleashing the power of graph visualizations with ChatGPT.
2023-3-21
Understanding the flow of data with graphs
How data solution automation vendor Varigence uses diagrams to enhance the benefits of data.
2023-1-19
Celebrating a Graph-tastic Year
As we reflect on 2022, we review the key moments and milestones of the past year. From new product releases to industry events, it's been a busy and exciting year. Let’s revisit the highlights together...
2022-11-3
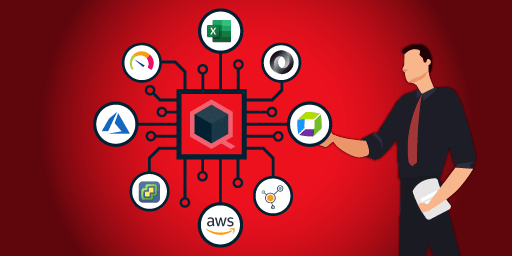
Make the right IT decisions – with the help of diagrams
How up-and-coming software developer qbilon GmbH optimizes IT landscape analysis with visual representation.
2022-10-14
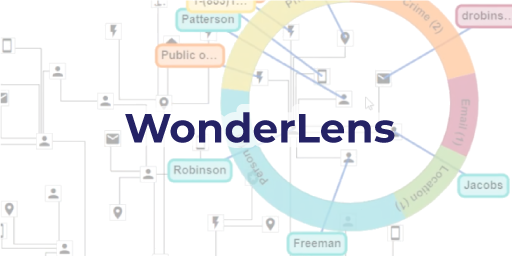
The interactive sneak-peek graph explorer
“Wonderlens“ - this year's winner team of our annual “Project Days“ developed an alternative approach to graph exploration, using the metaphor of a magnifying glass.
2022-8-3
Meet yFiles for HTML, version 2.5!
The new yFiles versions in 2022 come with a many new features, including a set of beautifully hand-crafted visualization implementations. Specifically for the web version yWorks invested heavily into the feature set of the WebGL 2.0 rendering backend.
2022-5-19
Keeping personal info private – with the power of graphs
Companies need to model all the “players” involved in processing personal data as well as all the relationships between them.
2022-1-25
Visualizing data to make the world a safer place
How Pandora Intelligence specializes in analyzing large data volumes, using proprietary AI and deep-learning algorithms.
1
2
3
...
16
Latest Blog Posts
Working with Graphs in Augmented - and Virtual-Reality
RobyGraph Cosmic Graph Strategy
From Experiments to Agents: How yWorks Uses AI to Democratize Graph Visualization
Making AI-generated diagrams useful and interactive
Enabling LLM development through knowledge graph visualization
Use Cases
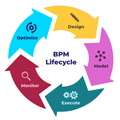
Business process management
Company structures
Data management
Supply chain management
Test and experience
yFiles free
of charge!
Free support
Fully functional
100+ source-code examples
Try now