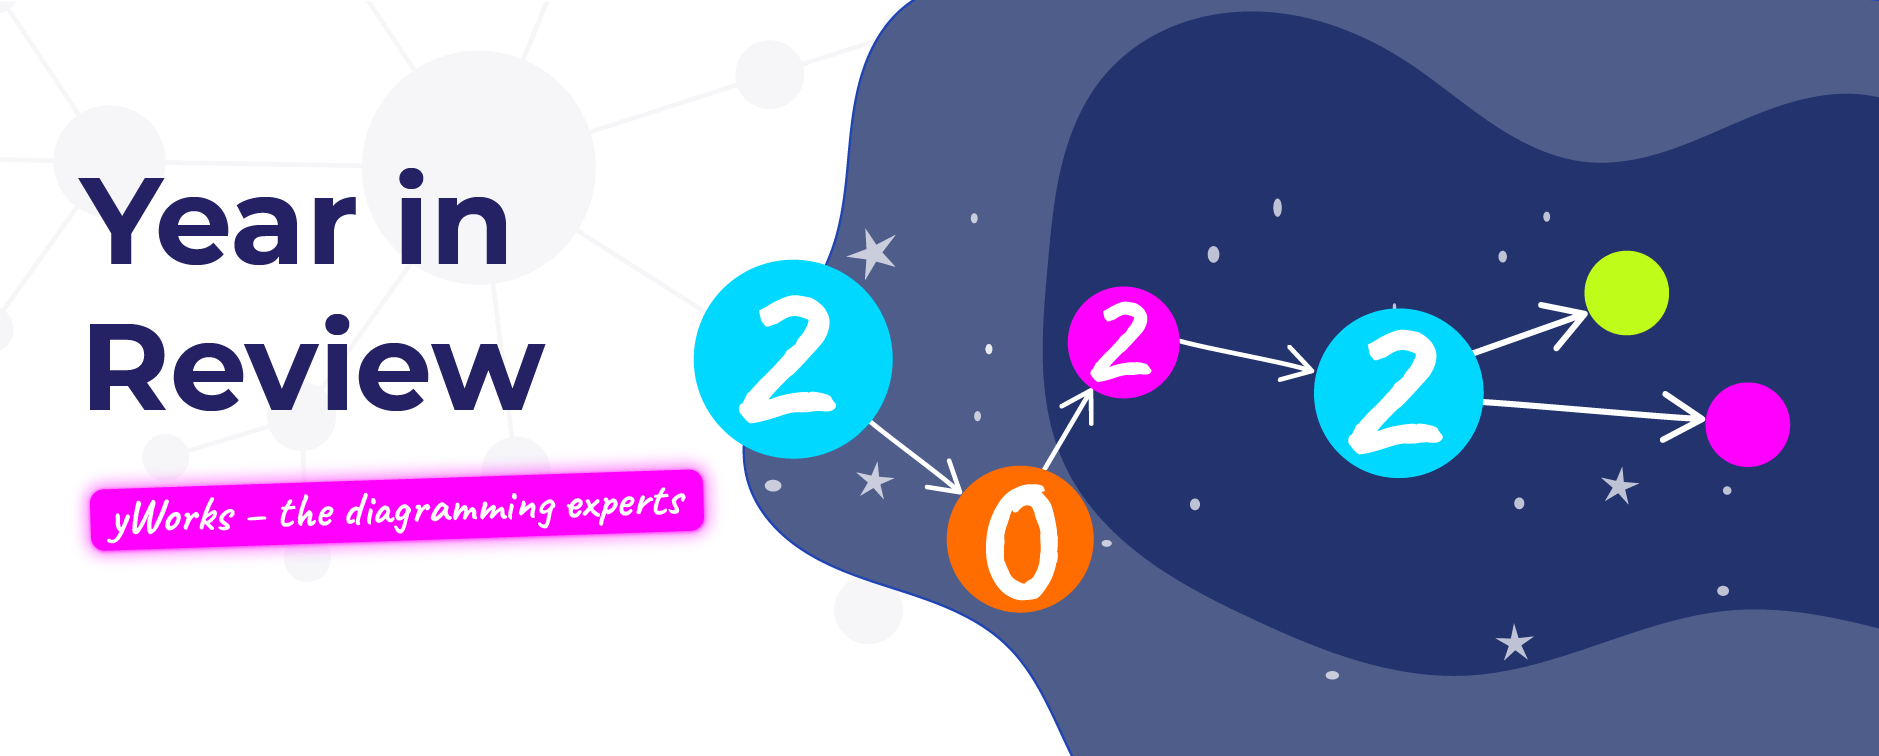
It's that time of year again – time to reflect on all of the amazing things we've accomplished at yWorks over the past twelve months. And let us tell you, it's been a wild ride! This year, we've been busy bees, releasing new products and updates left and right. But the one that has everyone buzzing is the launch of yFiles Graphs for Jupyter. Finally, Python developers can join in on the fun and add some seriously impressive graph capabilities to their projects.
Let's not forget about all of the updates and improvements we've made to our existing products. It's been a non-stop year of innovation and growth for yWorks. So grab a slice of celebratory cake (or your favorite snack, we don't discriminate) and join us as we take a look back at all of the amazing things we've accomplished in 2022. It's been a blast, and we can't wait to see what the future holds.
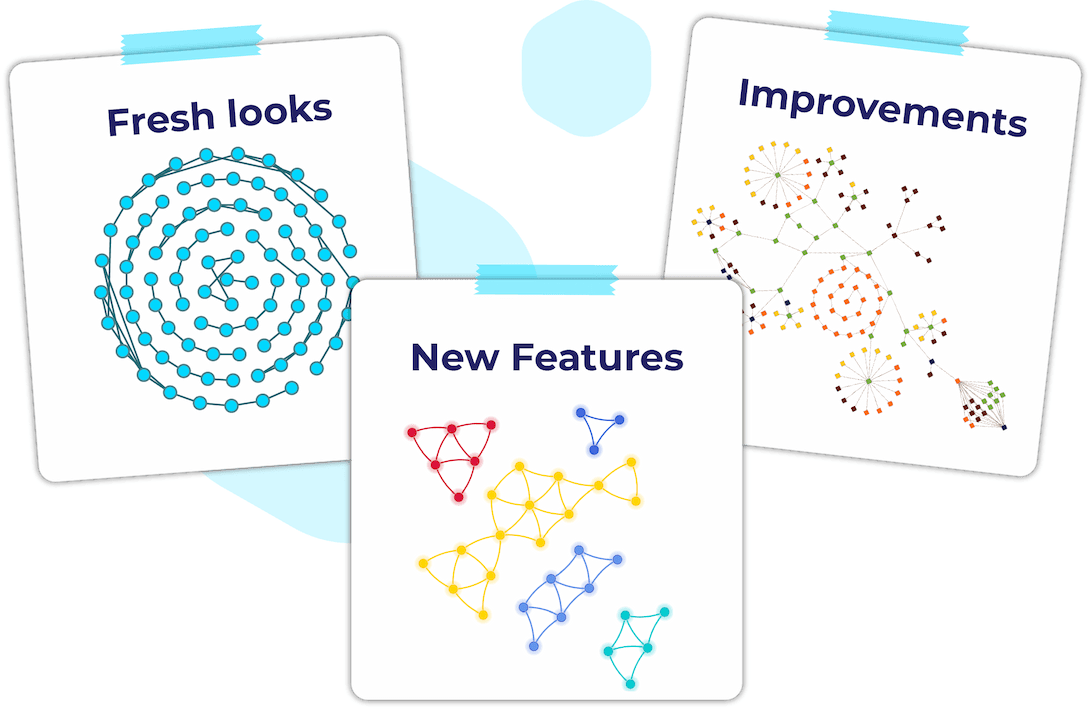
Graphs, graphs, and more graphs: yFiles' 2022 delivers the visualizations and the power

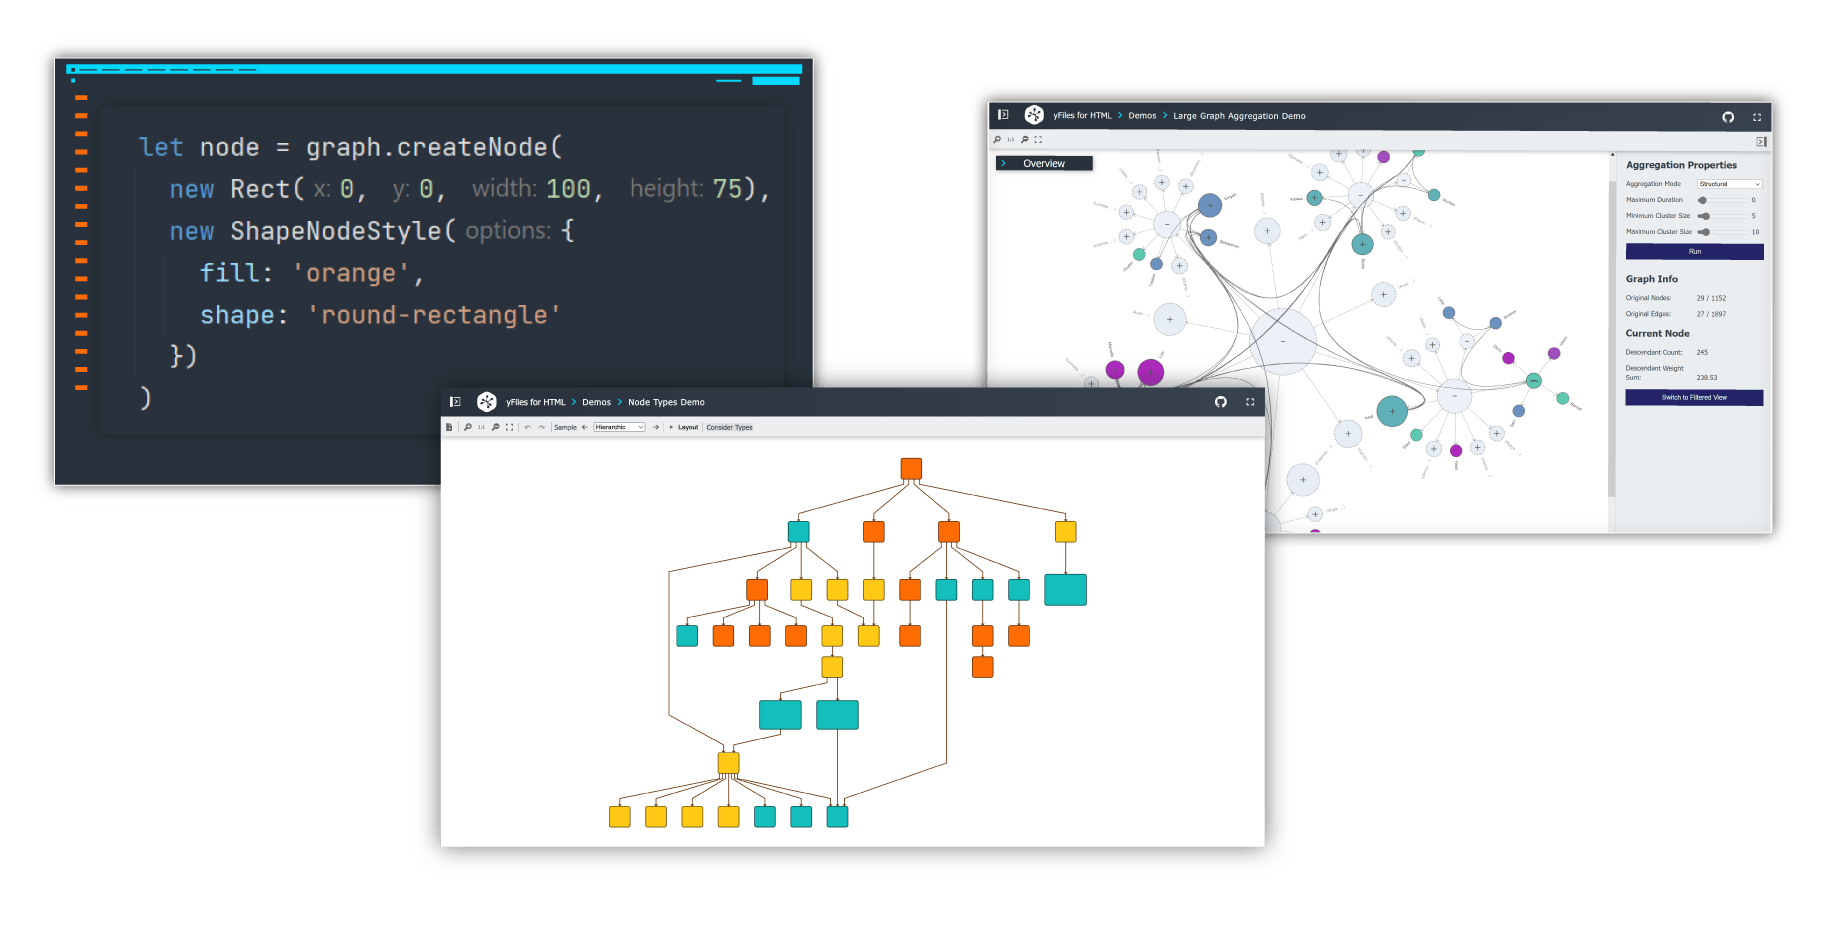
With the help of the experienced developer team, awesome new releases have been published. First up, we launched yFiles for HTML 2.5, a revolutionary update for developers everywhere. With its automatic layouts, interactivity styling options, and WebGL2 rendering capabilities, this update makes it easier than ever to create stunning, functional graph visualizations for web-based apps.
The updates to yFiles have also benefited our beloved graph editor, yEd which we have given a major update, adding new layout algorithms like Compact Disk and Cactus Group Layout, as well as a ton of other features and enhancements. Plus, we had a hugely successful release of Data Explorer 1.5.0, which included custom relation styles, geospatial map layout, and improved node template design.
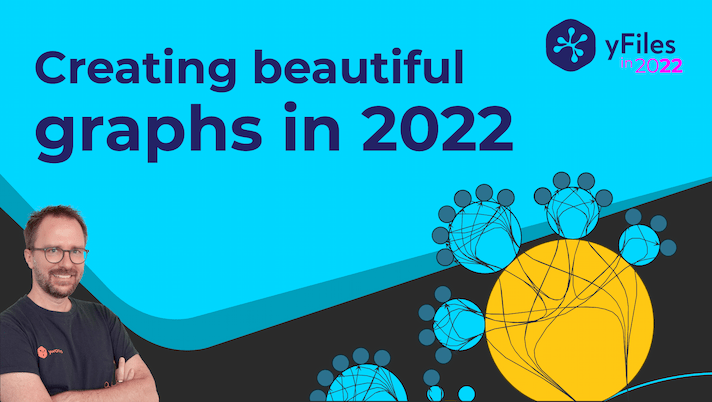
Discover the power of yFiles Graphs for Jupyter in your Python workflow

Finally – back to the source of that buzzing – we released yFiles Graphs for Jupyter, a revolutionary graph visualization widget for Python developers that we offer in the Jupyter Labs and notebooks environment for free. With this product, users can easily create and customize graph diagrams right within their Jupyter environment, bringing a new level of interactivity and visualization to their data analysis workflows.
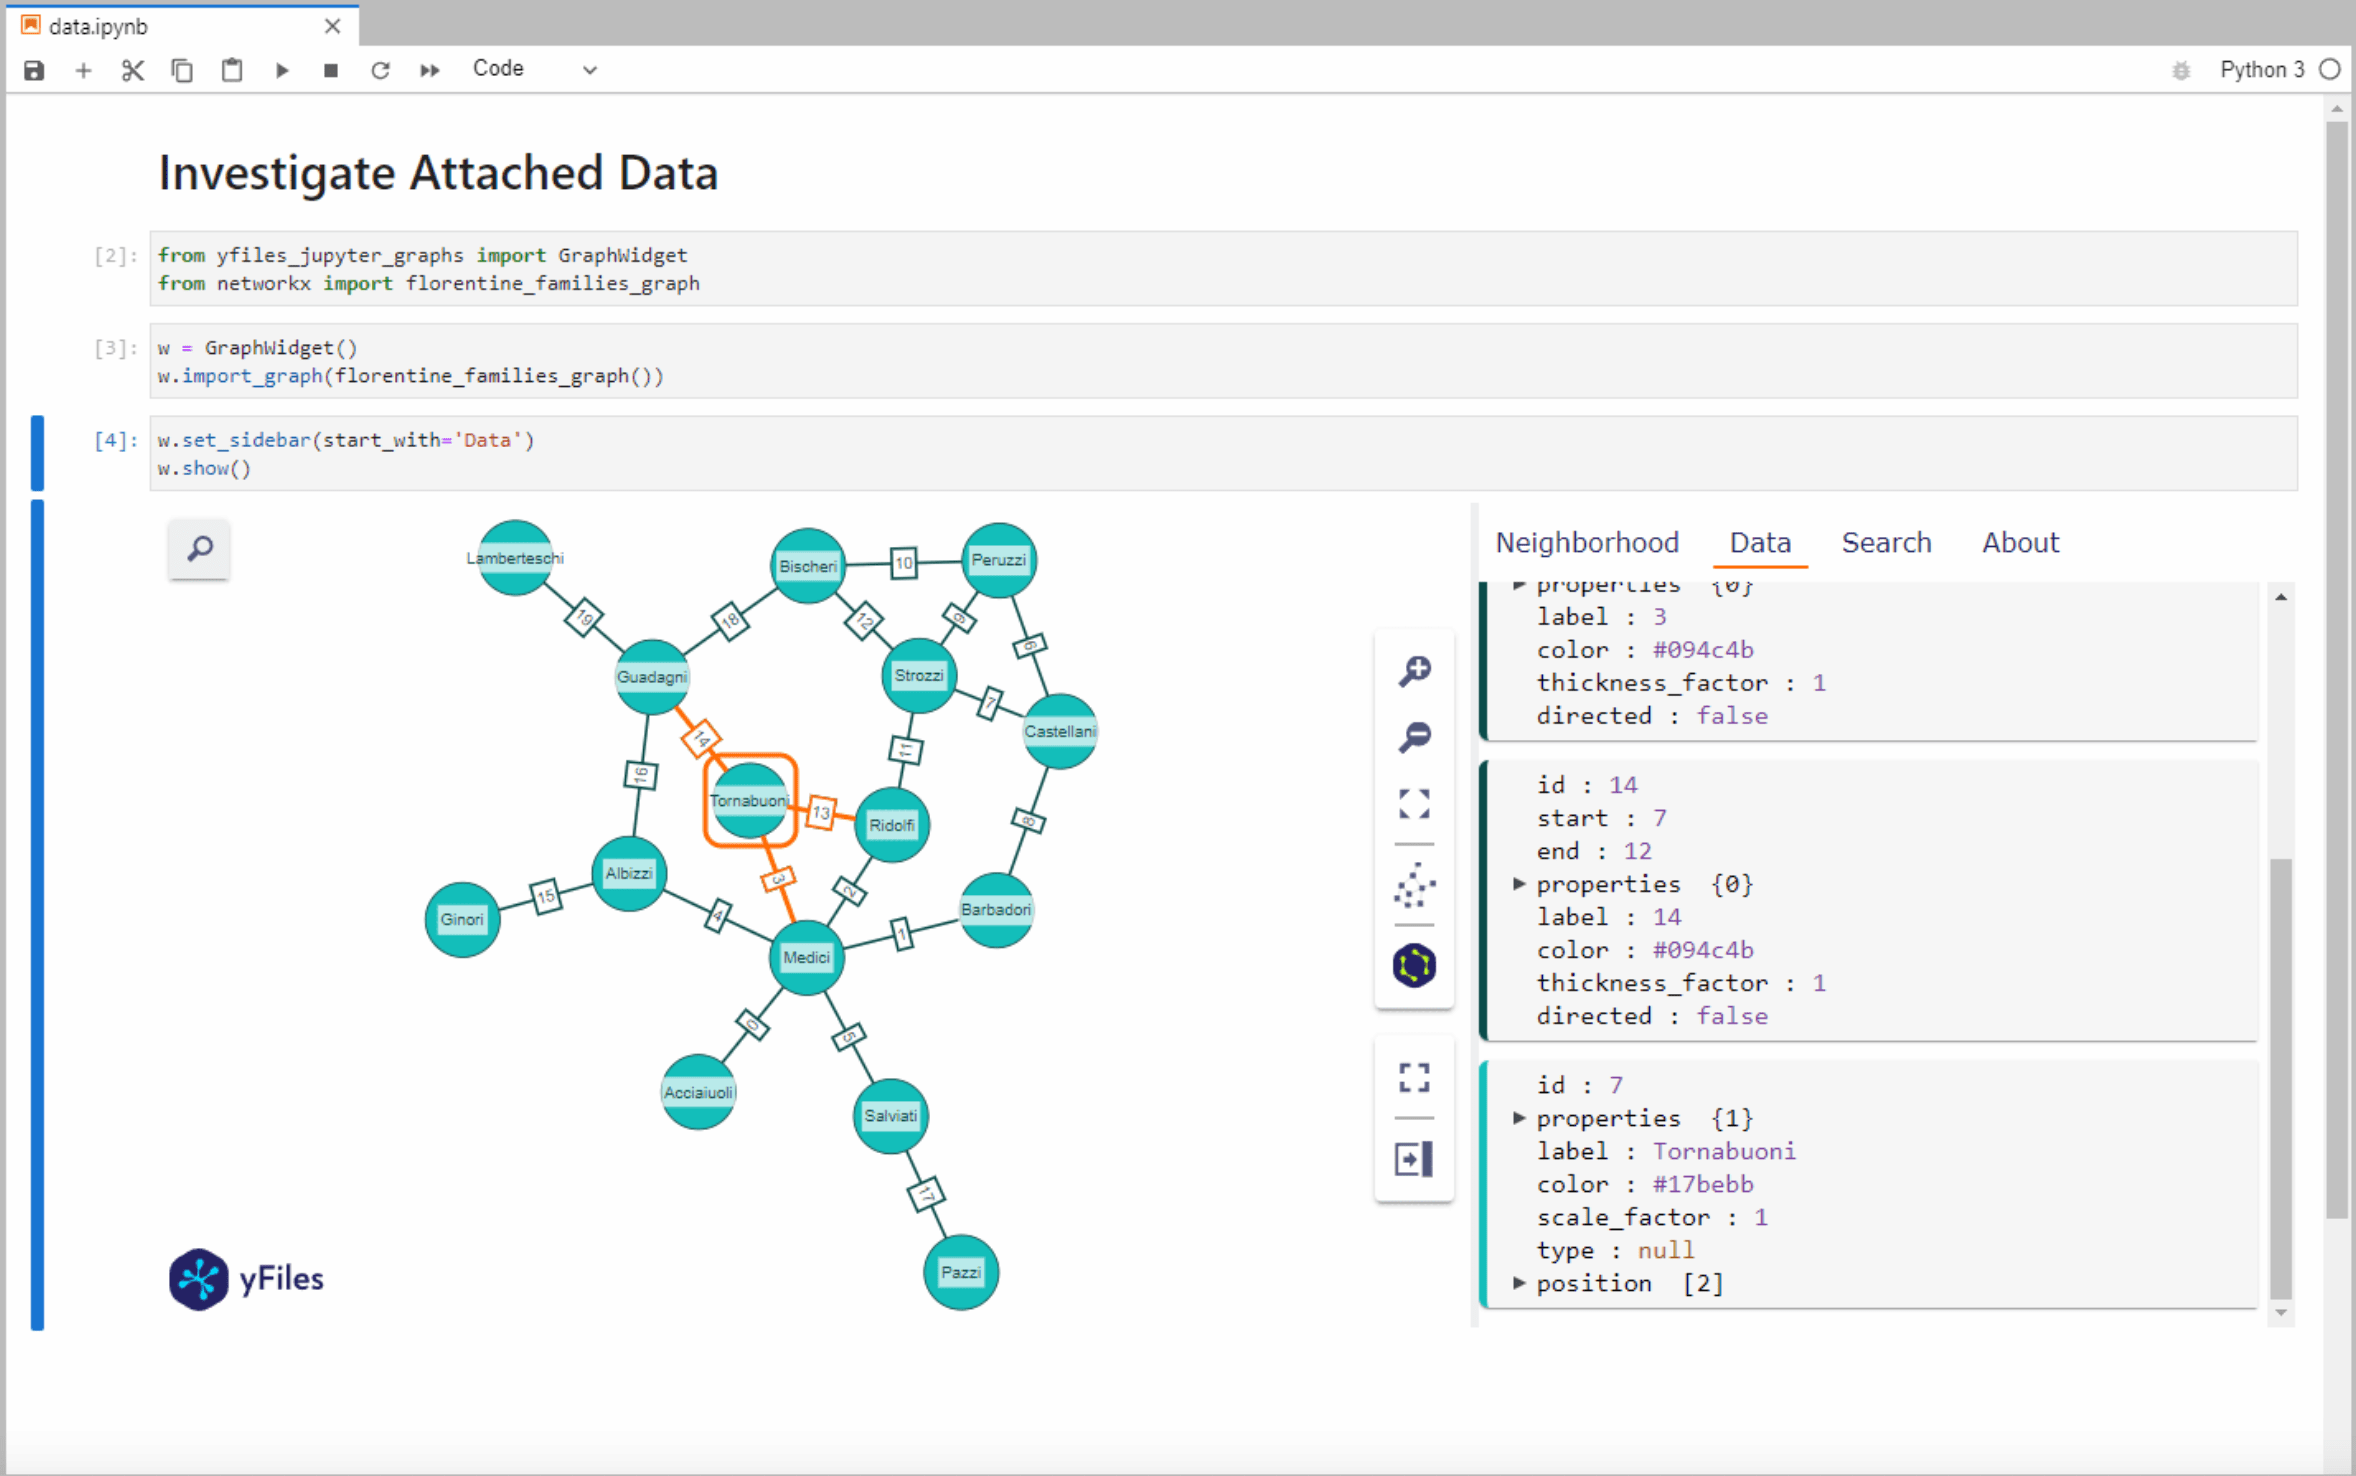
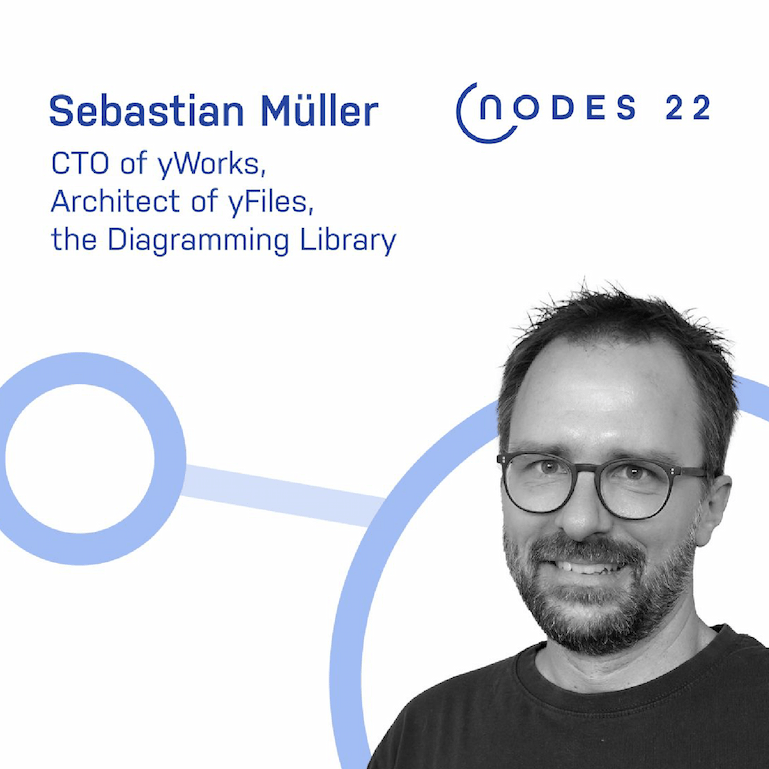
If you're interested in getting a deeper understanding of free yFiles graph visualization plugin for Jupyter Notebooks, check out the webinar "Easy dataviz in Jupyter - with yFiles" where our CTO, Sebastian shared some incredible insights on how to install and use the plugin to render, layout, and analyze graphs from various data sources in the context of Jupyter Notebooks and the Jupyter Lab.
 Easily visualize your graphs in Jupyter notebooks with yFiles Graphs for Jupyter. This widget offers interactive, performant graph visualization for data scientists, and is freely available for all.
Try it out today and share the good news with your fellow data scientists!Sebastian Müller, Chief Technology Officer, yWorks
Easily visualize your graphs in Jupyter notebooks with yFiles Graphs for Jupyter. This widget offers interactive, performant graph visualization for data scientists, and is freely available for all.
Try it out today and share the good news with your fellow data scientists!Sebastian Müller, Chief Technology Officer, yWorks
Make team editing a breeze with Graphity
This year, we released Graphity 2.1, a major update that introduced a host of new features to help users get even more value from their data. Some of the highlights include enhanced performance, new visualization options, and improved collaboration features. Try the new collaborative editing feature.
A year of upgrades, enhancements, and exciting webinars
 Data Management with yFiles
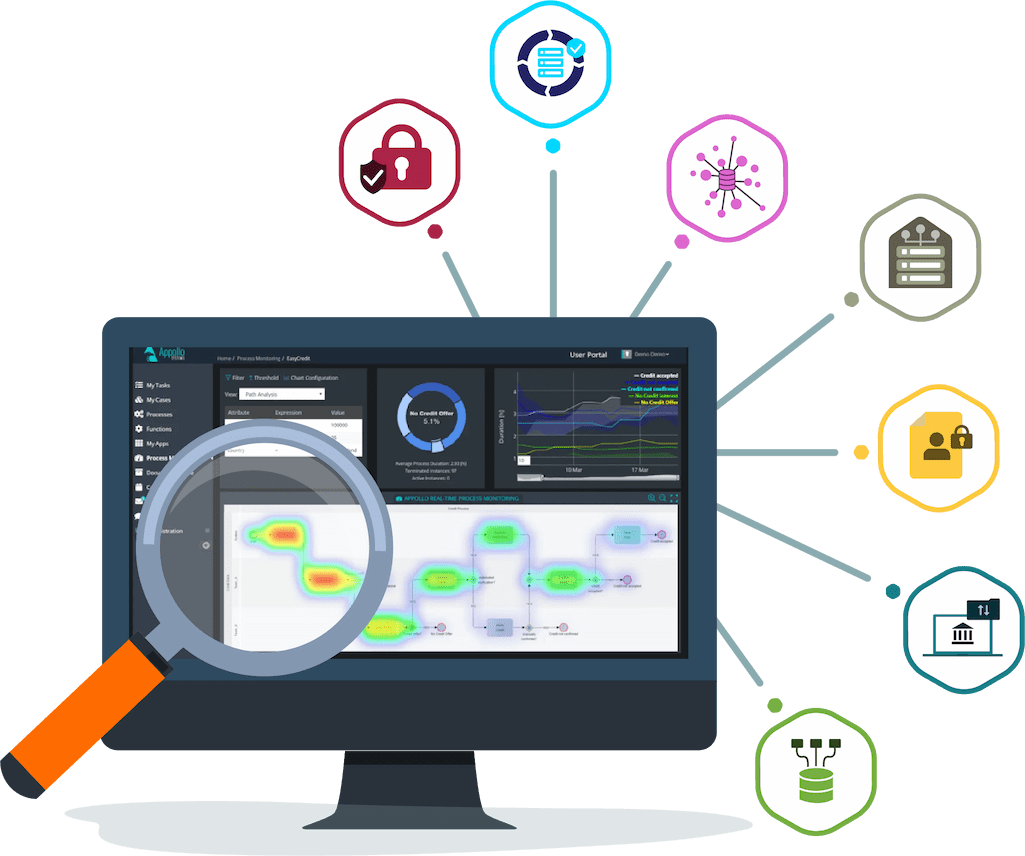
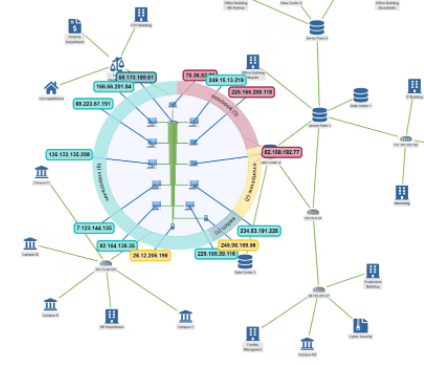
We've been hard at work creating commercial clips to showcase the capabilities of our tools and how they can be used in a variety of settings. But it's not just about the visuals – we've also been busy publishing use case articles covering a range of topics, including data management, business process management, and supply chain management. These articles provide valuable insights for developers, data scientists, and anyone interested on how our tools can be used in practice.
Are you interested in a specific case study? Or do you want to share your experience using yFiles with us? Then reach out to us.

This year, we held a series of online events that offered valuable insights and information about our products and services. However, the real highlight of this year's webinars was our series on layouts. In these webinars, we took an in-depth look at how our layout algorithms can be used to create visually stunning and effective visualizations. And we won't be slowing down – we have a series of exciting webinars planned for 2023, so stay tuned for even more valuable information and insights. "See you online!"
 I take great pleasure in working as part of the yWorks layout team at the interface between graph algorithms and network/data
visualization. I can't wait to share my passion for graph drawing in our upcoming webinar series in 2023. Stay tuned!Dr. Benjamin Niedermann, Layout Expert, yWorks
I take great pleasure in working as part of the yWorks layout team at the interface between graph algorithms and network/data
visualization. I can't wait to share my passion for graph drawing in our upcoming webinar series in 2023. Stay tuned!Dr. Benjamin Niedermann, Layout Expert, yWorks
Boost your productivity with the improved yFiles sourcecode demos
One of the standout achievements of this year has been the improvements we've made to many of our demos. These changes have made it easier to navigate and understand the yFiles demos, and we've received great feedback from our users on the enhancements. In addition to these changes, we've also seen a significant increase in new licenses and customers, which is a validation of the quality of our products and services. We've also improved our support offerings, and we've undergone security audits to ensure that our systems are as secure as possible.
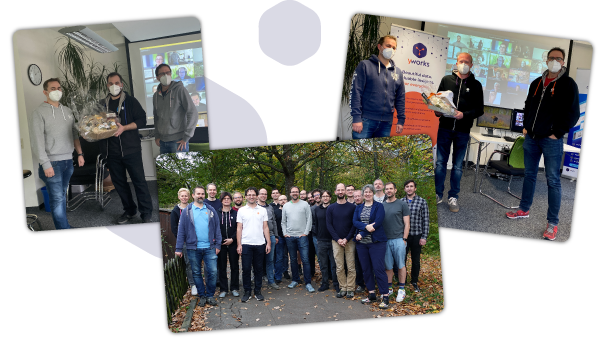
Professional achievements, team bonding, and the debut of Wonderlens
It's been a banner year for the yWorks team in 2022, and we've got plenty of accomplishments and fun events to show for it.
Our CTO Sebastian had the opportunity to speak at prestigious industry conferences, including NODES2022, where his talk focused on using Python and Cypher to explore and analyze data in Neo4j graph databases. We've had the pleasure of attending various events at the University of Tübingen, where computer scientists, mathematicians, and students come together to share ideas and perspectives. We always look forward to these events as they provide a great opportunity to connect with like-minded individuals and build a sense of community.
The Graph Drawing 2022 conference took place in Tokyo, and we were proud to be a sponsor. Despite not being able to attend in person, we were exited to hear that one of our colleagues won first place in the live challenge at the conference. We are already looking forward to the next Graph Drawing conference in Sicily in 2023.
In addition to our professional achievements, we also had a number of fun team-building events this year. Our annual company outing took us to Campus Galli, and we enjoyed playing soccer-golf. (Yes, that’s a thing.) We also had a summer barbecue with our families, and a Christmas party with bowling, beer and burger.
During Corona, our Project Days couldn't take place in person, but we're excited to announce that they're back and better than ever! These internal events give our team the opportunity to come together and work on passion projects outside of our regular duties. It's always a pleasure to see the creativity and innovation that comes out of these events.
This year, the Wonderlens team stole the show with the development of a tool for interactive exploration of diagram visualizations. We're excited to have added this tool to our Data Explorer releases, as it allows users to easily navigate and understand complex data sets through engaging visualizations.
We can't wait to see what amazing projects are unveiled at next year's Project Days – stay tuned, it's going to be exciting!
From y to why not: Professionals changing the game

"Hark! The herald angels sing, 'Another new member joins our team!'” This years' new team members, from bright-eyed students to seasoned professionals, each brought something unique to the table. At the same time, some familiar faces returned to the fold, ready to take on new challenges and contribute to our growing success.
We celebrated the work anniversaries of three employees this year, who together have a total of almost 50 years of service with yWorks. This is a testament to our commitment to creating a positive and supportive work environment for our staff.
All in all, it's been a year of growth and excitement for yWorks, and we can't wait to see what the coming year brings. Bring on the new challenges and projects, we're ready to tackle them with our new and improved team!
Behind the scenes at yWorks
At yWorks, it's not just all work and no play. After hours, we love to come together for some fun and relaxation. Our after work parties are legendary, with pizza, snacks, and all kinds of games from Dungeon and Dragons to Mario Kart. We even have a tradition called yKulturnacht, where we get together to watch movies or TV shows after a long day at the office. It's a great way to unwind and bond with our colleagues.

As our team continues to grow, we've had to make some changes to our setup. We now play Mario Kart with four consoles at once, and there's always room for one more player.
Wanna join the yFamily?
hello@yworks.com
yWorks wraps up 2022 with a bang and gears up for an even better 2023

All in all, 2022 was a great year for yWorks, and we are looking forward to continuing to deliver powerful and easy-to-use graph visualization solutions to our customers. We are truly grateful for the support and loyalty of our customers, colleagues, and friends, and we can't wait to see what 2023 has in store!
Happy diagramming!
Your diagramming experts