
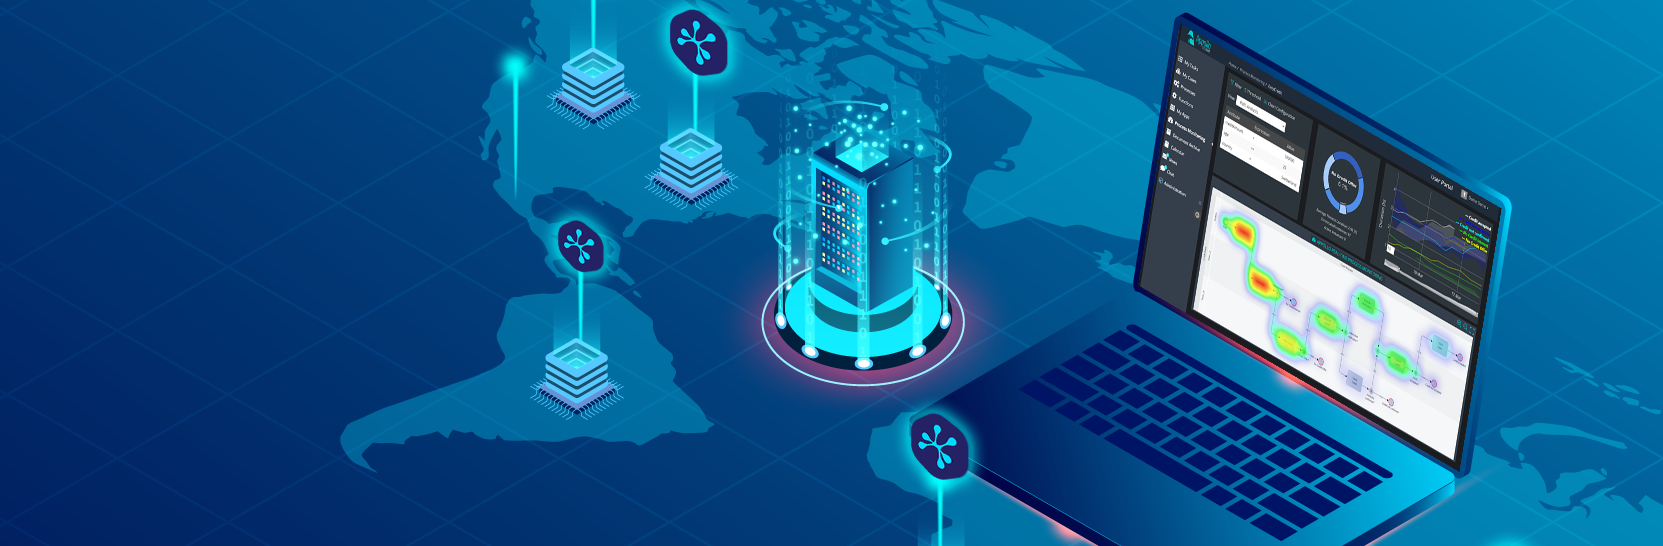
Diagramming for
Data Management
with yFiles
Use diagrams to optimize the data lifecycle, map data strategy, and ensure data security and quality.
Every building needs a firm and reliable foundation. It may not be visible, but it’s absolutely essential. For a modern business keeping pace with digital transformation, this basis is data.
Stored on servers or devices, millions of bits and bytes encode personal and corporate details that can enable far-reaching insights and decisions. But there’s a catch: Unless this data is error-free and searchable, it’s almost useless. Data collection, storage, and documentation must also comply with legal requirements, and databases need to be compatible with company software.
Data management includes a wide array of measures to ensure data quality, consistency, accountability, and security – throughout the data lifecycle. Its goal is to make data usable for optimum support of your company, while upholding security standards and complying with privacy regulations. Data management also lays the groundwork for successful Business Process Management.
In modern business, flexibility and individualization of data requirements are a key to success. To optimally support existing data structures,
systems, and their interactions, a strong visual representation is often needed. Visualization helps staff fully understand the many ways data is used in the company.
Because of the many, and changing,
relationships between data and business processes, implementing your own visualization solution is ideal.
But this requires considerable effort.
Luckily, there’s an excellent solution that makes this really easy: A mature, highly customizable software library of ready-to-use components.
yFiles, our diagramming SDK, lets you visualize and edit all aspects of data management. Clear, interactive graphs quickly and easily display the path, processes, and transformations taken to produce a specific piece of information. Visual representations of data models and architecture help to organize your data and metadata. In addition, yFiles offers a wide range of automatic layouts and custom visualizations to prepare data for visual analytics and reporting.
Data analysis, and data-driven decision making, are sometimes also seen as part of data management. Naturally, visualization plays an indispensable role here showing capacity limits, outliers, bottlenecks, clusters, and much more. However, diagramming and graphing can lend support at every stage of the data lifecycle.
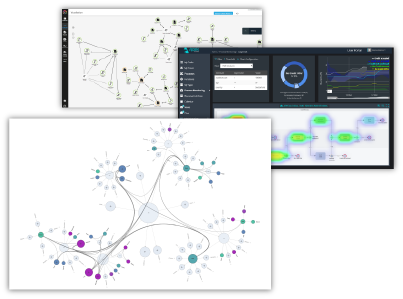
Online demos for data analysis


What to expect on this page
The yFiles diagramming library
The yFiles SDK is designed especially for diagram visualization. Its advanced layout algorithms can quickly transform your data into readable, informative, and appealing diagrams. And yFiles is much more flexible than a generic graph editor or app: It lets you create tools tailored to your specific requirements. It provides a graph visualization component, graph editor features, and an extensive set of algorithms for automatic data arrangement.
Software developers use yFiles to display, edit, and optimize data flow, data warehousing, data lifecycle, and more. Importing and exporting data is effortless with yFiles: yFiles is compatible with every data format and data source and is available for all the major platforms: Web, .NET and Java.
Benefits in a nutshell
layouts
use case
label
code examples
support
customizable
Key challenges of data management
Customers use the diagramming SDK yFiles to support many different tasks: from planning and visualizing systems, process chains, and data architecture, to designing databases for efficient storage and compliant documentation. What’s more, data can be structured and prepared for quality management, using a very wide range of automatic layouts.

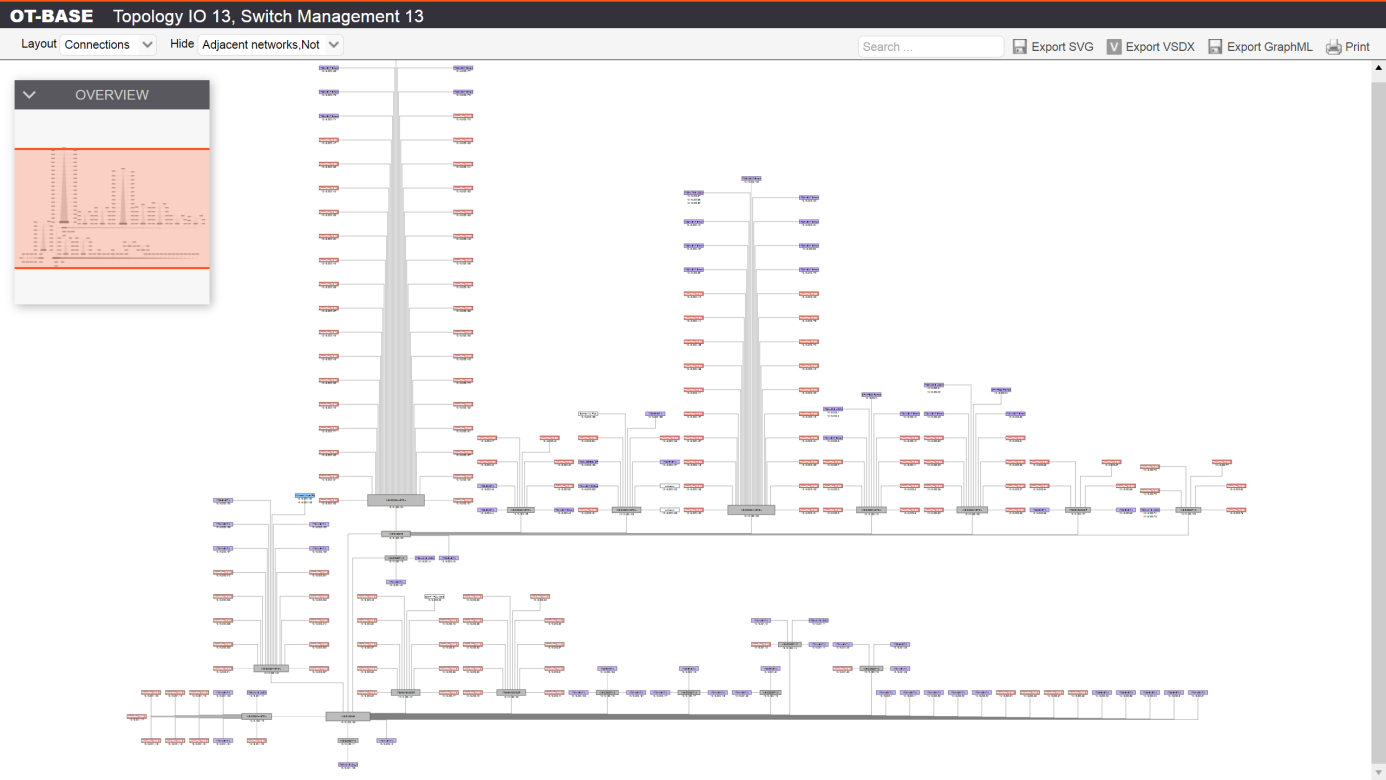
Data Warehousing (DWH)
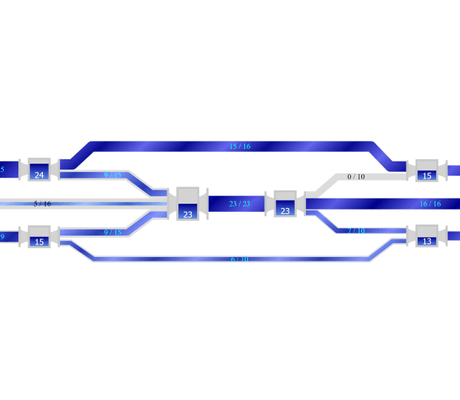
provides a central storage of historical data to understand the data lineage process. The main use-case is to understand which process interacts with which data sets, and how they are all orchestrated so that you can navigate back from a given field or value to its origins – across all involved processes. An enterprise data warehouse (EDW) makes it easy to create analytical reports and trace errors back to their source. The aggregated data often is cleansed for this purpose.yFiles lets you structure data with automatic layouts and large graph aggregation, to facilitate efficient searches, meaningful reports, and concise analysis.
Use a timeline to jump to any point in the past and track the data lineage process in real time. Clear graphs tell you how the data was transformed, what was changed, and why.
In addition, yFiles can even be used to design and monitor components for your physical and/or cloud-based Data Warehouse infrastructure, and plan the placement of elements within your system.

Data Protection
prevents the misuse of personal data. For this purpose, legislation like the General Data Protection Regulation (GDPR) requires detailed data privacy documentation, covering all stages of data collection, storage, and use.yFiles can help you better understand who has access to what data, as well as where information is stored. This enables clear visibility into unauthorized access, if data is stored for too long, accumulates in unprotected locations, or other privacy violations occur.

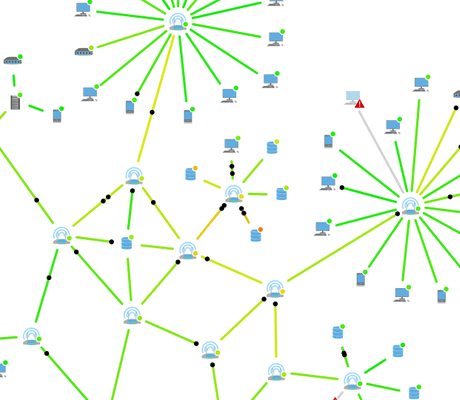
Data Security
, one of the most important aspects of data management, is protecting against data loss and unauthorized access. Measures include data encryption, Identity and Access Management (IAM), as well as backups to prevent loss or misplacement of information.yFiles helps to plan the data flow and architecture to ensure error-free operations and eliminate vulnerabilities. Visualize who has access to what data, as well as where each data item is stored. In addition, it is easy to track (or simulate) vulnerabilities and failures in real time.
When it comes to data security,
yFiles leads by example
Any tools used for data management must support data security.
That’s why yFiles focuses on data minimization, right from the start. yFiles sends no data to the outside. It even runs without an internet connection, if desired.
Furthermore, yFiles uses no third-party software, so you don't have to worry about security vulnerabilities there. Everything from one source means you have a single point of contact for all your questions and needs.
Our acclaimed support handles all concerns quickly, competently, and in strict confidence.
yFiles itself, along with the whole yWorks company, is GDPR-compliant in all areas.


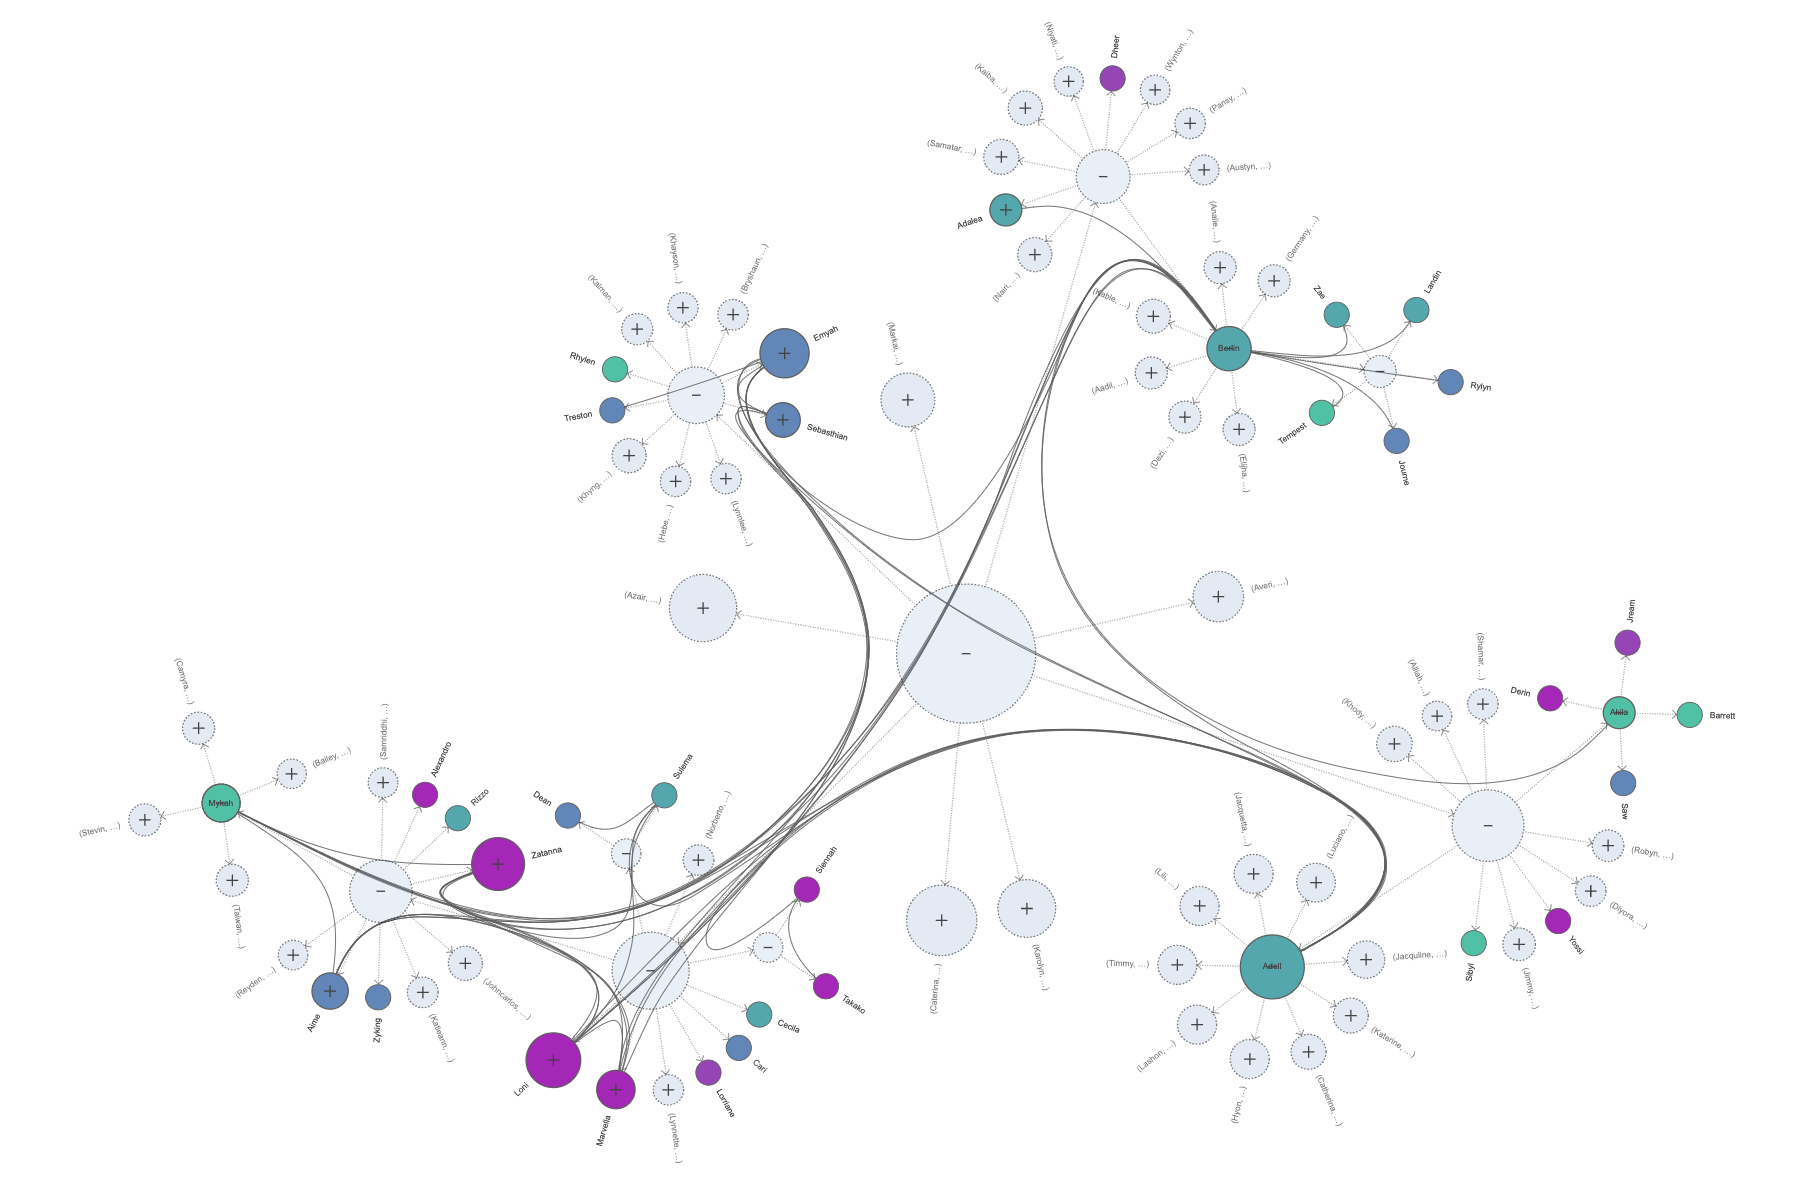
Big Data Management
involves recording, integrity-checking, and prioritizing the countless items of raw data used in your company. Filtering for specific information Allows for streamlined searches, for example. Subsequently, the recorded and stored data can be leveraged to enhance processes, bolster security, or enable Business Intelligence analyzes in the future.With yFiles, you can display the structure of how different data streams converge. In real time, you can track the data source and ensure its integrity and quality. Use smart aggregation and clustering to separate the important data from the unimportant. Later on, this makes it easy to optimize processes.

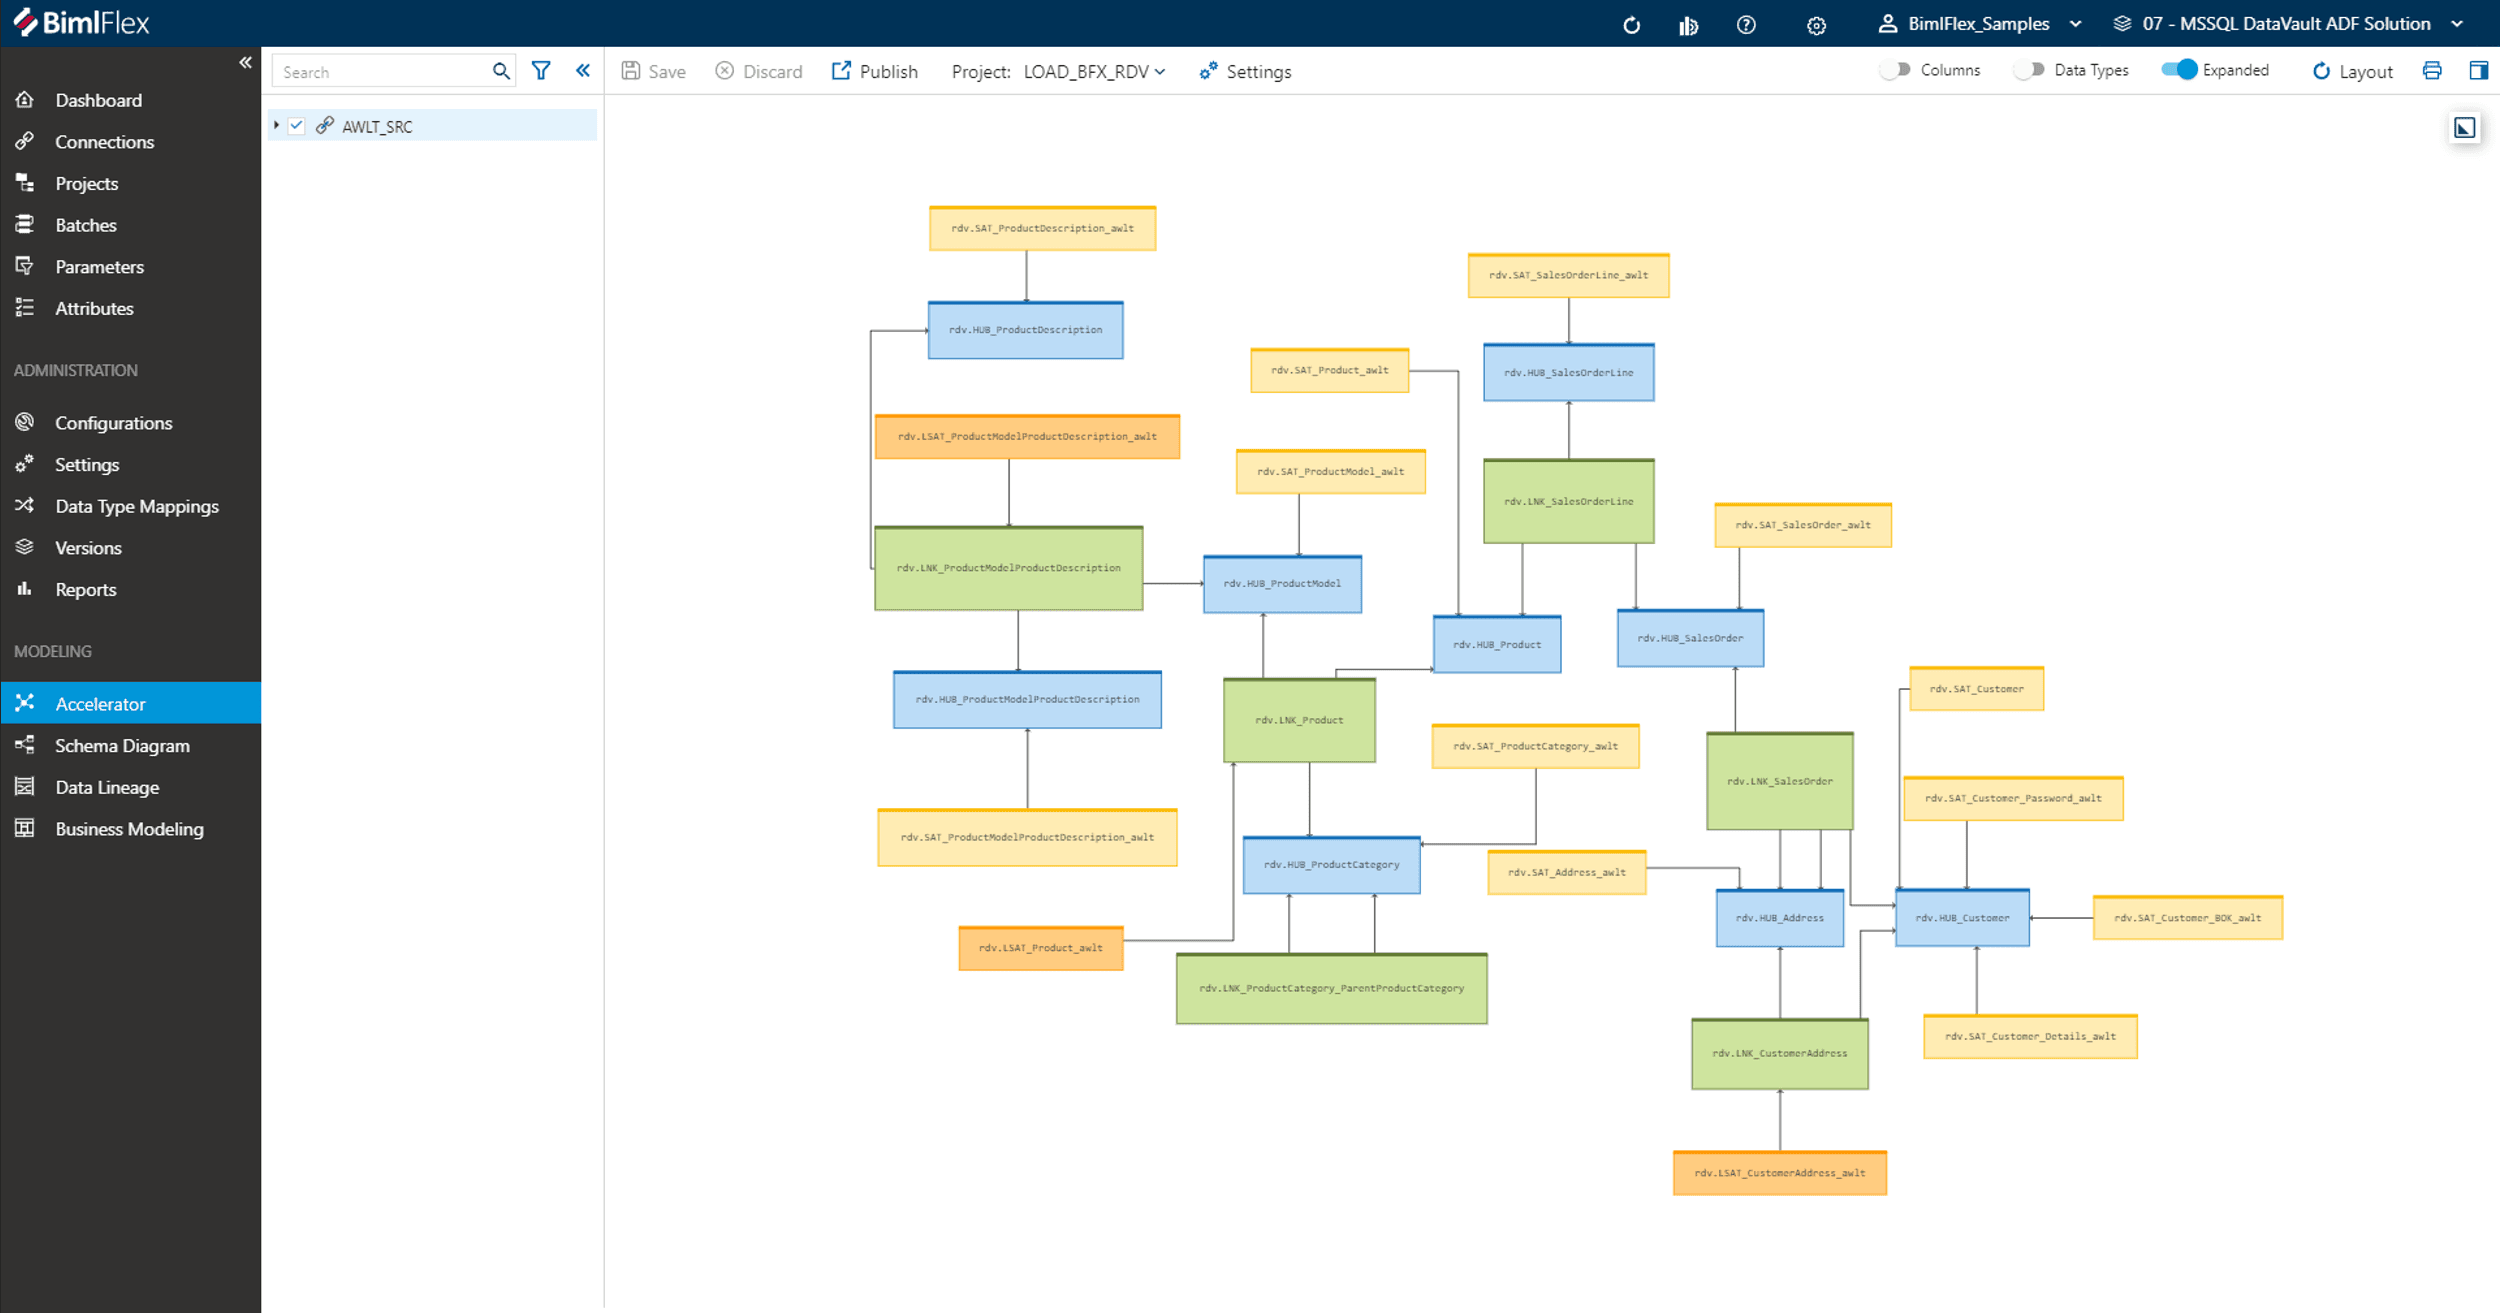
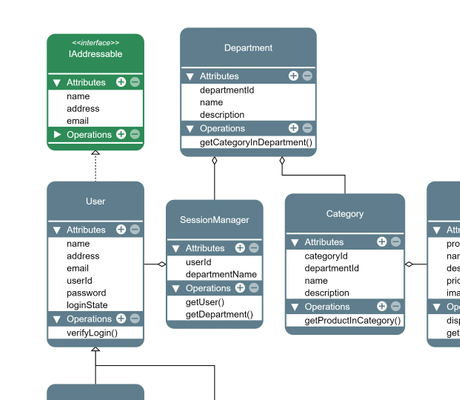
Data Modeling
makes it possible to illustrate the data types, their attributes, and how they are linked to each other within an information structure. Ensuring consistent semantics, naming conventions and standard values, this evidently supports compliance with business rules, regulations, and policies.Whether UML (Unified Modeling Language) or ER (Entity-Relationship) diagrams, yFiles lets you visually plan, build, and later edit complex data structures and ontologies. Adapt schemas to ever-changing requirements and make them understandable for other stakeholders. Custom visualizations allow you to show critical metadata directly in the graph.

Visualizing database relationships
Data Explorer for Neo4j

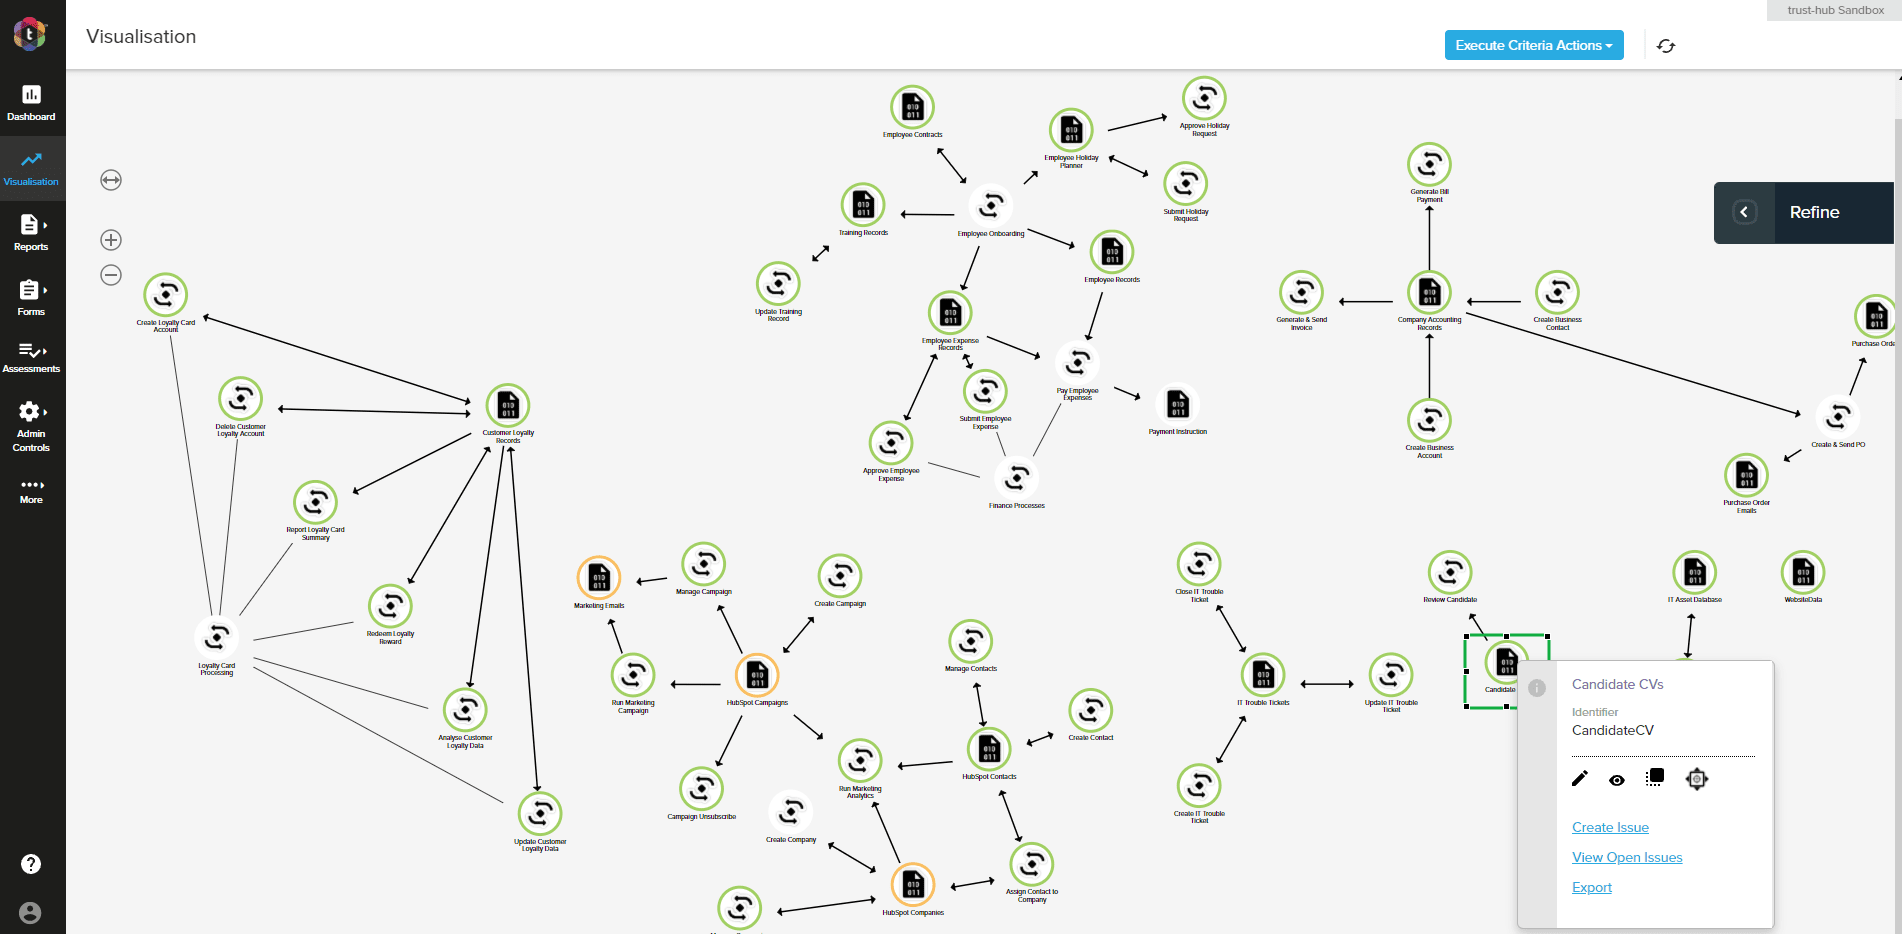
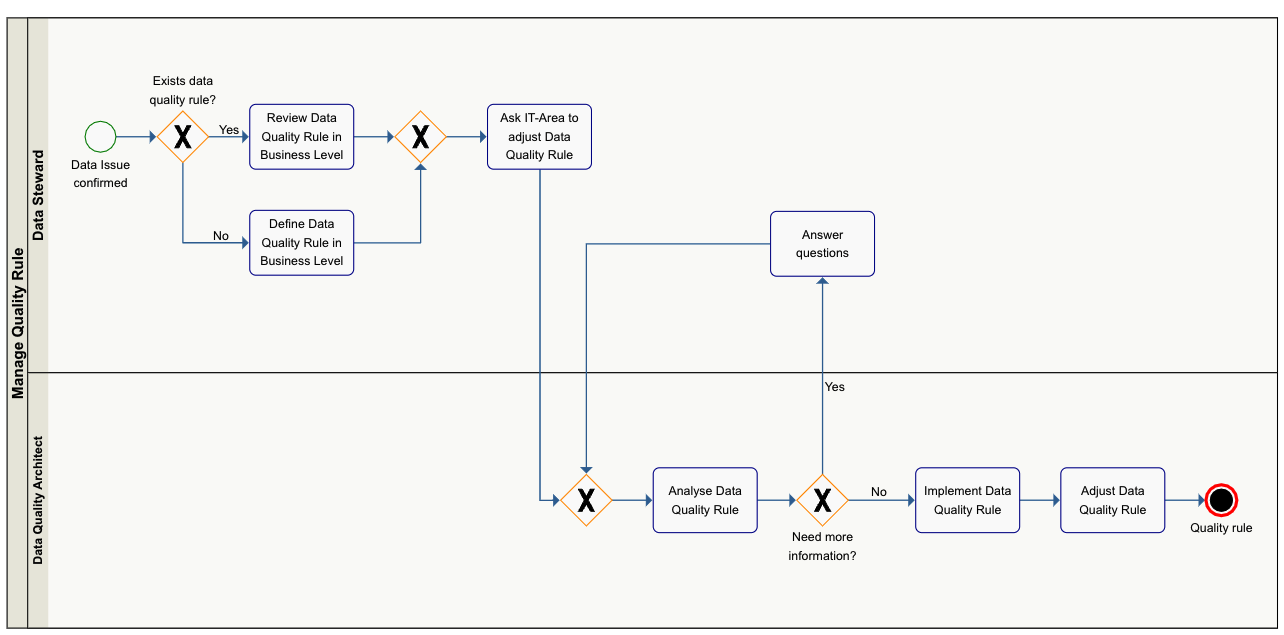
Data Governance
sets and implements rules for the data used (and/or stored) within an organization. It determines the data lineage scope, based on regulations as well as corporate strategy, while also considering critical data elements and reporting attributes. This, in turn, supports Master Data Management (MDM). MDM ensures that all standards, guidelines, rules, and policies are followed, and that the data is available, usable, consistent, accurate, and secure.With yFiles, you get a clear visualization of your data model, which helps all stakeholders to understand which policies and standards apply to which data, and whether all the approvals are in place. BPMN diagrams let you easily trace processes and make responsibilities visible throughout the data lifecycle. Even highly complex data flows can be effortlessly planned: using automatic layouts to visually represent data lineage.

Data Lifecycle Management (DLM)
refers to the various stages that data goes through: from creation to storage, use, archiving, and finally disposal. DLM requires active management of the data throughout its lifecycle, so that the status of the data is clear at any given moment. This, in turn, enables a robust data protection infrastructure, compliant with data governance – and makes useful, clean and accurate data available to all authorized users at any time.yFiles lets you plan, map, and document the entire data lifecycle. Where does information come from, how is it stored, how is it used, and when and why does it need to be deleted? For every stage, you can visualize which regulations and policies have to be observed, and how this affects the data. In addition, you can show data ownership and record all data access events. yFiles automatically structures the visualization with automatic layouts and ensures clarity, searchability, and easy data quality management.
There is so much more you can do with yFiles
Do you have a data visualization challenge?
Ask our Customer Success Team!
We are pretty sure yFiles can support your use case, too.
Just talk to us – no strings attached!

Expertise
Numerous world-renowned companies, research institutes, and universities rely on the versatile possibilities of yFiles.
Case studies


free of charge!

Start your journey here– with the diagramming experts

Our team is happy to advise you – no strings attached. Let's talk about your project and find the perfect solution for your needs!
E-mail: hello@yworks.com
Your message has been sent.
Your request could not be sent. Please reload the page and try again.
If the problem persists, please report the error to webmaster@yworks.com.
Learn more in our privacy policy.